

Abstract
Objective
To evaluate psychometric properties of a widely used patient experience survey.
Data Sources
English-language responses to the Clinician & Group Consumer Assessment of Healthcare Providers and Systems (CG-CAHPS®) survey (n = 12,244) from a 2008 quality improvement initiative involving eight southern California medical groups.
Methods
We used an iterative hybrid ordinal logistic regression/item response theory differential item functioning (DIF) algorithm to identify items with DIF related to patient sociodemographic characteristics, duration of the physician–patient relationship, number of physician visits, and self-rated physical and mental health. We accounted for all sources of DIF and determined its cumulative impact.
Principal Findings
The upper end of the CG-CAHPS® performance range is measured with low precision. With sensitive settings, some items were found to have DIF. However, overall DIF impact was negligible, as 0.14 percent of participants had salient DIF impact. Latinos who spoke predominantly English at home had the highest prevalence of salient DIF impact at 0.26 percent.
Conclusions
The CG-CAHPS® functions similarly across commercially insured respondents from diverse backgrounds. Consequently, previously documented racial and ethnic group differences likely reflect true differences rather than measurement bias. The impact of low precision at the upper end of the scale should be clarified.
Keywords: Differential item functioning, racial and ethnic disparities, patients’ experiences of care, psychometrics, item response theory
Valid and reliable patient-reported ambulatory care experience measures are central to a balanced portfolio of quality measures and indispensable to the goal of a patient-centered health care system (Cleary 1999; Safran 2003; Browne et al. 2010). The Clinician & Group Consumer Assessment of Healthcare Providers and Systems (CG-CAHPS®) measures have been increasingly used in the United States in high stakes public reporting and pay-for-performance initiatives (Safran et al. 2006; Damberg et al. 2009; Rodriguez et al. 2009a, c). Consequently, the equivalent performance of patient experience measures across diverse racial and ethnic subgroups and respondents with varying levels of educational attainment is necessary so that equitable comparisons can be made (Casalino and Elster 2007; Friedberg et al. 2010).
Studies consistently indicate that members of some ethnic and racial minority groups tend to report worse primary care experiences compared with whites, controlling for differences in educational attainment (Weech-Maldonado et al. 2001, 2003, 2004; Hargraves and Hadley 2003; Hunt, Gaba, and Lavizzo-Mourey 2005; Beal, Hernandez, and Doty 2009). Some of these differences may stem from systematic reporting tendencies by some groups or differences in cognitive processes used when responding to questions. For example, Asian American patients are much less likely than other respondents to report the most favorable response options in health care surveys fielded across a variety of care settings (Murray-Garcia et al. 2000; Taira et al. 2001; Weech-Maldonado et al. 2001; Haviland et al. 2003; Lurie et al. 2003; Saha and Hickam 2003; Rodriguez et al. 2008). As a result, many believe that data indicating Asian American patients as having worse care experiences compared with whites are at least partially explained by negative reporting tendencies. On the other hand, Latinos are thought to have lower expectations compared with non-Latino whites because prior health care experiences, including repeated time periods without insurance coverage (Beal, Hernandez, and Doty 2009), affect their perspectives and lower their expectations of care (Schnittker and Liang 2006). These scenarios suggest that for equivalent quality of primary care experiences, Asian Americans may report more negative experiences than non-Latino whites on average, and Latinos may report better experiences than non-Latino whites. These scenarios provide examples of a phenomenon known as differential item functioning (DIF), or item-level measurement bias. DIF occurs when people from different groups with the same level of the latent trait measured by the test, for example, quality of patient care experiences, have a different probability of giving a certain response to a questionnaire (Holland and Wainer 1993; Camilli and Shepard 1994).
Previous studies assessing measurement equivalence of patient experience measures by race, ethnicity, or language have largely relied on classical test theory (Hurtado et al. 2005). Classical test theory approaches to assessing measurement equivalence are limited because they do not condition on the underlying level of satisfaction or quality of patient care experiences (Millsap and Everson 1993). Classical test theory approaches would ascribe any differences in observed scores across groups to bias. Other studies have used confirmatory factor analysis (CFA; Beattie, Nelson, and Lis 2007; Stewart et al. 2007) approaches to assess whether the factor structure of scales is invariant across groups, indicating the measurement of identical constructs (conceptual equivalence). Analyses of CAHPS measures have generally addressed the first level of invariance but have not addressed whether item loadings or thresholds were invariant across groups (Reise, Widaman, and Pugh 1993). Reise, Widaman, and Pugh caution that appropriate item loadings and thresholds (i.e., uniform and nonuniform DIF) must be attained to compare levels across groups.
Different levels of measurement invariance, that is, the equivalence in the structure of the measurement and the associated item loadings and thresholds between groups, can be tested by multiple-group CFA (MG-CFA; Gregorich 2006) or item response theory (IRT)-based DIF detection approaches. IRT describes the relationship between responses to an item and the level of the underlying construct (e.g., patients’ experiences of primary care). While previous research uses IRT approaches to examine DIF on patient experience measures (Morales, Reise, and Hays 2000; Ballard et al. 2005; Bann, Iannacchione, and Sekscenski 2005), these analyses have focused on a single cause of DIF rather than the combined impact of DIF related to multiple covariates. To our knowledge, techniques for assessing multiple sources of DIF (Crane et al. 2008b) have not been applied to patients’ experiences of care. The current study assesses the extent to which observed differences between racial and ethnic groups on patient care experience measures may be attributable to group-level DIF impact (measurement bias). We implement an algorithm to assess multiple sources of DIF simultaneously. As such, the shared variance among covariates is parsed out and the final DIF estimates reflect the cumulative effects of DIF by race/ethnicity, after accounting for DIF impact by other covariates. The rationale behind DIF analyses is that no demographic characteristic should interfere with the relationship between the latent trait measured by the test (patients’ experiences of ambulatory care) and item responses; expected item responses for people with the same level of the underlying latent trait should be the same, on average, regardless of demographic characteristics. By evaluating the cumulative impact of DIF across multiple covariates, we are able to address a much more important question than whether an item displays DIF with respect to a single covariate; we are able to address whether comparisons across groups are fair despite different demographic compositions for the groups.
Clarifying DIF impacts can allow for greater understanding of the phenomena underlying the previously documented racial and ethnic group disparities on patients’ experiences of ambulatory care. If significant DIF by race and ethnicity exists for the CG-CAHPS questions, the DIF estimation method can be used to account for DIF when making group comparisons on patient care experience measures. As scores that account for multiple sources of DIF represent the best unbiased estimates of patients’ experiences of care, accounting for any salient DIF effects can facilitate the equitable measurement of patients’ experiences of care across diverse patient populations. On the other hand, if DIF is negligible, then the English-language version of the instrument can be used by health care organizations to measure and compare patients’ experiences of ambulatory care for the diverse patient subgroups compared in the study.
Methods
Patient Survey and Sample
The study evaluated CG-CAHPS survey data from a quality improvement program involving eight southern California medical groups in 2008. Random samples of approximately 75 commercially insured patients per physician were sampled. Patients were eligible if they had at least one visit with their primary care physician (named in the survey) during the 6 months prior to the date the survey was fielded. The patient survey administration achieved a 39 percent response rate and includes 12,244 unique patients of 448 primary care physicians (average patients per physician = 27.3, SD = 11.0). Patients in the analytic sample all confirmed an ongoing relationship with the primary care physician named in the survey and endorsed having had at least one visit with the doctor during the prior 12 months. The survey was fielded in English and included the core CG-CAHPS® composite measures: physician communication (6 items), access to care (5 items), and office staff interactions (2 items; Browne et al. 2010). The survey included supplemental care coordination questions (2 items). All CG-CAHPS® core questions are experience-based reports and the study employed the 6-point response option version that includes the following categories: “Always,” “Almost Always,” “Usually,” “Sometimes,” “Almost Never,” and “Never.” Responses were scored with values ranging from 0 to 5, where “Never” = 0 and “Always” = 5. Appendix A includes a description of each of the 15 questions. Descriptions of the sociodemographic and health status questions from the survey instrument are detailed in Appendix B.
Analysis
First, we compared respondent sample characteristics across the race/ethnicity and primary language subgroups. We considered age, gender, education, primary language spoken at home, duration of the physician–patient relationship, body mass index (BMI), self-rated physical health, chronic disease count, and annual physician visits. We made group comparisons using ANOVA for continuous variables and chi-squared tests for dichotomous and categorical variables. We then calculated means, standard deviations, and item-scale correlations for the CG-CAHPS® items scored as a single scale.
Next, we evaluated the dimensionality of the CG-CAHPS® questions with CFA techniques using Mplus software (Muthen and Muthen 1998–2004). We applied the default WLSMV (weighted least squares accounting for the mean and variance) estimator (Muthen, du Toit, and Spisic 1997) to the polychoric correlation matrix to appropriately address the categorical data (Muthen, du Toit, and Spisic 1997; Beauducel and Herzberg 2006). Following McDonald (1999), we consider a standardized loading of 0.3 or higher to indicate a “salient” effect. As previous work suggests that CAHPS group survey questions are consistent with unidimensional and multidimensional factors (McDonald 1999; Reise, Morizot, and Hays 2007), we explored differences in model fit using single factor and bifactor CFA models. For the bifactor model, the CG-CAHPS® items assessing physician communication (Appendix A, Q1–Q6) and access to care issues (Appendix A, Q7–Q11) were modeled as a priori secondary dimensions, and the four supplemental items were modeled as residual correlations (Q12 with Q13 for care coordination, and Q14 with Q15 for office staff). Model fit was assessed using multiple criteria, including the Confirmatory Fit Index (CFI) and the Tucker–Lewis Index (TLI), where we consider good model fit to be >0.90. In addition, the root mean-squared error of approximation (RMSEA) was evaluated where <0.08 was considered to be a good fit (Reeve et al. 2007). We modified the bifactor structure based on item content analysis and results of the initial bifactor model by adding Q12 (how often doctor seemed up to date with specialist care) to the physician communication subdomain and removing the residual correlation between Q12 and Q13 (how often office staff followed up with test results).
Second, we fit the 15-item scale to the graded response model (Samejima 1969). This model is a polytomous extension of the two-parameter logistic IRT model appropriate for dichotomous items (Birnbaum 1968). We used Parscale (Muraki and Bock 2003) for these analyses. We inserted item parameters into an Excel spreadsheet with formulas for the test information curve and test characteristic curve (Mungas et al. 2000; Mungas, Reed, and Kramer 2003). Next, we evaluated the CG-CAHPS® items for DIF related to patient covariates, including the duration of the physician–patient relationship, annual number of physician visits, and self-rated physical and mental health because these factors have been consistently associated with patient care experiences in previous research (Zaslavsky et al. 2001; Kim, Zaslavsky, and Cleary 2005; O'Malley et al. 2005; Zaslavsky 2007; Eselius et al. 2008; Elliott et al. 2009; Johnson, Rodriguez, and Solorio 2010). We used an iterative hybrid IRT/ordinal logistic regression DIF detection procedure called difwithpar (Crane, van Belle, and Larson 2004; Crane et al. 2006). The difwithpar framework incorporates IRT scores rather than total scores. The difwithpar framework facilitates ascertainment of scores that account for multiple sources of DIF simultaneously, and it is increasingly used to calculate composite scores for a wide range of patient-reported measures (Crane et al. 2007a, b, 2008b; Hart et al. 2009). The framework involves iterative cycles of DIF detection and latent trait level (θ) estimation using IRT to account for items found with DIF. As a result of the multiple patient categories and comparisons being made, key patient covariates were collapsed so that a parsimonious set of groups could be examined.
All items are used to generate initial IRT estimates. For each item, difwithpar then fits a series of three nested regression models to identify items with DIF. We will illustrate with logistic regression, but this is readily extended to ordinal logistic regression for polytomous items such as the items in the CG-CAHPS®:
We introduce the estimated trait level θ, a dichotomous group term X, and item response Y, where Y = 1 means the item is endorsed or correct, and Y = 0 otherwise. The statistical significance of the interaction term (model 1) is used to test for nonuniform DIF. To test for uniform DIF, we evaluate the difference between the β1 coefficient from models 2 and 3. We evaluate the ratio (β1, model 2 − β1, model 3)/β1, model 2. If the absolute value of that ratio is large, we declare the item to have uniform DIF. These models are applied to every item for every covariate. To account for multiple testing, p-values <.005 were considered statistically significant for nonuniform DIF. In a large dataset such as that used in the present study, even with a threshold p-value of .005 we expected to identify large numbers of items with trivial nonuniform DIF. Unfortunately, there is not a good effect size measure for ordinal logistic regression for the interaction term (Crane et al. 2007c). We used a change in β of 5 percent criterion for uniform DIF. This criterion is an effect size measure and thus less influenced by sample size (Crane et al. 2007c).
Every item is analyzed using the three models to identify items with DIF. In the next step, difwithpar creates a new dataset, treating items identified with DIF separately in the groups analyzed. For example, if Q1 had DIF with respect to sex, difwithpar would create a new Q1 for males (missing for females) and a new Q1 for females (missing for males). This new dataset is then analyzed by Parscale to determine a new θ estimate for each person.
Difwithpar then analyzes the three models for each item, this time using the new θ that accounted for DIF found in the first round. Difwithpar again identifies items with DIF. These items are compared with those found in the first round. If the same items are identified, the algorithm stops. If not, differences are attributed to false-negative or false-positive spurious DIF findings, difwithpar creates a new dataset accounting for items with DIF, and the algorithm continues until the same items are identified with DIF.
We performed two different types of DIF analyses. First, we considered each covariate in turn, beginning with a naive θ, to determine the individual contribution to DIF made by each of the covariates. Second, we considered all the covariates found to have DIF in the first step and accounted for DIF with respect to all the covariates. For example, we performed analyses first for DIF with respect to age and found DIF for Q2. If DIF with respect to age was found for Q2, then we used the final θ score accounting for DIF with respect to age to address DIF with respect to the duration of the physician–patient relationship, the second covariate considered. For this second covariate, we evaluated all the initial CG-CAHPS items for DIF in everyone, with the exception of Q2, which was treated as two different items, one for older respondents and another for younger respondents. We then analyzed this dataset for DIF with respect to the duration of the physician–patient relationship. We continued in similar fashion to consider DIF in sequential fashion for the annual number of physician visits, self-reported physical health, self-reported mental health, and race. We then considered Latinos separately and evaluated items for DIF with respect to the primary language used at home (Spanish versus English). We similarly considered Asians separately and evaluated items for DIF with respect to the primary language used at home (English versus other language).
We used differences between the naive scores and the scores accounting for DIF with respect to all the covariates to address questions of cumulative DIF impact. Differences smaller than the median standard error of measurement (SEM) of the scale are considered negligible, while differences larger than this amount are “salient” (Crane et al. 2007a, 2008b). The SEM quantifies the amount of noise that is present in the instrument. The median value of the SEM quantifies the center of the “noise distribution” that is tolerated for the instrument. Thus, DIF impact larger than this amount represents impact greater than the tolerated level of noise for the instrument. A more sensitive threshold or a less sensitive threshold could be selected, with the consequence of detecting tiny and immaterial effects (too sensitive) or failing to detect modest but important effects (not sensitive enough). We plotted the differences across six race/ethnicity and language groups: (1) non-Latino whites; (2) African Americans; (3) Asians who primarily speak English at home; (4) Asians who primarily speak a language other than English at home; (5) Latinos who primarily speak English at home; and (6) Latinos who primarily speak Spanish at home.
Results
Most respondent sociodemographic and health characteristics differed significantly by race and ethnicity (Table 1). The most striking racial/ethnic differences in respondent characteristics include educational attainment, primary language spoken at home, and BMI. Item mean scores were highest for several items assessing physician communication (Q1, Q2, Q3, and Q6) where over 68 percent of the respondent sample reported the most favorable response (“Always” = 5). Standard deviations were largest for items with the smallest proportion of respondents providing responses due to item screeners (Q10, Q11, and Q13; Rodriguez et al. 2009b). Item-scale correlations were also lowest for Q11 and Q13.
Table 1.
Respondent Characteristics, by Race, Ethnicity, and Primary Language Spoken at Home
| Characteristic | Full Sample | White (Non-Latino) | Asian-English | Asian-Other Language | African American | Latino-English | Latino-Spanish | Other Race | Missing Race |
|---|---|---|---|---|---|---|---|---|---|
| n (% of total) | 12,244 | 6,575 (53.7) | 713 (5.8) | 304 (2.5) | 446 (3.6) | 2,709 (22.1) | 702 (5.7) | 208 (1.7) | 587 (4.8) |
| Age, mean (SD) | 49.6 (12.3) | 51.9 (11.9) | 48.5 (12.0) | 48.3 (11.3) | 50.2 (11.0) | 45.6 (12.5) | 45.5 (11.7) | 49.6 (12.3) | 48.9 (12.0)*** |
| Male gender | 39.4 | 39.4 | 38.3 | 40.5 | 36.8 | 34.3 | 40.2 | 34.6 | 40.4*** |
| Education (highest level) | |||||||||
| Not a high school graduate | 5.1 | 2.1 | 2.4 | 2.3 | 2.3 | 8.1 | 29.8 | 2.4 | 3.7*** |
| High school graduate | 18.4 | 17.3 | 6.3 | 6.0 | 17.6 | 25.2 | 23.8 | 17.4 | 13.7 |
| Some college | 42.4 | 45.5 | 23.7 | 20.5 | 45.8 | 45.7 | 29.0 | 42.5 | 39.2 |
| College graduate and beyond | 34.1 | 35.2 | 67.6 | 71.2 | 34.3 | 20.9 | 17.4 | 37.7 | 43.4 |
| Physician–patient relationship duration | |||||||||
| <1 year | 9.6 | 8.7 | 12.8 | 10.2 | 11.9 | 9.8 | 10.7 | 9.1 | 12.5*** |
| 1–3 years | 23.8 | 22.7 | 25.1 | 25.3 | 27.7 | 25.0 | 26.4 | 22.1 | 22.4 |
| 3–5 years | 19.7 | 19.5 | 18.3 | 20.4 | 17.5 | 20.4 | 19.9 | 26.0 | 20.5 |
| >5 years | 46.9 | 49.2 | 43.8 | 44.1 | 42.9 | 44.8 | 43.0 | 42.8 | 44.6 |
| Body mass index, mean (SD) | 28.0 (6.0) | 27.9 (6.1) | 24.7 (4.1) | 23.8 (3.8) | 29.8 (6.1) | 29.2 (6.1) | 28.4 (5.3) | 28.6 (7.3) | 27.3 (4.9) *** |
| Obese (%) | 29.8 | 29.6 | 10.8 | 7.2 | 39.9 | 37.1 | 31.8 | 31.3 | 22.0*** |
| Physical health (self-rated) | |||||||||
| Excellent/very good | 48.2 | 51.7 | 52.8 | 42.2 | 39.0 | 44.1 | 37.1 | 43.7 | 46.6*** |
| Good | 38.7 | 35.5 | 37.7 | 44.6 | 44.5 | 70.7 | 47.6 | 40.3 | 36.5 |
| Fair/poor | 13.1 | 11.8 | 9.6 | 13.2 | 16.5 | 15.2 | 15.3 | 16.0 | 16.9 |
| Mental health (self-rated) | |||||||||
| Excellent/very good | 66.3 | 66.8 | 72.9 | 65.4 | 63.9 | 66.1 | 60.1 | 65.0 | 63.5*** |
| Good | 24.7 | 24.0 | 22.0 | 28.7 | 26.2 | 24.3 | 30.6 | 25.6 | 27.0 |
| Fair/poor | 9.0 | 9.3 | 5.1 | 5.9 | 9.9 | 9.6 | 9.3 | 9.4 | 9.5 |
| Chronic illness (%) | 66.7 | 71.4 | 60.0 | 50.0 | 77.4 | 62.5 | 57.8 | 73.1 | 50.4*** |
| Practice visits (past 12 months) | |||||||||
| 1 or 2 | 40.1 | 41.3 | 40.0 | 47.7 | 35.4 | 38.6 | 34.9 | 34.1 | 42.4** |
| 3 or 4 | 38.9 | 38.3 | 40.1 | 32.9 | 40.1 | 40.3 | 39.9 | 41.8 | 37.5 |
| 5 or more visits | 21.0 | 20.4 | 19.9 | 19.4 | 24.4 | 21.2 | 25.2 | 24.0 | 20.1 |
Notes. All values reflect column percents with the exception of Body Mass Index and Age, which are presented as means and standard deviations. “Other Race” category includes respondents reporting Pacific Islander, Native American/Alaskan Native, or “Other” racial/ethnic background. “Asian-Other Language” includes Asian respondents who report primarily speaking a “language other than English” at home. Chronic illnesses assessed include hypertension, angina, congestive heart failure, diabetes, asthma, rheumatoid arthritis, cancer, depression, stomach problems, and headaches.
p < .01.
p < .001.
Consistent with previous research on the dimensionality of patient experience measures (Ballard et al. 2005; Reise, Morizot, and Hays 2007), our CFA results for the CG-CAHPS® items are consistent with both unidimensional and multidimensional solutions (Appendix C). The single-factor model fit was inconsistent across fit indices, with the CFI = 0.92, TLI = 0.96, and RMSEA = 0.23. In contrast, the initial bifactor model (which treated the access items as a secondary factor and modeled the supplemental items as two residual correlations) had better fit across indices, with CFI = 0.98, TLI = 0.99, and RMSEA = 0.09. We noted the negative residual correlation between Q12 and Q13, and tried a separate model with Q12 considered as an indicator of the first subdomain. This model had further improved fit, with CFI = 0.99, TLI = 1.00, and RMSEA = 0.05. The loadings for the primary factor for the single-factor model and the loadings for the primary factor for the bifactor models were compared. The strength of association of the primary factor and general factor was somewhat lower on average in the single-factor model compared with the bifactor models. Nevertheless, in the bifactor model factor loadings on the general factor were all well over 0.3. McDonald argues that in this instance the scale may be considered “sufficiently homogeneous” for methods that require homogeneity, such as IRT. Furthermore, estimated factor scores from the single-factor and bifactor models were highly correlated (r = 0.97). If standard errors are used from IRT, these results suggest those standard errors could be smaller when a single-factor model (i.e., the IRT model) is used rather than a bifactor model. However, as noted in the three formulas (models 1–3), only the estimated factor scores are used in DIF detection, and those factor scores are very highly correlated with the scores from the bifactor models with better fit.
Appendix D is a histogram of estimates of IRT scores for patients’ overall experiences of care. Parscale generates scores such that the mean score in the cohort studied is 0 and the standard deviation (SD) is 1, similar to a z score. While there is a considerable ceiling effect (high proportion of respondents with the highest level on the test), the remainder of the scores are approximately normally distributed. Figure 1A depicts the test characteristic curve, which is a plot of the most likely standard score associated with each IRT estimate of patient experiences of care. To the left of 0, the test characteristic curve increases linearly. However, to the right of 0, the slope of the test characteristic curve flattens, as there are few items with difficulty levels in this region. There are approximately 30 standard score points between IRT scores of 0 and −1.8, but only 10 standard score points between 0 and +1.8. Figure 1B illustrates the test information curve and the SEM at each level of patient experiences of care. Measurement precision is satisfactory at the lower end of the scale, but not at the higher end. At the ceiling score of +1.8, the SEM is more than three times that of people with scores lower than −1, indicating heterogeneous measurement precision across the scores. Scores of respondents at the lower end can be differentiated from each other with high precision, while scores of respondents at the upper end cannot be reliably differentiated from one another.
Figure 1.
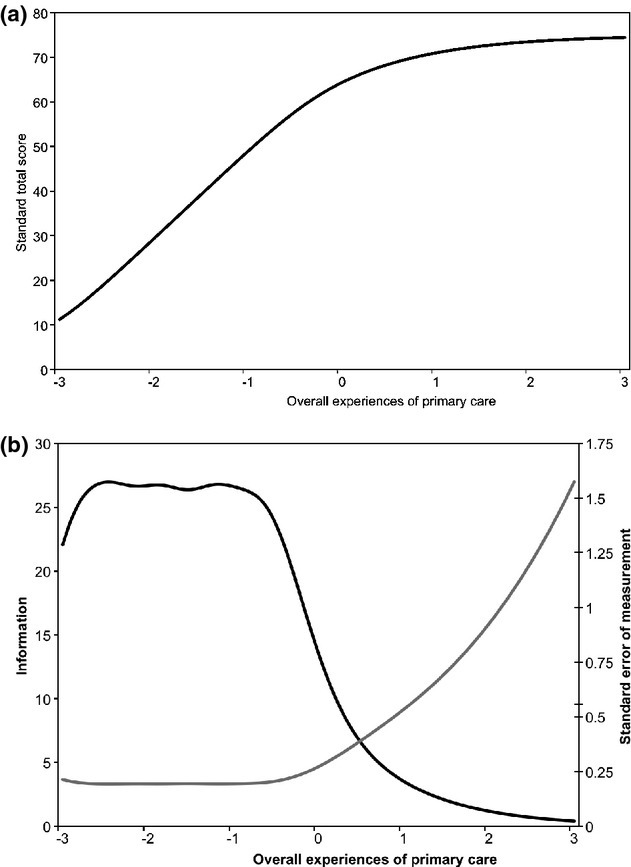
Test Characteristic (A) and Information (B) Curves.
Notes. (a) The test characteristic curve, which is a plot of the most likely standard score associated with each level of overall primary care experience. This curve shows that the distribution of items is not uniform across the range measured by the scale, as the slope of the curve is higher to the left of about 0 than to the right. This finding suggests problems with using standard scores in regression models; item response theory (IRT) scores should be used instead (Crane et al. 2008a). (b) The test information curve (black curve) and the standard error of measurement curve (gray curve) at each level of overall primary care experience are shown. These curves further document the uneven distribution of items across the scale. Test information is adequate to the left of 0 but drops to the right of 0. This is reflected by standard error of measurement curve, which is characterized by large amounts of measurement error at the top end of the scale. This figure is analogous to the alpha coefficient commonly reported using classical test theory. Unlike classical test theory, however, IRT does not assume that measurement precision is consistent across the entire scale, and it does not summarize measurement with a single omnibus statistic such as the alpha coefficient. See McDonald (1999) for further discussion.
Uniform DIF was not detected by any respondent characteristics examined. Table 2 summarizes the nonuniform DIF results for the sociodemographic covariates. Q11 (wait time in waiting room and exam room) had nonuniform DIF with respect to many respondent characteristics, including primary language spoken at home (p < .001) among Latinos, physician–patient relationship duration (p < .001), the number of physician visits (p = .002), self-rated physical health (p < .001), and self-rated mental health (p < .001). No other item had consistent nonuniform DIF across multiple covariates.
Table 2.
Nonuniform Differential Item Functioning (DIF) Results for Select Respondent Covariates*
| Age (†) | Sex (‡) | Race (§) | Asian- Language (¶) | Latino- Language (∥) | Education (**) | Physician–Patient Relationship Duration (††) | Visits to Physician (‡‡) | Self-Reported Physical Health (§§) | Self-Reported Mental Health (¶¶) | |
|---|---|---|---|---|---|---|---|---|---|---|
| Group 1 | 5,575 | 7,575 | 6,575 | 713 | 2709 | 165 | 4,073 | 9,676 | 6,252 | 8,007 |
| Group 2 | 6,669 | 4,669 | 446 | 304 | 702 | 11,873 | 8,121 | 2,568 | 5,810 | 4,072 |
| Group 3 | 2,709 | |||||||||
| Group 4 | 3,411 | |||||||||
| Q1 | 0.07 | 0.45 | 0.75 | 0.35 | 0.75 | 0.91 | 0.61 | 0.84 | 0.85 | 0.78 |
| Q2 | 0.002 | 0.24 | 0.12 | 0.17 | 0.18 | 0.57 | 0.94 | 0.02 | 0.50 | 0.75 |
| Q3 | 0.08 | 0.014 | 0.15 | 0.28 | 0.61 | 0.89 | 0.10 | 0.19 | 0.25 | 0.58 |
| Q4 | 0.39 | 0.07 | 0.10 | 0.67 | 0.06 | 0.67 | 0.32 | 0.78 | 0.63 | 0.06 |
| Q5 | 0.35 | 0.93 | 0.02 | 0.61 | 0.81 | 0.66 | 0.66 | 0.25 | 0.26 | 0.31 |
| Q6 | 0.78 | 0.30 | <0.001 | 0.03 | 0.10 | 0.48 | 1.00 | 0.89 | 0.14 | 0.89 |
| Q7 | 0.46 | 0.48 | 0.35 | 0.76 | 0.69 | 0.84 | 0.12 | 0.24 | <0.001 | 0.005 |
| Q8 | 0.47 | 0.87 | 0.80 | 0.89 | 0.21 | 0.35 | 0.013 | 0.31 | 0.02 | 0.14 |
| Q9 | 0.12 | 0.12 | 0.26 | 0.60 | 0.79 | 0.95 | 0.55 | 0.82 | 0.008 | <0.001 |
| Q10 | 0.06 | 0.84 | 0.22 | 0.86 | 0.33 | 0.67 | 0.12 | 0.07 | 0.010 | 0.27 |
| Q11 | 0.51 | 0.33 | 0.01 | 0.41 | <0.001 | 0.03 | <0.001 | 0.002 | <0.001 | <0.001 |
| Q12 | 0.36 | 0.36 | 0.61 | 0.54 | 0.40 | 0.69 | 0.37 | 0.13 | 0.16 | 0.05 |
| Q13 | 0.82 | 0.15 | 0.41 | 0.81 | 0.31 | 0.96 | 0.92 | 0.88 | 0.11 | 0.11 |
| Q14 | 0.23 | 0.70 | 0.01 | 0.55 | 0.58 | 0.09 | 0.007 | 0.08 | <0.001 | <0.001 |
| Q15 | 0.76 | 0.11 | 0.05 | 0.05 | 0.96 | 0.54 | 0.05 | 0.46 | 0.02 | 0.19 |
Notes.
None of these items had uniform DIF. Values in cells represent numbers of participants (top 2–4 rows) and p-values from ordinal logistic regression models (below the gray line). We used a threshold of p < .005 to identify items with nonuniform DIF; p-values below this threshold are shown in bold.
Group 1: age up to 49 years. Group 2: age 50 or more.
Group 1: females. Group 2: males.
Group 1: white (non-Latino; n = 6,575). Group 2: African American (n = 446). Group 3: Asian (n = 2,709). Group 4: Latino (n = 3,411). Excludes patients categorized as “other race” or with missing race.
Group 1: Asian-English (n = 713). Group 2: Asian-Other Language (n = 304).
Group 1: Latino-English (n = 2,709). Group 2: Latino-Spanish (n = 702).
Group 1: 8 years or fewer. Group 2: 9 years or more. The missing data of 206 people for this covariate were excluded from this analysis. When we categorized education as high school graduate or less, no items had DIF.
Group 1: up to 3 years. Group 2: 3 or more years.
Group 1: 4 or fewer visits. Group 2: 5 or more visits.
Group 1: Excellent or very good self-reported physical health. Group 2: good, fair, or poor self-reported physical health.
Group 1: Excellent or very good self-reported mental health. Group 2: good, fair, or poor self-reported mental health.
We plotted differences between scores accounting for all sources of DIF and the naive scores that ignored DIF separately across racial and ethnic subgroups (Figure 2). The vertical lines indicate 1× and 2× the median SEM in the sample, the threshold for indicating salient DIF. The box-and-whiskers plots indicate the distribution of these difference scores. The box identifies the interquartile range, from the 25th to the 75th percentiles. For each race/ethnicity group this box is narrow and very close to 0, indicating no DIF impact. The whiskers indicate 1½ times the spread of the box; the whiskers are well inside the vertical lines indicating ±1 SEM. Observations more extreme than the whiskers are indicated with dots. A very small number of dots extend beyond 1 SEM. In all, no participants had salient DIF for Asians who spoke languages other than English at home, African Americans, or Latinos who spoke Spanish at home, while salient DIF was present for <1 percent of the members of all other groups (0.13 percent of non-Latino whites, 0.15 percent of Asians who spoke English at home, and 0.26 percent of Latino who spoke English at home).
Figure 2.
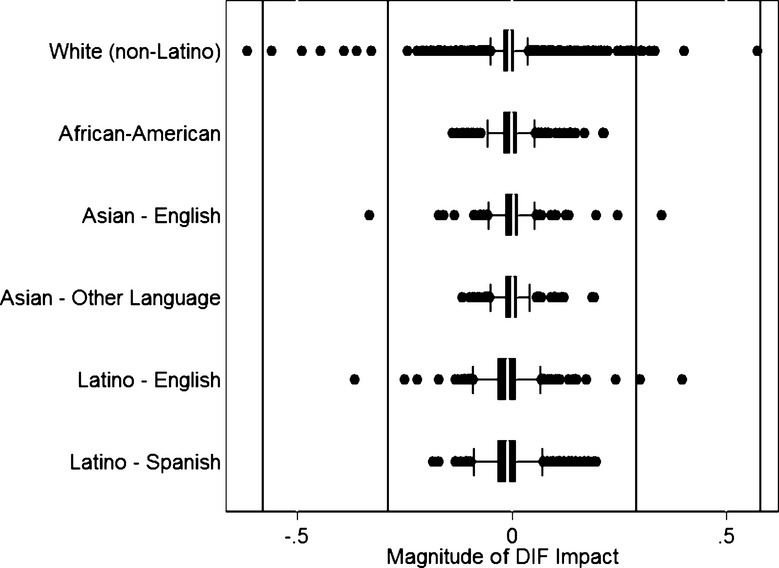
Differential Item Functioning (DIF) Impact, by Patient Race, Ethnicity, and Primary Language Spoken at Home.
Notes. This figure plots the distributions of differences between naive scores ignoring DIF and scores that account for all sources of DIF across the six race-ethnicity groups evaluated in the study. Differences of 0 indicate no DIF impact. We use the median standard error of measurement for the scale to demarcate levels of DIF impact that can be distinguished from negligible effects (dark vertical lines); DIF greater than this level is referred to as “salient” DIF. The box represents the 25th and 75th percentiles of the distribution, and the whiskers represent 1½ times the distribution of the box. Observations more extreme than the whiskers are shown with dots. This graph depicts that the box denoting the interquartile range is very close to 0, and that of the whiskers are well within the dark vertical lines denoting the standard error of measurement. A small and negligible number of people have salient DIF impact when accounting for all the sources of DIF considered here. See text for further details.
Discussion
Consistent with previous research of the dimensionality of other CAHPS® measures (Reise, Morizot, and Hays 2007), our results suggest that the CG-CAHPS® measures can be modeled either as a single-factor construct or as a multidimensional construct. For applications of IRT using the scores, such as the ordinal logistic regression/IRT DIF algorithm employed here, these findings suggest that the IRT model may be appropriate. However, if measurement precision is important, such as in a computerized adaptive test, a scoring strategy incorporating the bifactor structure may be more appropriate. Although the distribution of scores was approximately normal (Appendix C), the test characteristic and item information curves (Figure 1) indicate an inability of the measure to discriminate respondents’ overall experiences of care at the upper end of the scale. The inability to discriminate patient scores at the upper end of the performance continuum, for example, the 80th percentile from the 95th percentile, indicates that small differences at the top of physician performance distribution might be measured with low precision. It remains unclear the extent to which physician performance comparisons at the upper end of the scale can be made reliably. Considering the use of the CG-CAHPS® in pay-for-performance strategies (Pearson et al. 2008; Damberg et al. 2009; Rodriguez et al. 2009a), this topic seems especially important for subsequent analyses.
The CG-CAHPS® survey does not function in systematically different ways for the racial and ethnic minority groups examined. Consequently, previously documented racial and ethnic group differences on the CG-CAHPS measures likely reflect true differences rather than measurement bias. We evaluated CG-CAHPS® items for DIF with respect to a large number of covariates and found a few items with nonuniform DIF, which was not surprising given the reliance on statistical significance for nonuniform DIF and the large sample size. When we accounted for all sources of DIF, we found negligible DIF impact. Previous studies demonstrate that respondents from some ethnic minority groups have extreme reporting tendencies on rating scales (higher probability of using the high and low ends of the rating scale versus the middle; Weech-Maldonado et al. 2008). Our results suggest that experience-based reports may be less vulnerable to DIF by design. For example, rather than asking patients to provide a rating (“On a scale from 0 to 10, how would you rate …”), the reports that comprise the CG-CAHPS® measure specific patient experiences (“how often …”). Compared with ratings, reports may be less subject to bias because of different norms or standards that vary by cultural factors (Harris-Kojetin et al. 1999; Schnaier et al. 1999).
The one important exception to the general DIF pattern was Q11 (wait in the office), where nonuniform DIF was found by primary language spoken at home for Latinos, the duration of the physician–patient relationship, the number of physician visits made in the prior year, and self-rated physical and mental health. DIF may stem from the fact that the question uses a concrete time interval (15 minutes) for respondents to consider rather than a qualitative anchor, that is, the extent to which the physician “listens carefully.” Different wait expectations may result in DIF. Previous research suggests that Latinos have a higher tolerance for waits and that worse experiences of correlated are not as strongly correlated with overall impressions of care for Latinos compared with whites (Wilkins et al. 2011). Our results indicate that scale developers should follow up with cognitive interviews to examine the sources for DIF for experiences of care that focus on time and/or waits.
Our study results should be viewed in light of important limitations. First, although the respondent sample is large and diverse, all patients are commercially insured and report an established relationship with a primary care physician. The commercially insured and established respondent sample is much more educated and less diverse than the overall primary care patient population in southern California. Different expectations of care among uninsured or Medicaid-insured patients might be associated with DIF with respect to insurance status and we are unable to assess these effects with the data we have. In addition, DIF with respect to CG-CAHPS survey language (Bann, Iannacchione, and Sekscenski 2005) was not examined and equivalence of the scale by survey language, for example, Spanish versus English versions, should be clarified. Second, the survey response rate (39 percent) was modest, and differential patient nonresponse might introduce bias. As a result of the nature of the data (used for quality improvement purposes), limited data are available on the characteristics of the outgoing survey patient sample. Patient characteristics used for DIF assessment were all self-reported and ascertained in the survey. As a result, we are unable to assess differences in sociodemographic or health status differences among respondents versus nonrespondents. Vulnerable patients are less likely to respond to mailed surveys than other patients (Zaslavsky, Zaborski, and Cleary 2002), so the racial/ethnic and primary language subgroup comparisons were conducted with a favorable selection of patient samples across subgroups. Previous studies, however, underscore the appropriateness of DIF detection for small or limited respondent samples (Morales, Reise, and Hays 2000; Lai, Teresi, and Gershon 2005), indicating that DIF detection methods are appropriate to employ using the study data. Future research should clarify the extent to which the sample representativeness affects the measurement of DIF impact on patient experience measures.
Third, all surveys were completed by mail and therefore assessment of DIF by survey mode was not possible. Finally, a unidimensional logistic regression IRT approach was used to identify DIF items even though the fit statistics were better for the bifactor model. The loadings on the primary factor for the single-factor model are not very different than the bifactor model, however, indicating that the scale is sufficiently unidimensional to employ a single-factor model such as IRT. The bifactor model findings are useful because they facilitate the use of an extensive framework for DIF analyses, and they are important intermediate results because they affirm an important assumption (a sufficiently unidimensional scale) made by our analyses. As DIF detection procedures are developed for bifactor models and other structures, it will be interesting and important to repeat these analyses to ensure that the findings are robust. At present, especially for the multiple covariate case considered here, procedures for analyzing and accounting for DIF with bifactor structures are not yet widely available. The current analyses represent the state of the art, and to our knowledge, is the first attempt to apply DIF analyses to the CG-CAHPS measures.
In conclusion, the English version of the CG-CAHPS® survey functions similarly across commercially insured respondents from diverse backgrounds. As a result, the racial and ethnic differences previously documented on the CG-CAHPS® measures (Rodriguez et al. 2008) likely represent “true” differences rather than DIF. Future research, however, should examine whether the measures function differently by patient insurance status, as experiences of uninsurance might affect respondent expectations of care and may be associated with DIF. Importantly, the CG-CAHPS® test characteristic and information curves raise concerns about the use of standard scores of the instrument to measure patients' experiences over time because the standard scores have a nonlinear relationship with the underlying trait level measured by the test (Crane et al. 2008a). Furthermore, it will be important for researchers to clarify the extent to which physicians with performance at the top end of the scale can be reliably differentiated from one another.
Acknowledgments
Joint Acknowledgment/Disclosure Statement: The Robert Wood Johnson Foundation's New Connections Program funded the research project.
Disclosures: None.
Disclaimers: None.
NOTES
The survey was fielded in English to the commercially insured patient sample. The survey invitation letter included instructions in Spanish to call number 1-800 to receive a Spanish-language survey if the respondent wanted a Spanish-language survey mailed for completion. Not surprisingly, the number of patients choosing to complete a Spanish-language version of the survey is quite small (n = 70). Consistent with our aim of examining the equivalence of English-language responses to the survey by various patient subgroups, we exclude the Spanish-language responses from the analysis.
SUPPORTING INFORMATION
Additional supporting information may be found in the online version of this article:
Appendix SA1: Author Matrix.
Appendix A: Clinician & Group CAHPS® Questions.
Appendix B: Sociodemographic and Health Status Questions.
Appendix C: Results of Different Confirmatory Factor Models on the CG-CAHPS® Items, Full Sample (n = 12,244).
Appendix D: Histogram of Overall Primary Care Experiences Scores.
Please note: Wiley-Blackwell is not responsible for the content or functionality of any supporting materials supplied by the authors. Any queries (other than missing material) should be directed to the corresponding author for the article.
References
- Ballard C, Margallo-Lana M, Juszczak E, Douglas S, Swann A, Thomas A, O'Brien J, Everratt A, Sadler S, Maddison C, Lee L, Bannister C, Elvish R, Jacoby R. “Quetiapine and Rivastigmine and Cognitive Decline in Alzheimer's Disease: Randomised Double Blind Placebo Controlled Trial.”. British Medical Journal. 2005;330(7496):874. doi: 10.1136/bmj.38369.459988.8F. [DOI] [PMC free article] [PubMed] [Google Scholar]
- Bann CM, Iannacchione VG, Sekscenski ES. “Evaluating the Effect of Translation on Spanish Speakers’ Ratings of Medicare.”. Health Care Financing Review. 2005;26(4):51–65. [PMC free article] [PubMed] [Google Scholar]
- Beal A, Hernandez S, Doty M. “Latino Access to the Patient-Centered Medical Home.”. Journal of General Internal Medicine. 2009;24(Suppl 3):514–20. doi: 10.1007/s11606-009-1119-1. [DOI] [PMC free article] [PubMed] [Google Scholar]
- Beattie PF, Nelson RM, Lis A. “Spanish-Language Version of the Medrisk Instrument for Measuring Patient Satisfaction with Physical Therapy Care (MRPS): Preliminary Validation”. Physical Therapy. 2007;87(6):793–800. doi: 10.2522/ptj.20060313. [DOI] [PubMed] [Google Scholar]
- Beauducel A, Herzberg PY. “On the Performance of Maximum Likelihood versus Means and Variance Adjusted Weighted Least Squares Estimation in CFA.”. Structural Equation Modeling. 2006;13(2):186–203. [Google Scholar]
- Birnbaum A. “Some latent trait models”. In: Lord FM, Novick MR, editors. Statistical Theories of Mental Test Scores. Reading, MA: Addison-Wesley; 1968. [Google Scholar]
- Browne K, Roseman D, Shaller D, Edgman-Levitan S. “Measuring Patient Experience as a Strategy for Improving Primary Care.”. Health Affairs (Millwood) 2010;29(5):921–5. doi: 10.1377/hlthaff.2010.0238. [DOI] [PubMed] [Google Scholar]
- Camilli G, Shepard LA. Methods for Identifying Biased Test Items. Thousand Oaks, CA: Sage Publications; 1994. [Google Scholar]
- Casalino LP, Elster A. “Will Pay-for-Performance and Quality Reporting Affect Health Care Disparities?”. Health Affairs. 2007;26(3):w405–14. doi: 10.1377/hlthaff.26.3.w405. [DOI] [PubMed] [Google Scholar]
- Cleary PD. “The Increasing Importance of Patient Surveys. Now That Sound Methods Exist, Patient Surveys Can Facilitate Improvement.”. British Medical Journal. 1999;319(7212):720–1. doi: 10.1136/bmj.319.7212.720. [DOI] [PMC free article] [PubMed] [Google Scholar]
- Crane PK, van Belle G, Larson EB. “Test Bias in a Cognitive Test: Differential Item Functioning in the CASI.”. Statistics in Medicine. 2004;23(2):241–56. doi: 10.1002/sim.1713. [DOI] [PubMed] [Google Scholar]
- Crane PK, Gibbons LE, Jolley L, van Belle G. “Differential Item Functioning Analysis with Ordinal Logistic Regression Techniques. Difdetect and Difwithpar.”. Medical Care. 2006;44(11 Suppl 3):S115–23. doi: 10.1097/01.mlr.0000245183.28384.ed. [DOI] [PubMed] [Google Scholar]
- Crane PK, Cetin K, Cook KF, Johnson K, Deyo R, Amtmann D. “Differential Item Functioning Impact in a Modified Version of the Roland-Morris Disability Questionnaire.”. Quality of Life Research. 2007a;16(6):981–90. doi: 10.1007/s11136-007-9200-x. [DOI] [PubMed] [Google Scholar]
- Crane PK, Gibbons LE, Narasimhalu K, Lai JS, Cella D. “Rapid Detection of Differential Item Functioning in Assessments of Health-Related Quality of Life: The Functional Assessment of Cancer Therapy.”. Quality of Life Research. 2007b;16(1):101–14. doi: 10.1007/s11136-006-0035-7. [DOI] [PubMed] [Google Scholar]
- Crane PK, Gibbons LE, Ocepek-Welikson K, Cook K, Cella D, Narasimhalu K, Hays RD, Teresi JA. “A Comparison of Three Sets of Criteria for Determining the Presence of Differential Item Functioning Using Ordinal Logistic Regression.”. Quality of Life Research. 2007c;16(Suppl 1):69–84. doi: 10.1007/s11136-007-9185-5. [DOI] [PubMed] [Google Scholar]
- Crane PK, Narasimhalu K, Gibbons LE, Mungas DM, Haneuse S, Larson EB, Kuller L, Hall K, van Belle G. “Item Response Theory Facilitated Cocalibrating Cognitive Tests and Reduced Bias in Estimated Rates of Decline.”. Journal of Clinical Epidemiology. 2008a;61(10):1018–27. doi: 10.1016/j.jclinepi.2007.11.011. [DOI] [PMC free article] [PubMed] [Google Scholar]
- Crane PK, Narasimhalu K, Gibbons LE, Pedraza O, Mehta KM, Tang Y, Manly JJ, Reed BR, Mungas DM. “Composite Scores for Executive Function Items: Demographic Heterogeneity and Relationships with Quantitative Magnetic Resonance Imaging.”. Journal of the International Neuropsychological Society. 2008b;14(5):746–59. doi: 10.1017/S1355617708081162. [DOI] [PMC free article] [PubMed] [Google Scholar]
- Damberg CL, Raube K, Teleki SS, Dela Cruz E. “Taking Stock of Pay-for-Performance: A Candid Assessment from the Front Lines.”. Health Affairs (Millwood) 2009;28(2):517–25. doi: 10.1377/hlthaff.28.2.517. [DOI] [PubMed] [Google Scholar]
- Elliott MN, Zaslavsky AM, Goldstein E, Lehrman W, Hambarsoomians K, Beckett MK, Giordano L. “Effects of Survey Mode, Patient Mix, and Nonresponse on CAHPS Hospital Survey Scores.”. Health Services Research. 2009;44(2 Pt 1):501–18. doi: 10.1111/j.1475-6773.2008.00914.x. [DOI] [PMC free article] [PubMed] [Google Scholar]
- Eselius LL, Cleary PD, Zaslavsky AM, Huskamp HA, Busch SH. “Case-Mix Adjustment of Consumer Reports about Managed Behavioral Health Care and Health Plans.”. Health Services Research. 2008;43(6):2014–32. doi: 10.1111/j.1475-6773.2008.00894.x. [DOI] [PMC free article] [PubMed] [Google Scholar]
- Friedberg MW, Safran DG, Coltin K, Dresser M, Schneider EC. “Paying for Performance in Primary Care: Potential Impact on Practices and Disparities.”. Health Affairs (Millwood) 2010;29(5):926–32. doi: 10.1377/hlthaff.2009.0985. [DOI] [PubMed] [Google Scholar]
- Gregorich SE. “Do Self-Report Instruments Allow Meaningful Comparisons across Diverse Population Groups? Testing Measurement Invariance Using the Confirmatory Factor Analysis Framework.”. Medical Care. 2006;44(11 Suppl 3):S78–94. doi: 10.1097/01.mlr.0000245454.12228.8f. [DOI] [PMC free article] [PubMed] [Google Scholar]
- Hargraves JL, Hadley J. “The Contribution of Insurance Coverage and Community Resources to Reducing Racial/Ethnic Disparities in Access to Care.”. Health Services Research. 2003;38(3):809–29. doi: 10.1111/1475-6773.00148. [DOI] [PMC free article] [PubMed] [Google Scholar]
- Harris-Kojetin LD, Fowler FJ, Jr, Brown JA, Schnaier JA, Sweeny SF. “The Use of Cognitive Testing to Develop and Evaluate CAHPS 1.0 Core Survey Items. Consumer Assessment of Health Plans Study.”. Medical Care. 1999;37(3 Suppl):MS10–21. doi: 10.1097/00005650-199903001-00002. [DOI] [PubMed] [Google Scholar]
- Hart DL, Deutscher D, Crane PK, Wang YC. “Differential Item Functioning Was Negligible in an Adaptive Test of Functional Status for Patients with Knee Impairments Who Spoke English or Hebrew.”. Quality of Life Research. 2009;18(8):1067–83. doi: 10.1007/s11136-009-9517-8. [DOI] [PubMed] [Google Scholar]
- Haviland MG, Morales LS, Reise SP, Hays RD. “Do Health Care Ratings Differ by Race or Ethnicity?”. Joint Commission Journal on Quality and Patient Safety. 2003;29(3):134–45. doi: 10.1016/s1549-3741(03)29016-x. [DOI] [PubMed] [Google Scholar]
- Holland PW, Wainer H. Differential Item Functioning. Hillsdale, NJ: Erlbaum; 1993. [Google Scholar]
- Hunt KA, Gaba A, Lavizzo-Mourey R. “Racial and Ethnic Disparities and Perceptions of Health Care: Does Health Plan Type Matter?”. Health Services Research. 2005;40(2):551–76. doi: 10.1111/j.1475-6773.2005.00372.x. [DOI] [PMC free article] [PubMed] [Google Scholar]
- Hurtado MP, Angeles J, Blahut SA, Hays RD. “Assessment of the Equivalence of the Spanish and English Versions of the CAHPS Hospital Survey on the Quality of Inpatient Care.”. Health Services Research. 2005;40(6 Pt 2):2140–61. doi: 10.1111/j.1475-6773.2005.00469.x. [DOI] [PMC free article] [PubMed] [Google Scholar]
- Johnson ML, Rodriguez HP, Solorio MR. “Case-Mix Adjustment and the Comparison of Community Health Center Performance on Patient Experience Measures.”. Health Services Research. 2010;45(3):670–90. doi: 10.1111/j.1475-6773.2010.01101.x. [DOI] [PMC free article] [PubMed] [Google Scholar]
- Kim M, Zaslavsky AM, Cleary PD. “Adjusting Pediatric Consumer Assessment of Health Plans Study (CAHPS) Scores to Ensure Fair Comparison of Health Plan Performances.”. Medical Care. 2005;43(1):44–52. [PubMed] [Google Scholar]
- Lai JS, Teresi J, Gershon R. “Procedures for the Analysis of Differential Item Functioning (DIF) for Small Sample Sizes.”. Evaluation & the Health Professions. 2005;28(3):283–94. doi: 10.1177/0163278705278276. [DOI] [PubMed] [Google Scholar]
- Lurie N, Zhan C, Sangl J, Bierman AS, Sekscenski ES. “Variation in Racial and Ethnic Differences in Consumer Assessments of Health Care.”. American Journal of Managed Care. 2003;9(7):502–9. [PubMed] [Google Scholar]
- McDonald RP. Test Theory: A Unified Treatment. Mahwah, NJ: Lawrence Erlbaum Associates; 1999. [Google Scholar]
- Millsap RE, Everson HT. “Methodology Review: Statistical Approaches for Assessing Measurement Bias.”. Applied Psychological Measurement. 1993;17(14):297–334. [Google Scholar]
- Morales LS, Reise SP, Hays RD. “Evaluating the Equivalence of Health Care Ratings by Whites and Hispanics.”. Medical Care. 2000;38(5):517–27. doi: 10.1097/00005650-200005000-00008. [DOI] [PMC free article] [PubMed] [Google Scholar]
- Mungas D, Reed BR, Kramer JH. “Psychometrically Matched Measures of Global Cognition, Memory, and Executive Function for Assessment of Cognitive Decline in Older Persons.”. Neuropsychology. 2003;17(3):380–92. doi: 10.1037/0894-4105.17.3.380. [DOI] [PubMed] [Google Scholar]
- Mungas D, Reed BR, Marshall SC, Gonzalez HM. “Development of Psychometrically Matched English and Spanish Language Neuropsychological Tests for Older Persons.”. Neuropsychology. 2000;14(2):209–23. doi: 10.1037//0894-4105.14.2.209. [DOI] [PubMed] [Google Scholar]
- Muraki E, R. D Bock. PARSCALE 4: IRT Item Analysis and Test Scoring for Rating-Scale Data. Chicago, IL: Scientific Software; 2003. [computer program]. [Google Scholar]
- Murray-Garcia JL, Selby JV, Schmittdiel J, Grumbach K, Quesenberry CP., Jr “Racial and Ethnic Differences in a Patient Survey: Patients’ Values, Ratings, and Reports Regarding Physician Primary Care Performance in a Large Health Maintenance Organization.”. Medical Care. 2000;38(3):300–10. doi: 10.1097/00005650-200003000-00007. [DOI] [PubMed] [Google Scholar]
- Muthen B, du Toit SHC, Spisic D. “Robust Inference Using Weighted Least Squared and Quadratic Estimating Equations in Latent Variable Modeling with Categorical and Continuous Outcomes”. Psychometrika. 1997 [accessed on July 15, 2011]. Available at http://www.gseis.ucla.edu/faculty/muthen/articles/Article_075.pdf. [Google Scholar]
- Muthen LK, Muthen BO. Mplus User's Guide. Los Angeles: Muthen & Muthen; 1998–2004. [Google Scholar]
- O'Malley AJ, Zaslavsky AM, Elliott MN, Zaborski L, Cleary PD. “Case-Mix Adjustment of the CAHPS Hospital Survey”. Health Services Research. 2005;40(6 Pt 2):2162–81. doi: 10.1111/j.1475-6773.2005.00470.x. [DOI] [PMC free article] [PubMed] [Google Scholar]
- Pearson SD, Schneider EC, Kleinman KP, Coltin KL, Singer JA. “The Impact of Pay-for-Performance on Health Care Quality in Massachusetts, 2001–2003.”. Health Affairs (Millwood) 2008;27(4):1167–76. doi: 10.1377/hlthaff.27.4.1167. [DOI] [PubMed] [Google Scholar]
- Reeve BB, Hays RD, Bjorner JB, Cook KF, Crane PK, Teresi JA, Thissen D, Revicki DA, Weiss DJ, Hambleton RK, Liu H, Gershon R, Reise SP, Lai JS, Cella D. “Psychometric Evaluation and Calibration of Health-Related Quality of Life Item Banks: Plans for the Patient-Reported Outcomes Measurement Information System (PROMIS)”. Medical Care. 2007;45(5 Suppl 1):S22–31. doi: 10.1097/01.mlr.0000250483.85507.04. [DOI] [PubMed] [Google Scholar]
- Reise SP, Morizot J, Hays RD. “The Role of the Bifactor Model in Resolving Dimensionality Issues in Health Outcomes Measures.”. Quality of Life Research. 2007;16(Suppl 1):19–31. doi: 10.1007/s11136-007-9183-7. [DOI] [PubMed] [Google Scholar]
- Reise SP, Widaman KF, Pugh RH. “Confirmatory Factor Analysis and Item Response Theory: Two Approaches for Exploring Measurement Invariance.”. Psychological Bulletin. 1993;114(3):552–66. doi: 10.1037/0033-2909.114.3.552. [DOI] [PubMed] [Google Scholar]
- Rodriguez HP, von Glahn T, Grembowski DE, Rogers WH, Safran DG. “Physician Effects on Racial and Ethnic Disparities in Patients’ Experiences of Primary Care.”. Journal of General Internal Medicine. 2008;23(10):1666–72. doi: 10.1007/s11606-008-0732-8. [DOI] [PMC free article] [PubMed] [Google Scholar]
- Rodriguez HP, von Glahn T, Elliott MN, Rogers WH, Safran DG. “The Effect of Performance-Based Financial Incentives on Improving Patient Care Experiences: A Statewide Evaluation.”. Journal of General Internal Medicine. 2009a;24(12):1281–8. doi: 10.1007/s11606-009-1122-6. [DOI] [PMC free article] [PubMed] [Google Scholar]
- Rodriguez HP, von Glahn T, Li A, Rogers WH, Safran DG. “The Effect of Item Screeners on the Quality of Patient Survey Data: A Randomized Experiment of Ambulatory Care Experience Measures”. The Patient: Patient-Centered Outcomes Research. 2009b;2(2):135–41. doi: 10.2165/01312067-200902020-00009. [DOI] [PubMed] [Google Scholar]
- Rodriguez HP, Von Glahn T, Rogers WH, Safran DG. “Organizational and Market Influences on Physician Performance on Patient Experience Measures.”. Health Services Research. 2009c;44(3):880–901. doi: 10.1111/j.1475-6773.2009.00960.x. [DOI] [PMC free article] [PubMed] [Google Scholar]
- Safran DG. “Defining the Future of Primary Care: What Can We Learn from Patients?”. Annals of Internal Medicine. 2003;138(3):248–55. doi: 10.7326/0003-4819-138-3-200302040-00033. [DOI] [PubMed] [Google Scholar]
- Safran DG, Karp M, Coltin K, Chang H, Li A, Ogren J, Rogers WH. “Measuring Patients’ Experiences with Individual Primary Care Physicians. Results of a Statewide Demonstration Project.”. Journal of General Internal Medicine. 2006;21(1):13–21. doi: 10.1111/j.1525-1497.2005.00311.x. [DOI] [PMC free article] [PubMed] [Google Scholar]
- Saha S, Hickam DH. “Explaining Low Ratings of Patient Satisfaction among Asian-Americans.”. American Journal of Medical Quality. 2003;18(6):256–64. doi: 10.1177/106286060301800606. [DOI] [PubMed] [Google Scholar]
- Samejima F. Richmond, VA: Psychometric Society; 1969. Estimation of Latent Ability Using a Response Pattern of Graded Scores (Psychometric Monograph No. 17) . [accessed on July 23, 2011]. Available at http://www.psychometrika.org/journal/online/MN17.pdf. [Google Scholar]
- Schnaier JA, Sweeny SF, Williams VS, Kosiak B, Lubalin JS, Hays RD, Harris-Kojetin LD. “Special Issues Addressed in the CAHPS Survey of Medicare Managed Care Beneficiaries. Consumer Assessment of Health Plans Study.”. Medical Care. 1999;37(3 Suppl):MS69–78. doi: 10.1097/00005650-199903001-00008. [DOI] [PubMed] [Google Scholar]
- Schnittker J, Liang K. “The Promise and Limits of Racial/Ethnic Concordance in Physician–Patient Interaction.”. Journal of Health Politics, Policy and Law. 2006;31(4):811–38. doi: 10.1215/03616878-2006-004. [DOI] [PubMed] [Google Scholar]
- Stewart AL, Napoles-Springer AM, Gregorich SE, Santoyo-Olsson J. “Interpersonal Processes of Care Survey: Patient-Reported Measures for Diverse Groups”. Health Services Research. 2007;42(3 Pt 1):1235–56. doi: 10.1111/j.1475-6773.2006.00637.x. [DOI] [PMC free article] [PubMed] [Google Scholar]
- Taira DA, Safran DG, Seto TB, Rogers WH, Inui TS, Montgomery J, Tarlov AR. “Do Patient Assessments of Primary Care Differ by Patient Ethnicity?”. Health Services Research. 2001;36(6 Pt 1):1059–71. [PMC free article] [PubMed] [Google Scholar]
- Weech-Maldonado R, Morales LS, Spritzer K, Elliott M, Hays RD. “Racial and Ethnic Differences in Parents’ Assessments of Pediatric Care in Medicaid Managed Care.”. Health Services Research. 2001;36(3):575–94. [PMC free article] [PubMed] [Google Scholar]
- Weech-Maldonado R, Morales LS, Elliott M, Spritzer K, Marshall G, Hays RD. “Race/Ethnicity, Language, and Patients’ Assessments of Care in Medicaid Managed Care”. Health Services Research. 2003;38(3):789–808. doi: 10.1111/1475-6773.00147. [DOI] [PMC free article] [PubMed] [Google Scholar]
- Weech-Maldonado R, Elliott MN, Morales LS, Spritzer K, Marshall GN, Hays RD. “Health Plan Effects on Patient Assessments of Medicaid Managed Care among Racial/Ethnic Minorities.”. Journal of General Internal Medicine. 2004;19(2):136–45. doi: 10.1111/j.1525-1497.2004.30235.x. [DOI] [PMC free article] [PubMed] [Google Scholar]
- Weech-Maldonado R, Elliott MN, Oluwole A, Schiller KC, Hays RD. “Survey Response Style and Differential Use of CAHPS Rating Scales by Hispanics.”. Medical Care. 2008;46(9):963–8. doi: 10.1097/MLR.0b013e3181791924. [DOI] [PMC free article] [PubMed] [Google Scholar]
- Wilkins V, Elliott MN, Richardson A, Lozano P, Mangione-Smith R. “The Association between Care Experiences and Parent Ratings of Care for Different Racial, Ethnic, and Language Groups in a Medicaid Population”. Health Services Research. 2011;46(3):821–39. doi: 10.1111/j.1475-6773.2010.01234.x. [DOI] [PMC free article] [PubMed] [Google Scholar]
- Zaslavsky AM. “Using Hierarchical Models to Attribute Sources of Variation in Consumer Assessments of Health Care.”. Statistics in Medicine. 2007;26(8):1885–900. doi: 10.1002/sim.2808. [DOI] [PubMed] [Google Scholar]
- Zaslavsky AM, Zaborski LB, Cleary PD. “Factors Affecting Response Rates to the Consumer Assessment of Health Plans Study Survey.”. Medical Care. 2002;40(6):485–99. doi: 10.1097/00005650-200206000-00006. [DOI] [PubMed] [Google Scholar]
- Zaslavsky AM, Zaborski LB, Ding L, Shaul JA, Cioffi MJ, Cleary PD. “Adjusting Performance Measures to Ensure Equitable Plan Comparisons.”. Health Care Financing Review. 2001;22(3):109–26. [PMC free article] [PubMed] [Google Scholar]
Associated Data
This section collects any data citations, data availability statements, or supplementary materials included in this article.