

Abstract
Objective
To examine the relationship between primary care physicians' (PCPs) payment arrangements and the total costs and intensity of care for specific episodes of care for Medicare beneficiaries.
Data Sources/Study Setting
We combined data from the 2004 to 2005 Community Tracking Study Physician Survey on PCP compensation methods with administrative data from the Medicare program for beneficiaries to whom these physicians provided services over the time period 2004–2006.
Study Design
Cross-sectional analysis of physician survey data linked to Medicare claims.
Principal Findings
The 2,211 PCP respondents included 937 internists and 1,274 family or general physicians who were linked to more than 250,000 Medicare enrollees. Most physicians (62 percent) had been in practice for 11 or more years and 87 percent were board certified. The total spending models show that for both employed physicians and owners, those in highly capitated practice environments had the lowest risk adjusted spending per beneficiary, whereas those receiving just productivity payments had the highest spending. These physicians also had lower intensity of care for episodes of care.
Conclusions
Physicians in highly capitated practices had the lowest total costs and intensity of care, suggesting that these physicians develop an overall approach to care that also applies to their FFS patients.
Keywords: Physician payment, financial incentives, Medicare, costs of care
The Patient Protection and Affordable Care Act (PPACA) of 2010 will increase access to health insurance for a large proportion of the population that is currently uninsured. Moreover, the PPACA also introduced important reforms to the individual and small group insurance markets that will assure better access to affordable coverage for these populations through a combination of insurance reform and individual and employer mandates that require most individuals to have health insurance.
While health reform takes important steps toward assuring equitable access to care, attention is already shifting toward addressing problems related to escalating costs and inadequate quality of care. The natural target of such strategies is physicians. Although direct spending for physicians' services accounts for just 21.2 percent of total health care spending, physicians' treatment and referral decisions determine the vast majority of health care spending (Center for Medicare and Medicaid Services 2008). The methods used to compensate physicians are among the relatively few policy tools available to influence physician decision making and a number of payment and delivery system reforms envisioned by health reform (e.g., episode-based payments, accountable care organizations) have the potential for changing compensation incentives.
Prior research demonstrates that physicians respond to financial incentives (Conrad and Christianson 2004; Shen et al. 2004; Conrad, Maynard, and Cheadle 2008; Jacobson et al. 2010; Shahinian, Kuo, and Gilbert 2010). Although there is a relatively strong literature documenting how physicians' practice arrangements have changed over the last two decades (e.g., more large group practices) and how financial arrangements are structured between physician practices and health plans, much less is known about how arrangements between payers and practices are translated into specific compensation arrangements for physicians, and how these arrangements, in turn, influence the delivery of care (Hillman 1987; Hillman, Pauly, and Kerstein 1989; Hillman, Welch, and Pauly 1992; Robinson and Casalino 1995; Robinson 2001; Rosenthal et al. 2001; Landon et al. 2005). Complicating this is the fact that typical physician practices have contracts with over a dozen private health plans (along with public payers), each of which might carry different terms and incentives. Without this basic knowledge, policies based on financial incentives might be ineffective or have unintended consequences.
We address these issues by analyzing data from a large, nationally representative survey of physicians, the Community Tracking Study (CTS) Physician Survey (Center for Studying Health System Change 2011). Previously, we created and validated a typology of physician payment based on a revised and expanded module on physician payment arrangements and incentives included in the 2004–2005 CTS survey (Landon et al. 2009). In this paper, we link these survey data with claims data from the Centers for Medicare and Medicaid Services for services delivered to Medicare beneficiaries treated by these physicians over a 3-year period (2004–2006) in order to examine the relationship between physician compensation arrangements and the costs and intensity of care delivered to Medicare beneficiaries.
Our analysis focused on two particular research questions: (1) What is the relationship between primary care physicians' (PCP) payment arrangements and the total costs of care for beneficiaries for whom they provided the plurality of primary care services? (2) How do payment arrangements influence the number of episodes and the intensity of care for treatment of episodes of care?
METHODS
We combined data from two main sources in order to investigate the relationship between a validated typology of physician-level compensation arrangements and the costs and intensity of care for Medicare patients they treated at least once.
Data on Physicians
The CTS Physician Survey, conducted by the Center for Studying Health System Change, is a periodic telephone survey of a nationally representative sample of nonfederal physicians who have completed residency training and spend at least 20 hours per week in direct patient care. The fourth CTS survey, conducted in 2004–2005, sampled physicians drawn from 60 local health care markets that together are nationally representative. The 2004–2005 survey had 6,628 respondents (weighted response rate of 52 percent). Details of the survey are available at http://www.hschange.org/index.cgi?data=04; many of the findings have been described previously (see http://www.hschange.org). Our study included 2,211 PCPs who treated Medicare patients during the 2004–2006 period. We defined PCPs as those with a primary specialty of family practice, general practice, or general internal medicine.
Data on Medicare Patients
We obtained data from the Medicare program on elderly, non-ESRD Medicare beneficiaries (age >65) who were enrolled in the traditional fee-for-service Medicare program and for whom surveyed physicians submitted at least one claim in 2004, 2005, or 2006. For each patient identified in this manner, we obtained a complete history of all claims submitted by all Medicare providers for the time period 2004–2006. A schematic detailing the patient sample is included as Appendix Figure SA1. Because claims data are not available for patients enrolled in a Medicare Advantage health plan, patients are only included for full-year periods when they were enrolled in traditional Medicare. CTS survey data and Medicare claims were linked by obtaining Medicare's Unique Physician Identifier Number (UPIN) from the American Medical Association for CTS respondents and matching it to the UPIN recorded on the Medicare claims.
Measuring Costs and Intensity of Care
We focused on two measures of spending: costs for specific clinical episodes of care and risk-adjusted total costs. In order to calculate costs that reflect differences in utilization rather than payment rates, we calculated standardized costs for all Part A and Part B services received during the study period. Standardized cost differs from actual Medicare payment in two important ways. First, standardized cost incorporates the full allowed reimbursement from all payment sources (Medicare, patient cost sharing, and other insurers). Second, standardized cost eliminates the effects of various adjustments Medicare makes in setting local payment rates, such as geographic payment differences for local input price variations and differential payments across classes of providers (e.g., DSH and GME payments; cost-based reimbursement of critical access hospitals versus DRG-based prospective payment for most other short-term hospitals). All costs were then adjusted to reflect CY 2006 reimbursement rates. Additional details on the methods used to create standardized costs are available in Appendix SA2.
Assigning Patients to PCPs
We first assigned beneficiaries to a PCP using an algorithm that matched the beneficiary to the PCP who provided the plurality of his/her evaluation and management (E&M) visits over the entire 2004–2006 period. The assignment was based on all of the episodes of care over the time period and assigns each beneficiary to the single PCP who had the most contact with the patient. Thus, if the plurality PCP was not included in our survey sample, that patient would not be included in the subsequent analyses of total costs.
Defining Episodes, Intensity of Care, and Number of Episodes
We calculated the intensity of care for specific episodes of care using Symmetry Episode Treatment Groups (ETG), version 6.0 (Ingenix, Eden Prairie, MN). We chose this commercial program because it is commonly used nationally. Each episode of care groups clinically related services (such as visits, laboratory tests, and hospitalizations) delivered to a patient with a specific condition over a defined period into one of about 600 different episode types, which reflect treatment for both chronic diseases and acute conditions. Start and end points for acute episodes are defined by minimum “clean” periods of time during which no claims associated with the diagnosis were recorded. Episodes for chronic conditions are defined as calendar years. Episodes with uncertain start or end periods due to the start or end of our observation period were omitted from the analysis.
To calculate the intensity of care of an episode, we multiplied the standardized cost for each service assigned to an episode by the number of times the service was delivered and summed the costs. We refer to this total as the observed cost. The observed cost of an episode varies with the number of units of service delivered. We adjusted the data to eliminate extreme values for each episode type by setting all charges below one-third of the 25th percentile to that value and above three times the 75th percentile to that value. This differs slightly from other methods used in the literature (Adams et al. 2010), which typically entail truncating at a given percentile, but establishes clinically reasonable cut points.
Episodes were attributed to the physician within each specialty who provided the most E&M services for the care of that episode. In cases where there was a tie, we used the total costs attributed to the physician as the tiebreaker. Thus, if a non-CTS PCP provided more services for a particular episode, that episode would not be attributed to one of the survey respondents. We required that each “attributed” physician bill a minimum of 15 percent of the total E&M costs for that episode. Consequently, multiple physicians of different specialties may be attributed to an episode of care. We limit our analysis, however, to episodes for which a PCP was included among the attributed physicians and we focus on their financial incentives. Sensitivity analyses requiring that the PCP provide at least 30 percent of total E&M costs had no substantive effect on our findings, so we present findings based on the 15 percent attribution rule. We limited our analysis to PCPs in order to identify a set of physicians playing a similar role for a relatively homogenous group of episodes and because the PCP has a large role in driving utilization decisions. A total of 901,135 episodes were assigned to one of the PCP respondents to the survey. For each episode, we also calculated the costs of physician services as an additional dependent variable because we felt these costs would be most affected by the incentive structures we measure.
The final dependent variable in the analysis is the number of distinct episodes of care received by the beneficiary. This allows us to examine the roles of cost per episode and episodes per beneficiary as elements of the total cost per beneficiary.
PCP Payment Methods
The 2004–2005 CTS physician survey included a new detailed module on physician payment methods. The survey first asks whether the physician is an owner or an employee, because owners' net incomes are based primarily on practice profits. It then asked if the physician was paid on the basis of a fixed salary or time worked (wage based), or some form of variable compensation (such as share of practice revenues). The survey also asked whether the physician received pay in the form of a bonus, withhold, or other performance-based incentive; and whether the amount of compensation was affected by any of the following explicit factors: individual productivity, practice financial performance, results of patient satisfaction surveys, measures of quality, and comparative practice profiling. The physician then indicated the importance (not very, moderately, or very) of each of these five factors to determining their compensation. Owners of solo practices were not asked about factors affecting their compensation, for they were assumed to be remunerated solely on productivity. Finally, to identify incentives from the external payment environment likely to influence internal compensation arrangements, the survey asked the percentage of practice revenue drawn from capitated contracts.
Because there are multiple combinations of answers to these questions and many are correlated, we constructed and validated a typology of payment arrangements using linear regression analysis to identify an exhaustive set of mutually exclusive combinations of incentives associated with providing increased services to patients (Landon et al. 2009). The typology was validated by comparison with a series of additional measures of physician behaviors (e.g., number of patients seen) that we thought would be responsive to financial incentives. These analyses resulted in an initial 11-category typology of compensation methods that was subsequently reduced to seven categories by collapsing categories that had similar effects in preliminary analyses. We excluded practice setting from our models because variables that define practice setting such as ownership status were either highly correlated with or were used in the typology.
Patient and Physician Control Variables
Patient control variables were derived from the Medicare denominator file and included age, race/ethnicity (categorized as white, black, or other), sex, and Medicaid eligibility, an indicator of low socioeconomic status. To control for health status predictive of spending, we used the Hierarchical Coexisting Conditions (HCC) risk-adjustment model (Pope et al. 2004). The HCC model, which was developed for use with the Medicare population, classifies ICD-9-CM codes into over 800 distinct diagnostic groups (DxGroups) on the basis of clinical similarity and resource use that are then grouped into 184 condition categories (CCs). The CCs are then ordered into HCCs. Individuals can be assigned to multiple conditions across the HCCs, but only one condition within an HCC group. We included the HCC score calculated from the prior year diagnoses as a control variable in the analysis of total cost per beneficiary. For the analysis of cost per episode, we included the average cost of care for that episode as a control variable, in essence adjusting for the expected costs of care for the particular episode.
Physician control variables derived from the CTS survey included primary care specialty (general internal medicine versus family and general practice), age, sex, race, years in practice (<5 years, 5–10 years, or more than 10 years), foreign medical graduate status, board certification, and the percentages of practice revenue from Medicare or Medicaid (categorized in terciles). Additional control variables in our models included dummy variables indicating CTS site, responses to a question about whether they were accepting new Medicare patients, and responses to three questions indicating their sensitivity to patient cost-sharing burdens when making treatment decisions.
Statistical Analysis
We first compared our sample of Medicare patients linked to CTS PCPs included in our study with the general Medicare population using t-test or chi-square tests as appropriate. Descriptive information is then presented on the PCPs included in the study.
We next estimated a series of linear regression models assessing the association between the physician payment arrangements and the total annual cost per beneficiary, total cost (intensity) per episode of care and physician costs per episode of care, and the number of annual episodes per beneficiary. Physician-related costs were defined from line items in the Part B file that identified a specific performing physician. We transformed the cost measures into logarithms to reduce the effects of outliers and also measured the annual number of episodes in logs for comparability. Measuring the dependent variables in logarithms enabled interpretation of the exponentials of the model coefficients as the percent difference in costs relative to that of the reference group, which also facilitates interpretability across models with different dependent variables.
In preliminary analyses we estimated a series of sequential linear regression models starting with the financial incentives typology variables, and then adding in subsequent steps the patient-level control variables and physician-level control variables. Finally, we elected to include fixed effects for the 60 CTS sites to control for any time invariant market effects. We present results from the full models that also controlled for patient and physician characteristics. Our study was approved by the Center for Medicare and Medicaid Services Privacy Board and by the Institutional Review Board at Harvard Medical School.
RESULTS
The 2,211 PCP respondents included 937 general internists who were linked to more than 123,000 Medicare patients whom they treated at least once between 2004 and 2006 and 1,274 family or general physicians linked to over 129,000 Medicare patients (Table 1). Most physicians (62 percent) had been in practice for 11 or more years and 87 percent were board certified. About one-third was in a solo or two-person practice and one-quarter were in hospital-based practices. Seventy percent derived at least 20 percent of practice revenue from Medicare.
Table 1.
Description of PCPs and Beneficiaries Linked to PCPs*
| PCP Respondents (Physicians) | Weighted by Beneficiaries Linked to PCPs | |||
|---|---|---|---|---|
| N | % | N | % | |
| Specialty | ||||
| General internal medicine | 937 | 42.38 | 123,284 | 48.82 |
| Family/general practice | 1,274 | 57.62 | 129,268 | 51.18 |
| Years in practice | ||||
| 0–5 | 336 | 15.20 | 20,506 | 8.12 |
| 6–10 | 497 | 22.48 | 50,922 | 20.16 |
| 11+ | 1,378 | 62.32 | 181,124 | 71.72 |
| Board certification | ||||
| Yes | 1,923 | 86.97 | 222,832 | 88.23 |
| No | 288 | 13.03 | 29,720 | 11.77 |
| Location of medical school | ||||
| U.S./Canadian | 1,685 | 76.21 | 204,577 | 81.00 |
| Elsewhere | 526 | 23.79 | 47,975 | 19.00 |
| Practice type | ||||
| Solo/2-person | 842 | 38.08 | 106,548 | 42.19 |
| Small group, 3–10 | 336 | 15.20 | 49,507 | 19.60 |
| Medium group, 11–50 | 176 | 7.96 | 23,094 | 9.14 |
| Large group, >50 | 94 | 4.25 | 11,486 | 4.55 |
| Medical school | 123 | 5.56 | 6,800 | 2.69 |
| Hospital practice/other | 554 | 25.06 | 50,777 | 20.11 |
| Group/staff HMO | 86 | 3.89 | 4,340 | 1.72 |
| Practice revenue derived from Medicaid (terciles) | ||||
| 0–5 | 958 | 43.33 | 126,975 | 50.28 |
| 6–20 | 803 | 36.32 | 97,238 | 38.50 |
| 21+ | 450 | 20.35 | 28,339 | 11.22 |
| Practice revenue derived from Medicare (terciles) | ||||
| 0–20 | 662 | 29.94 | 45,736 | 18.11 |
| 21–40 | 822 | 37.18 | 100,770 | 39.90 |
| 41+ | 727 | 32.88 | 106,046 | 41.99 |
| Practice revenue derived from managed care (terciles) | ||||
| 0–25 | 702 | 31.75 | 87,841 | 34.78 |
| 26–50 | 697 | 31.52 | 91,247 | 36.13 |
| 51+ | 812 | 36.73 | 73,464 | 29.09 |
| Practice revenue prepaid, capitated | ||||
| 0 | 959 | 43.37 | 127,820 | 50.61 |
| 1–34 | 840 | 37.99 | 94,508 | 37.42 |
| 35–100 | 412 | 18.63 | 30,224 | 11.97 |
Beneficiaries include those linked to PCPs as their usual primary care physician.
PCP, primary care physician.
Characteristics of Medicare beneficiaries linked to these physicians, either for specific episodes of care and/or as their principal provider, are presented in Table 2. Linked beneficiaries were slightly younger than the general Medicare population (45 percent ages 65–74 versus 38 percent, p<.01), but were otherwise similar with 61 percent being female and 90 percent white. Approximately 13 percent were dually eligible for Medicare and Medicaid.
Table 2.
Profiles of Linked Medicare Beneficiaries (%)
| Beneficiaries with at Least 1 Episode of Care (n = 300,652) | Beneficiaries Linked to PCPs (n = 252,552) | Medicare Population | |
|---|---|---|---|
| Age | |||
| 65–74 | 45.14** | 44.78** | 38.34 |
| 75–84 | 38.22** | 39.34** | 40.99 |
| 85+ | 16.64** | 15.88** | 19.74 |
| Gender | |||
| Female | 60.74** | 61.31** | 59.76 |
| Male | 39.26** | 38.69** | 40.24 |
| Race | |||
| White | 89.88** | 89.47** | 89.68 |
| Black | 7.31 | 7.65** | 7.40 |
| Other | 2.81** | 2.88 | 2.92 |
| Medicaid eligible | |||
| Yes | 12.72** | 12.53** | 14.57 |
| No | 87.28** | 87.47** | 85.43 |
| Census region | |||
| Northwest | 19.41** | 19.52** | 20.13 |
| Midwest | 24.29** | 24.18* | 23.96 |
| South | 41.38** | 41.24* | 41.01 |
| West | 14.93 | 15.06** | 14.82 |
Note. Significance compared with Medicare population.
p<.05;
p<.0005.
PCP, primary care physician.
Physician Payment Arrangements and Spending
Table 3 summarizes the groupings of physician payment arrangements and shows each group's principal payment influences. For instance, 277 physicians were paid via a fixed salary with no additional incentives. The largest group (672 physicians) consists of practice owners, primarily full owners of solo practices, who were compensated based on their personal productivity without additional internal payment arrangements. The next largest two groups both received payments based on productivity along with additional incentives (such as based on quality or satisfaction). Of these, 582 were owners or part owners of their practices and 424 were employees. The former commonly worked in small- or medium-sized groups, whereas the latter commonly practiced in medical school or hospital-based settings. The fourth and seventh typology groups of physicians only differed from these two groups in that they practiced in high-capitation settings (defined as more than 35 percent of practice revenue).
Table 3.
Major Components of the Physician Compensation Typology
| Typology Category | Abbreviation | N | Ownership | Productivity (versus Salary Pay) | Other Incentive | High Capitation |
|---|---|---|---|---|---|---|
| Employed physicians paid via fixed salary* | Employed | 277 | ||||
| Employed physicians paid based on productivity with no additional incentives | Employed productivity | 58 | √ | |||
| Employed physicians in a low capitation environment paid based on productivity with additional incentives | Employed productivity Other incentives | 424 | √ | √ | ||
| Employed physicians in a high capitation setting (>35% of revenue) paid based on productivity with additional incentives | Employed productivity Other incentives High capitation | 96 | √ | √ | √ | |
| Practice owners including full owners of solo practices. These practices have no additional internal payment arrangements | Owner productivity | 672 | √ | √ | ||
| Owners (part or full) practicing in a low capitation environment with any other combination of incentives | Owner productivity Other incentives | 582 | √ | √ | √ | |
| Practice owners in a high capitation setting (>35% of revenue) who also receive incentive payments | Owner productivity Other incentives High capitation | 102 | √ | √ | √ | √ |
This group serves as the reference group in all analytic models that follow.
Adjusted Spending Based on the Typology of Financial Incentives
Figure 1 shows the percentage differences in total risk-adjusted annual patient-level spending for each compensation arrangement relative to physicians paid by a fixed salary. These estimates are derived from regression models that control for individual patient characteristics as well as individual physician characteristics and site fixed effects. The total spending models show that relative to physicians compensated by a fixed salary, employee physicians and owners in highly capitated environments had the lowest risk adjusted spending per beneficiary, with employee physicians in high-capitation settings actually generating the lowest cost per beneficiary. Beneficiaries assigned to employee and owner physicians compensated by productivity only or productivity plus other incentives all had significantly higher annual costs than beneficiaries treated by employee physicians compensated by fixed salary. Employees with productivity incentives only had patients whose costs were nearly 11 percent higher than those of physicians with fixed compensation (p<.001).
Figure 1.
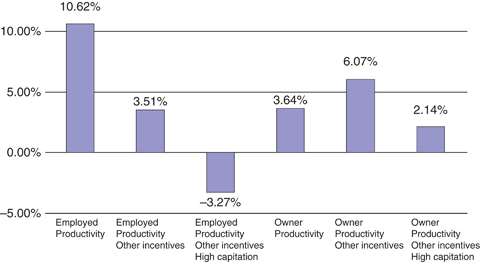
Percentage Difference in Total Standardized Cost According to Primary Care Physician Payment Arrangement
Figure 2A and B deconstruct total spending per beneficiary into spending (total and physician) per episode of care and number of episodes per patient. Each bar, based on regression coefficients, represents the percentage increase (or decrease) in episode spending when compared with employed physicians paid via fixed salary. Looking first at physician cost per episode (Figure 2A, darker bars), employed physicians paid exclusively via productivity and those paid by productivity in combination with other incentives had spending per episode that was approximately 10 percent higher than salaried physicians (11.56 and 9.23 percent, respectively, both p<.005). When practicing in a highly capitated environment, however, employed physicians spent 3.86 percent less than salaried physicians (p<.005). Spending by practice owners was consistently greater than that of salaried employees. Physician spending by owners facing productivity incentives alone or in combination with other incentives had spending 13.92 and 14.98 percent higher, respectively (p<.005), while owners of practices with large amounts of capitated revenue exhibited physician spending only half as large relative to salaried employees (6.90 percent, p<.005).
Figure 2.
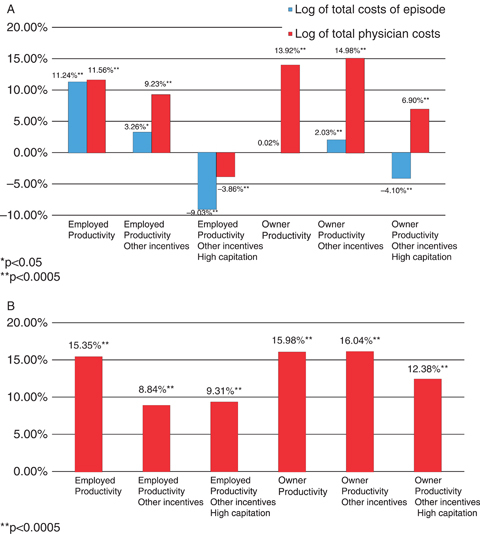
(A) Percentage Difference in Episode Spending Relative to Employed Physicians Paid Fixed Salary, According to Primary Care Physician (PCP) Payment Arrangement. (B) Percentage Difference in the Number of Episodes per Beneficiary Relative to Employed Physicians Paid via Fixed Salary, According to PCP Payment Arrangement
The effect of compensation method on total spending per episode (lighter bars) showed that, relative to salaried employees, the percentage effect of compensation method on total spending was considerably lower than the effect on physician spending for each group, except employees with productivity incentives only for whom there was little difference. This suggests compensation methods affect the mix of services provided. Employed physicians paid via productivity with other incentives had spending per episode that was higher than salaried physicians (3.26 percent, p<.05). When practicing in a highly capitated environment with otherwise similar incentives, however, employed physicians spent 9.03 percent less than salaried physicians. Total spending by owners paid via productivity or productivity with other incentives tended to be more similar to spending by salaried physicians (0.02 percent higher for owners paid via productivity [p=NS] and 2.03 percent higher for those paid via productivity with other incentives [p<.005]). Physician owners practicing in high-capitation environments had spending that was 4.1 percent lower than salaried physicians. Thus, physicians practicing in a highly capitated environment, whether employed or owners, had lower total spending than employee physicians with fixed salary compensation, and lower spending on physician services when compared with physicians with similar payment arrangements in practices with low capitation.
Salaried physicians with fixed compensation generated fewer episodes of care per primary care patient than did other physicians (Figure 2B). The largest numbers of episodes were generated by employee physicians with productivity-only incentives and owner physicians in low-capitation practices. Among employee physicians, high capitation did not have an additional effect on the number of episodes relative to the presence of other (nonproductivity incentives). Among owner physicians, however, the presence of other incentives did not appear to influence the total number of episodes per beneficiary, although owner physicians in high-capitation practices generated fewer episodes per beneficiary than other owners.
DISCUSSION
In this study, we used detailed questions on physician compensation strategies to investigate the relationship between PCP payment strategies and the costs and intensity of care using a large nationally representative sample of PCPs. Our study has several notable findings. First, financial incentives experienced by PCPs have a measurable impact on the costs of care, with most productivity-based payment systems leading to higher total costs and intensity of care. Second, physicians practicing in highly capitated environments had significantly lower costs comparable to the annual cost for beneficiaries treated by physicians compensated by fixed salary. The effect of practicing in a high-capitation environment appears to be a strong counter weight to other incentives (such as productivity-based incentives) to provide additional services. This finding is also consistent with a significant spillover effect as the Medicare patients we studied were all reimbursed using FFS payments. Third, there appears to be a clear distinction between employee physicians and owners. Even when their compensation methods are similar to those of employee physicians, owners appear to be substituting their own services for other nonphysician services that might drive up costs.
We studied patients enrolled in the traditional Medicare program wherein physician services are reimbursed through standard fee-for-service payments. Despite the fact that all PCPs face similar reimbursement incentives under traditional Medicare, we found that physicians in highly capitated practices had practice styles that were more cost efficient. In fact, physicians in high-capitation practices even had lower total costs per episode than employee physicians paid by a fixed salary.
These findings could have several explanations. First, they lend empirical support to the supply-side version of the “norms” hypothesis, which argues that physicians develop a single practice style that best incorporates the myriad incentives they experience from multiple payers and do not adjust their practice according to how they are paid for individual patients (Newhouse and Marquis 1978). Similarly, practices likely develop compensation strategies to reflect their mix of payers and incentives that they face. Those in capitated practices had similar payment strategies at the level of the individual physician, suggesting that these practices also adopt additional management strategies to influence the culture of practices to favor a more cost-conscious approach. Although we could not measure such aspects of practice, the culture of the practice is thus likely an important influence. Second, it is also possible that practices in more cost-conscious settings select physicians with similar conservative approaches to join the practice, or in general that physicians select practices where internal incentives are consistent with their preferences and practice styles. Finally, capitated practices might be located in parts of the country that, in general, use fewer resources. This latter finding, however, is unlikely as we controlled for local market in all of our models.
Our findings related to the impact of practice ownership are also notable. In general, owners (whether part of full) had consistently higher spending per episode for physician costs (mostly their own), but lower spending on nonphysician costs. These results suggest that owners will substitute increased services of their own for other nonphysician costs such as lab testing or X-rays. When examining total costs, patients cared for by PCP owners had across the board higher costs, even in highly capitated practices, than employee physicians with similar compensation arrangements.
Our results should be considered in light of several limitations. First, although using an episodes of care framework increased the clinical interpretability of results, the episode grouper was designed for use with a commercial population, rather than the Medicare population. Second, because we lack data on outcomes, individual physician profiles created using ETGs do not accurately classify physicians as being more or less efficient (Adams et al. 2010). However, because we examine results for populations of physicians, this issue is of less concern. In addition, we find consistent results for risk-adjusted total costs. Third, although this is the largest nationally representative survey of PCPs that we are aware of, the response rate was just over 50 percent, which might result in nonresponse bias. Fourth, we were not able to characterize the incentive structures to the level of detail we would have liked, particularly related to the structure of capitation payments and the practice-level incentives. The use of closed-end responses and the need to keep the survey instrument a reasonable length precluded the use of additional questions. Nonetheless, our results provide the most detailed description of financial arrangements from a large survey of this type. Fifth, patients are not randomly assigned to practices and might choose practices that conform to their taste for medical care. Similarly, physicians might select into practices that deliver care in conformance with their approach to care. Thus, our findings might reflect unmeasured attributes of either the patient or physician populations that are associated with practice payment arrangements. Thus, we can only infer associations and not causal relationships. Finally, our analysis is limited to the relationship between financial incentives and the intensity and costs of care delivered to individual patients. Clearly, such incentives can also act through other means, such as increasing throughput and the number of patients seen, that would not be evident in our analyses.
The landscape of physician practice ownership appears to be evolving. There has been an increasing trend toward hospitals purchasing physician practices over the last several years, and virtually all new physicians become employees because of the capital required to open a practice (Liebhaber and Grossman 2007). Thus, more physicians are becoming employed, and even though most physicians in hospital-purchased practices have productivity incentives, our results suggest there may be beneficial cost impacts.
Our results yield important information for policy makers. Under health reform, it is likely that there will be significant changes to physician payment systems. The PPACA funds a Medicare Innovations Center at the level of over U.S.$1 billion per year, and it is expected that initial innovations to be tested will involve new payment models, particularly for PCPs. Whether this involves bundled payments for specific types of episodes of care, or full risk capitation, our results suggest that there is the potential for substantial savings for episodes of care as a greater portion of services are paid through some sort of prospective mechanism. Our results confirm that capitated payment systems reduce the intensity of care delivered to patients, even when considered within the context of Medicare's traditional fee-for-service reimbursement. Moreover, as accountable care organizations develop and evolve, increasing proportions of payments could come in the form of capitation, and it is likely that such incentives directly related to the care of Medicare patients will be replicated in commercial markets, resulting in even more cost savings to the system. Currently, the largest health plan in Massachusetts is entering into capitated arrangements with large physician organizations throughout that state, and the state government is considering legislation to mandate bundled payment systems (Chernew et al. 2010, unpublished data). These reforms might auger what may happen at the federal level.
In conclusion, in this large nationally representative study of the relationship between PCP financial incentives and costs of care for their Medicare patients, we find that methods of PCP compensation are related to Medicare costs, even though all of these Medicare patients are reimbursed through identical FFS mechanisms. Our findings suggest that payment reforms being considered for the Medicare program nationally may be an important component of federal policies to limit cost growth.
Acknowledgments
Joint Acknowledgment/Disclosure Statement: This work was supported by a grant from the National Institutes of Aging (1R01AG027312). We are indebted to Wilma Stahura for assistance with manuscript preparation, Rick McKellar for research assistance, Cynthia Saiontz-Martinez for expert statistical programming, and to Edward Bassin for input related to the use of Episode Treatment Groups software.
Conflict of interest: Dr. Pham is an employee of the Centers for Medicare and Medicaid Services. This article reflects work conducted before Dr. Pham joined the Centers for Medicare & Medicaid Services, and it does not reflect the policies or programs of CMS or the Department of Health and Human Services.
Disclosures: None.
Disclaimers: None.
SUPPORTING INFORMATION
Additional supporting information may be found in the online version of this article:
Appendix SA1: Author Matrix.
Appendix SA2. Construction of Standardized Costs.
Please note: Wiley-Blackwell is not responsible for the content or functionality of any supporting materials supplied by the authors. Any queries (other than missing material) should be directed to the corresponding author for the article.
REFERENCES
- Adams JL, Mehrotra A, Thomas JW, McGlynn EA. “Physician Cost Profiling-Reliability and Risk of Misclassification”. New England Journal of Medicine. 2010;362(11):1014–21. doi: 10.1056/NEJMsa0906323. [DOI] [PMC free article] [PubMed] [Google Scholar]
- Center for Medicare and Medicaid Services. 2008. “National Health Expenditure Accounts for 2008” [accessed on December 16, 2008]. Available at https://www.cms.gov/nationalhealthexpenddata/02_nationalhealthaccountshistorical.asp.
- Center for Studying Health System Change. 2011. “Community Tracking Study (CTS) Physician Survey” [accessed on January 31, 2011]. Available at http://www.hschange.org/index.cgi?data=04.
- Conrad DA, Christianson JB. ““Penetrating the “Black Box”: Financial Incentives for Enhancing the Quality of Physician Services”. Medical Care Research and Review. 2004;61(3):37s–68s. doi: 10.1177/1077558704266770. [DOI] [PubMed] [Google Scholar]
- Conrad DA, Maynard C, Cheadle A. “Primary Care Physician Compensation Method in Medical Groups: Does It Influence the Use and Cost of Health Services for Enrollees in Managed Care Organizations?”. Journal of the American Medical Association. 2008;279(11):853–58. doi: 10.1001/jama.279.11.853. [DOI] [PubMed] [Google Scholar]
- Hillman AL. “Financial Incentives for Physicians in HMOs. Is There a Conflict of Interest?”. New England Journal of Medicine. 1987;317(27):1743–8. doi: 10.1056/NEJM198712313172725. [DOI] [PubMed] [Google Scholar]
- Hillman AL, Pauly MV, Kerstein JJ. “How Do Financial Incentives Affect Physicians' Clinical Decisions and the Financial Performance of Health Maintenance Organizations”. New England Journal of Medicine. 1989;321(2):86–92. doi: 10.1056/NEJM198907133210205. [DOI] [PubMed] [Google Scholar]
- Hillman AL, Welch WP, Pauly MV. “Contractual Arrangements between HMOs and Primary Care Physicians: Three-Tiered HMOs and Risk Pools”. Medical Care. 1992;30(2):136–48. doi: 10.1097/00005650-199202000-00005. [DOI] [PubMed] [Google Scholar]
- Jacobson M, Earle CC, Price M, Newhouse JP. “How Medicare's Payment Cuts for Cancer Chemotherapy Drugs Changed Patterns of Treatment”. Health Affairs. 2010;29(7):1391–99. doi: 10.1377/hlthaff.2009.0563. [DOI] [PubMed] [Google Scholar]
- Landon BE, Normand S-L, Frank RG, O'Neil BJ. “Characteristics of Medical Practices in Three Developed Managed Care Markets”. Health Services Research. 2005;40(3):675–95. doi: 10.1111/j.1475-6773.2005.00380.x. [DOI] [PMC free article] [PubMed] [Google Scholar]
- Landon BE, Reschovky JD, Pham HH, Kitsantas P, Wojtuskiak J, Hadley J. “Creating a Parsimonious Typology of Physician Financial Incentives”. Health Services and Outcomes Research Methodology. 2009;9(1):219–33. doi: 10.1007/s10742-010-0057-z. [DOI] [PMC free article] [PubMed] [Google Scholar]
- Liebhaber A, Grossman JM. 2007. “Physicians Moving to Mid-Sized, Single-Specialty Practices” [accessed on December 17, 2007]. Available at http://www.hschange.com/CONTENT/941/ [PubMed]
- Newhouse JP, Marquis MS. “The Norms Hypothesis and the Demand for Medical Care”. Journal of Human Resources. 1978;13(suppl):159–82. [PubMed] [Google Scholar]
- Pope GC, Kautter J, Ellis RP, Ash AS, Ayanian JZ, Iezzoni LI, Ingber MJ, Levy JM, Robst J. 2004. “Health Care Financing Review: Risk Adjustment of Medicare Capitation Payments Using the CMS-HCC Mode” [accessed on December 17, 2004]. Available at http://cms.gov/HealthCareFinancingReview/downloads/04Summerpg119.pdf. [PMC free article] [PubMed]
- Robinson JC. “Physician Organization in California: Crisis and Opportunity”. Health Affairs (Millwood) 2001;20(4):81–96. doi: 10.1377/hlthaff.20.4.81. [DOI] [PubMed] [Google Scholar]
- Robinson JC, Casalino LP. “The Growth of Medical Groups Paid through Capitation in CALIFORNIA”. New England Journal of Medicine. 1995;333(25):1684–7. doi: 10.1056/NEJM199512213332506. [DOI] [PubMed] [Google Scholar]
- Rosenthal MB, Frank RG, Buchanan JL, Epstein AM. “Scale and Structure of Capitated Physician Organizations in California”. Health Affairs (Millwood) 2001;20(4):109–19. doi: 10.1377/hlthaff.20.4.109. [DOI] [PubMed] [Google Scholar]
- Shahinian VB, Kuo Y-F, Gilbert SM. “Reimbursement Policy and Androgen-Deprivation Therapy for Prostate Cancer”. New England Journal of Medicine. 2010;362(19):1822–32. doi: 10.1056/NEJMsa0910784. [DOI] [PubMed] [Google Scholar]
- Shen J, Andersen R, Brook R, Kominski G, Albert PS, Wenger N. “The Effects of Payment Method on Clinical Decision-Making: Physician Responses to Clinical Scenarios”. Medical Care. 2004;42(3):293–302. doi: 10.1097/01.mlr.0000114918.50088.1c. [DOI] [PubMed] [Google Scholar]
Associated Data
This section collects any data citations, data availability statements, or supplementary materials included in this article.