

Abstract
Introduction
Hospital standardized mortality ratios (HSMRs) are derived from administrative databases and cover 80 percent of in-hospital deaths with adjustment for available case mix variables. They have been criticized for being sensitive to issues such as clinical coding but on the basis of limited quantitative evidence.
Methods
In a set of sensitivity analyses, we compared regular HSMRs with HSMRs resulting from a variety of changes, such as a patient-based measure, not adjusting for comorbidity, not adjusting for palliative care, excluding unplanned zero-day stays ending in live discharge, and using more or fewer diagnoses.
Results
Overall, regular and variant HSMRs were highly correlated (ρ > 0.8), but differences of up to 10 points were common. Two hospitals were particularly affected when palliative care was excluded from the risk models. Excluding unplanned stays ending in same-day live discharge had the least impact despite their high frequency. The largest impacts were seen when capturing postdischarge deaths and using just five high-mortality diagnosis groups.
Conclusions
HSMRs in most hospitals changed by only small amounts from the various adjustment methods tried here, though small-to-medium changes were not uncommon. However, the position relative to funnel plot control limits could move in a significant minority even with modest changes in the HSMR.
Keywords: Administrative data, mortality, hospitals, quality of care
Mortality is a commonly used outcome measure that has been shown to correlate with quality of care in a number of studies (Pitches, Mohammed, and Lilford 2007). The U.K. government's 2010 White Paper makes clear its “relentless focus” on outcomes, such as death rates (Department of Health 2010). Hospital standardized mortality ratios (HSMRs) are an overall measure of in-hospital death and are in use in a growing number of countries, of which some such as England and Canada make the figures public. In the version by Jarman et al. (1999) they are derived from administrative data commonly used for billing and cover the diagnosis groups that comprise 80 percent of the deaths in hospital (which covers around 30 percent of admissions in England). An HSMR is the ratio of the observed to expected deaths, multiplied by 100. The expected deaths are derived from logistic regression models that include available case mix variables. In the United States, HSMRs have been calculated since 2002 using a similar methodology to that described above from 1998 to 2008, at the Institute for Healthcare Improvement (IHI) using Centers for Medicare and Medicaid Services data for Medicare-only cases and Agency for Healthcare Research and Quality all-payer data (which covers a 20 percent sample of U.S. hospitals). The Medicare HSMRs are made available to any U.S. hospitals that write to IHI requesting them. In addition, since 2005, monthly HSMRs have been calculated for about 200 U.S. hospitals that upload their data each month, the results being made available online. IHI set up the Move Your Dot™ program, an effort to help hospitals know more about and improve their organizational performance in terms of mortality (Move Your Dot™ 2003). The Canadian Institute for Health Information have released its figures each year since 2008 and Holland is preparing to do so in 2011. In England, HSMRs are made available online together with their funnel plot band that uses 99.8 percent control limits, but some hospitals also use the HSMR values themselves to track changes over time. As with any indicator, particularly one reported publically, it is important to know its properties and how sensitive it is to changes in its construction.
The case mix adjustment used with HSMRs has been criticized (Black 2010; Lilford and Pronovost 2010; Mohammed et al. 2009) because for some variables it depends on the accuracy of clinical coding, in particular secondary diagnoses for comorbidity and palliative care. Some potentially valid theoretical concerns have been raised, particularly but not exclusively regarding case mix adjustment, but to date little robust quantitative evidence has been presented as to the size of their effect (Nicholl 2007). We discuss methodological issues concerning the measure's construction in detail elsewhere (Bottle, Jarman, and Aylin 2011), but the main criticisms are as follows:
Much hospital activity is excluded and so alternative formulation of the HSMR could lead to alternative conclusions about a hospital's mortality (Shahian et al. 2010).
Many unpreventable deaths are included such as palliative care patients, which are not reliably flagged in administrative data partly due to inadequate coding guidelines.
An increasing number of short-stay observation patients are being included, inflating the denominator.
Likewise, multiple admissions per patient can inflate the denominator.
Comorbidity adjustment depends on coding of secondary diagnoses, which could introduce bias due to variable recording between hospitals.
Failure to capture posttransfer or postdischarge deaths may introduce bias due to differing discharge policies and intermediate care provision.
The Department of Health in England is undertaking a review of HSMRs on behalf of the National Quality Board (the joint statement is available at http://www.dh.gov.uk/en/Publicationsandstatistics/Publications/PublicationsPolicyAndGuidance/DH_113024) and is considering these problems in its attempt to recommend a hospital mortality measure for the NHS. In this study, after briefly describing and presenting the statistical performance of the regular model, we demonstrate the impact of the key coding and other issues listed above on HSMRs using a set of sensitivity analyses on national English administrative data.
METHODS
“Regular” HSMR Model
In England, HSMRs are derived from the national administrative dataset covering all NHS (public) hospitals, hospital episode statistics (HES). The expected deaths in an HSMR are the sum of the individual patients' predicted risks derived from a set of logistic regression models, one model for each of the 56 component diagnosis groups (ICD10 codes were grouped using the Agency for Healthcare Research and Quality's Clinical Classification System [CCS]—follow the links on http://www.ahrq.gov/qual). The HSMRs are calculated as part of a monitoring system based on individual diagnoses and procedures described elsewhere (Bottle and Aylin 2008). In-hospital death at any time is used as the outcome measure. In this paper we built the models using 4 years of admissions (discharges in the financial years 2005/2006–2008/2009), excluding records with missing data (for age, sex, or length of stay) or admissions with other primary diagnoses. For each diagnosis group, all the candidate variables were retained, even if not statistically significant, as the goal was confounder control. The variables were age, sex, diagnosis subgroup, financial year, month of admission, method of admission (planned or unplanned), Charlson index of comorbidity (Sundararajan et al. 2004), palliative care flag, number of unplanned admissions in previous year (0, 1, 2, 3+), source of admission (where the patient was admitted from), ethnic group, and population-weighted area-level Carstairs deprivation quintile (Carstairs and Morris 1989). The Charlson index was fitted as a continuous variable, with all others fitted as categorical variables (the age groups were under 1, 1–4, 5–9, and in 5-year bands up to 90+). It was sometimes necessary to omit the source of admission from the model to achieve convergence. For simplicity, no adjustment was made for the clustering of patients within hospitals and only the main effects for the variables were fitted. We will refer to this set of 56 models as the “regular model” and to the resulting HSMRs as “regular HSMRs.” For each of the 56 groups, we calculated the discrimination of the model using the c statistic (ability of the model to give a higher probability of death to admissions ending in death than to admissions ending in live discharge) and proportion of variation for which the model accounted (using the McFadden adjusted r2). We also calculated the “adequacy” of each covariate (Harrell 2001). This describes the proportion of the total variation explained by the model for which each variable accounts, and thereby identifies which are the most important variables. Lastly, we calculated the overall discrimination for the 56 groups combined.
Sensitivity Analyses
To assess the magnitude of the effect of some of the key criticisms of HSMRs around clinical coding and denominator inflation, we fitted nine new series of logistic regression models using the same 4 years as above with some key differences from the regular model. For the first and second series, we sorted admissions during the 4 years by pseudonymized patient identifier (combination of date of birth, sex, and postcode: the HES identifier was not available for all years) and dates of admission and discharge. We then took (i) the patient's first and (ii) their last admission during the 4-year period and fitted models with the usual set of covariates. These are two options for producing a patient-based rather than the usual admission-based measure.
Originally, HSMRs did not include adjustment for palliative care, but we introduced it in 2004/2005 following requests from several hospitals who felt they were being unfairly penalized for having on-site palliative care facilities. Since then, palliative care recording in HES has doubled to 0.6 percent of all inpatients and 1.5 percent of HSMR admissions in 2008/2009; the proportion of all deaths flagged with palliative care codes rose from 3.0 to 9.1 percent in the same period, although in some hospitals it is much higher than this. In the third series of regression models, the only change from the regular method was that we did not adjust for palliative care.
In the fourth series of models, the only change from the regular method was that we did not include the Charlson comorbidity index as a covariate. This index covers 17 conditions such as diabetes, liver disease, and cancer and is derived from secondary diagnosis fields. HSMRs resulting from this series are therefore the same as the regular HSMRs but without comorbidity adjustment.
Fifth, we excluded unplanned admissions with zero length of stay (i.e., the patient was admitted and discharged on the same day) ending in live discharge. Their numbers have been rising steadily for several years and accounted for 15.4 percent of all inpatients in 2008/2009. It has been suggested that this is potentially denominator inflation that varies by hospital, as a sizeable proportion of these could be admissions to an observation or assessment unit rather than to the hospital proper, and could affect the HSMRs. Unlike datasets for some other countries, HES data do not flag periods spent on observation wards. A patient who leaves hospital on the same day as being admitted with a recorded diagnosis of AMI, for example, is unlikely to have had an AMI and tends to be excluded from such models (Krumholz et al. 2006).
Sixthly, we combined three of the above changes: no adjustment for Charlson or for palliative care and the exclusion of unplanned admissions with zero length of stay ending in live discharge.
Variations in the proportion of deaths occurring outside acute hospitals, particularly in community establishments such as care homes, have been shown to vary by region (Seagroatt and Goldacre 2004). We obtained death registrations linked to hospital admissions from the Office for National Statistics and derived a 30-day total mortality variable with the value 1 if the date of the death registration occurred <30 days after the admission date and 0 otherwise. Our seventh variant used the regular set of models with the only difference being the use of this 30-day total mortality outcome instead of in-hospital deaths.
Next, we derived HSMRs using all deaths (i.e., for all 259 CCS groups). As the numbers of deaths in a group were often very small for the groups not in the regular set of 56, we used indirect standardization for these groups by age group, sex, and method of admission, using the whole country as the standard.
Lastly, we tried a quite different formulation using just five diagnosis groups: acute myocardial infarction, stroke, fractured neck of femur, heart failure, and pneumonia. Several of these groups are acute events and for all of them mortality is recognized as a key indicator. These five are likely to be a more focused subset with a lower proportion of palliative or end-of-life care patients and might better represent preventable deaths. The five models for these HSMRs were taken from the set for the regular version.
For all series, we present HSMRs for patients discharged in the financial year 2008/2009 by summarizing the differences between regular and the nine sets of variant HSMRs in bands of <5, 5–9, and 10+ and in terms of change in funnel plot outlier status using 99.8 percent exact Poisson control limits, noting how many move from “average” (within the control limits) to “high” (above the upper control limit), for example.
RESULTS
During the 4-year period, there were 11,269,377 admissions for the 56 CCS groups making up the HSMR, including 851,671 in-hospital deaths (7.6 percent case fatality rate). There were 930,677 30-day total deaths (8.3 percent case fatality rate). The c statistic for the regular model as a whole for 2008/2009 was 0.87 (values above 0.8 are often considered to show good discrimination). Among the 56 CCS groups, discrimination varied from 0.66 (senility and organic mental disorders) to 0.95 (breast cancer) and the proportion of variation explained by the model (the r2) from 5.8 percent (senility and organic mental disorders) to 42.7 percent (breast cancer). The most important variable in terms of explaining the variation in patient-level mortality was most commonly age (35 out of 56 models) or method of admission (14 models, Table 1). In four models, Charlson was the most important and in just one this was palliative care. The second most important variable was typically Charlson (27 models) or age (10 models), with palliative care next at eight models.
Table 1.
List of CCS Groups Used in English HSMRs Together with their ROC c Statistic and r2 for In-Hospital Mortality Based on Admissions for 2005/2006 to 2008/2009 Combined
| CCS Group | Description | c Statistic | r2 | Most Important Covariate | Second Most Important Covariate |
|---|---|---|---|---|---|
| 2 | Septicemia (except in labor) | 0.79 | 0.19 | AGEGROUP | DXGRP |
| 12 | Cancer of oesophagus | 0.84 | 0.22 | EMERG | PALLIATIVE |
| 13 | Cancer of stomach | 0.84 | 0.23 | EMERG | AGEGROUP |
| 14 | Cancer of colon | 0.84 | 0.23 | EMERG | PALLIATIVE |
| 15 | Cancer of rectum and anus | 0.86 | 0.24 | EMERG | PALLIATIVE |
| 17 | Cancer of pancreas | 0.77 | 0.16 | EMERG | PALLIATIVE |
| 19 | Cancer of bronchus, lung | 0.77 | 0.16 | EMERG | PALLIATIVE |
| 24 | Cancer of breast | 0.95 | 0.41 | EMERG | PALLIATIVE |
| 27 | Cancer of ovary | 0.85 | 0.24 | EMERG | PALLIATIVE |
| 29 | Cancer of prostate | 0.88 | 0.28 | EMERG | CHARLSON |
| 32 | Cancer of bladder | 0.93 | 0.39 | EMERG | CHARLSON |
| 38 | Non-Hodgkin's lymphoma | 0.84 | 0.22 | EMERG | AGEGROUP |
| 39 | Leukaemias | 0.81 | 0.18 | AGEGROUP | CHARLSON |
| 42 | Secondary malignancies | 0.81 | 0.19 | EMERG | AGEGROUP |
| 43 | Malignant neoplasm without specification of site | 0.78 | 0.18 | AGEGROUP | EMERG |
| 55 | Fluid and electrolyte disorders | 0.80 | 0.16 | AGEGROUP | DXGRP |
| 59 | Deficiency and other anaemia | 0.79 | 0.13 | AGEGROUP | PALLIATIVE |
| 68 | Senility and organic mental disorders | 0.66 | 0.06 | PALLIATIVE | AGEGROUP |
| 100 | Acute myocardial infarction | 0.76 | 0.13 | AGEGROUP | CHARLSON |
| 101 | Coronary atherosclerosis and other heart disease | 0.86 | 0.22 | AGEGROUP | CHARLSON |
| 103 | Pulmonary heart disease | 0.78 | 0.14 | AGEGROUP | CHARLSON |
| 106 | Cardiac dysrhythmias | 0.86 | 0.19 | AGEGROUP | CHARLSON |
| 107 | Cardiac arrest and ventricular fibrillation | 0.70 | 0.10 | AGEGROUP | EMERG |
| 108 | Congestive heart failure, nonhypertensive | 0.68 | 0.07 | AGEGROUP | CHARLSON |
| 109 | Acute cerebrovascular disease | 0.73 | 0.11 | AGEGROUP | DXGRP |
| 114 | Peripheral and visceral atherosclerosis | 0.89 | 0.33 | EMERG | AGEGROUP |
| 115 | Aortic, peripheral, and visceral artery aneurysms | 0.85 | 0.28 | EMERG | DXGRP |
| 117 | Other circulatory disease | 0.80 | 0.16 | CHARLSON | AGEGROUP |
| 122 | Pneumonia (except that caused by tuberculosis or sexually transmitted disease) | 0.83 | 0.25 | AGEGROUP | DXGRP |
| 125 | Acute bronchitis | 0.85 | 0.22 | AGEGROUP | CHARLSON |
| 127 | Chronic obstructive pulmonary disease and bronchiectasis | 0.71 | 0.08 | AGEGROUP | CHARLSON |
| 129 | Aspiration pneumonitis, food/vomitus | 0.70 | 0.10 | AGEGROUP | CHARLSON |
| 130 | Pleurisy, pneumothorax, pulmonary collapse | 0.80 | 0.16 | AGEGROUP | CHARLSON |
| 131 | Respiratory failure, insufficiency, arrest (adult) | 0.73 | 0.12 | AGEGROUP | EMERG |
| 133 | Other lower respiratory disease | 0.82 | 0.18 | AGEGROUP | CHARLSON |
| 134 | Other upper respiratory disease | 0.88 | 0.21 | AGEGROUP | CHARLSON |
| 145 | Intestinal obstruction without hernia | 0.83 | 0.21 | AGEGROUP | CHARLSON |
| 148 | Peritonitis and intestinal abscess | 0.87 | 0.32 | AGEGROUP | CHARLSON |
| 149 | Biliary tract disease | 0.93 | 0.32 | AGEGROUP | CHARLSON |
| 150 | Liver disease, alcohol-related | 0.69 | 0.08 | CHARLSON | AGEGROUP |
| 151 | Other liver diseases | 0.81 | 0.18 | DXGRP | AGEGROUP |
| 153 | Gastrointestinal haemorrhage | 0.83 | 0.20 | AGEGROUP | CHARLSON |
| 154 | Noninfectious gastroenteritis | 0.87 | 0.23 | AGEGROUP | CHARLSON |
| 155 | Other gastrointestinal disorders | 0.89 | 0.28 | AGEGROUP | CHARLSON |
| 157 | Acute and unspecified renal failure | 0.73 | 0.12 | AGEGROUP | CHARLSON |
| 158 | Chronic renal failure | 0.85 | 0.20 | AGEGROUP | EMERG |
| 159 | Urinary tract infections | 0.80 | 0.16 | AGEGROUP | CHARLSON |
| 197 | Skin and subcutaneous tissue infections | 0.91 | 0.26 | AGEGROUP | CHARLSON |
| 199 | Chronic ulcer of skin | 0.79 | 0.16 | AGEGROUP | CHARLSON |
| 224 | Other perinatal conditions | 0.78 | 0.13 | DXGRP | SORC |
| 226 | Fracture of neck of femur (hip) | 0.75 | 0.13 | CHARLSON | AGEGROUP |
| 231 | Other fractures | 0.82 | 0.17 | AGEGROUP | CHARLSON |
| 233 | Intracranial injury | 0.78 | 0.16 | AGEGROUP | DXGRP |
| 237 | Complication of device, implant or graft | 0.84 | 0.18 | CHARLSON | AGEGROUP |
| 245 | Syncope | 0.79 | 0.12 | AGEGROUP | CHARLSON |
| 251 | Abdominal pain | 0.94 | 0.31 | AGEGROUP | CHARLSON |
AGEGROUP, age group; CCS diagnosis subgroup; CHARLSON, Charlson comorbidity score; DXGRP, EMERG, method of admission (i.e., whether unplanned or not); PALLIATIVE, palliative care recorded; SORC, source of admission (e.g., own home, hospital transfer, care home).
Size of the Differences between Regular and Variant HSMRs
The variant chosen affected the number of admissions and deaths covered. Using the patient's last admission in the 4-year period used in the modelling inevitably resulted in a much larger number of deaths compared with using the first; the ratio of deaths using the last admission compared with the first ranged between hospitals from 1.6 to 2.8.
The exclusion of zero-day unplanned stays ending in live discharge led to the omission of 13.4 percent of admissions in the 56 CCS groups covered by the HSMR in 2008/2009 (this figure was 11.0 percent in 2005/2006). This ranged between hospitals from 7.5 to 29.4 percent. Using the five diagnosis groups covered 5.7 percent of admissions (range between hospitals 2.4 and 9.5) and 31.2 percent of deaths (range 18.4–44.2).
The correlation between the set excluding zero-day unplanned stays ending in live discharge and the regular HSMR was 0.99 and this modification had the least impact, followed by using 100 percent of admissions. For the other variants, changes of up to nine points were common (Table 2). Less often, larger changes were seen, particularly when using just five diagnosis groups. For example, one hospital was notably affected when using the last admission per patient. Two other trusts stand out as being particularly affected by the adjustment for palliative care, their HSMRs changing from around 90 to around 110. Both trusts had higher than average recording of palliative care (4.5 and 6.0 percent compared with 1.5 percent nationally) and their percentage of inpatients so flagged rose during the 4 years used in the regression. More important for the HSMR, these two trusts recorded around half of their deaths with palliative care in 2008/2009 HSMR admissions. The changes in HSMRs when no adjustment was made for Charlson were very similar to those without adjustment for palliative care, though the range was smaller (Figure 1).
Table 2.
Differences between “Regular” HSMRs and the Nine Variants
| Differences Compared with “Regular” HSMRs* | ||||
|---|---|---|---|---|
| Variant | Minimum and Maximum Difference | Number of Trusts (%) with Differences of 0–4.9 Points | Number of Trusts (%) with Differences of 5–9.9 Points | Number of Trusts (%) with Differences of 10+ Points |
| First admission per patient | −13, +10 | 121 (82) | 22 (15) | 4 (3) |
| Last admission per patient | −24, +9 | 117 (80) | 29 (20) | 1 (1) |
| No Charlson adjustment | −8, +10 | 124 (84) | 23 (16) | 0 (0) |
| No palliative care adjustment | −7, +19 | 117 (80) | 28 (19) | 2 (1) |
| Unplanned admissions of zero days' stay ending in live discharge excluded | −4, +5 | 147 (100) | 0 | 0 |
| The above three changes combined | −13, +21 | 95 (65) | 40 (27) | 12 (8) |
| 30-day total mortality | −15, +15 | 89 (61) | 46 (31) | 12 (8) |
| Using 100% of admissions | −6, +8 | 142 (97) | 5 (3) | 0 |
| Using just five diagnosis groups | −17, +18 | 89 (61) | 42 (29) | 16 (11) |
Differences are calculated as variant HSMR minus regular HSMR.
HSMR, hospital standardized mortality ratio.
Figure 1.
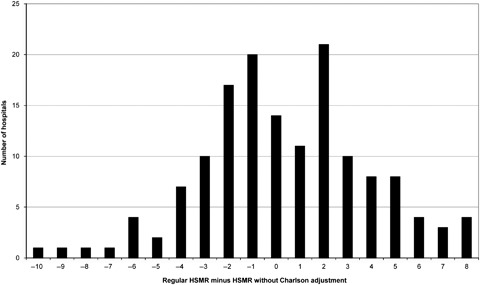
Differences in Hospital Standardized Mortality Ratios (HSMRs) for 2008/2009 for Acute Non-Specialist Trusts between the Regular Models and Those without Adjustment for Comorbidity (Expected Counts Were Derived from Models Using Data for 2005/2006 to 2008/2009)
The distribution of differences in HSMRs is fairly symmetrical between −4 and +4 (Figure 1) and exactly half of the 26 differences over five points are positive. The counts at +5, +7, and +8 in Figure 1 exceed their counterparts at −5, −7, and −8. Of the 14 hospitals whose HSMRs rose by five or more points when not adjusting for Charlson, four were flagged as high and all had HSMRs now of 100 or over (all but two had regular HSMRs of 100 or over). Of the nine hospitals whose HSMRs fell by five or more points, just four now had HSMRs of 100 or over (seven had regular HSMRs of 100 or over).
The correlation between the regular HSMRs and those based on all deaths within 30 days of admission was 0.84. Hospitals with more postdischarge deaths were affected more by this modification to the method; the correlation between the proportion of deaths within 30 days of admission that occurred after discharge and the difference in the two HSMRs was negative at −0.68 (p<.001). The HSMRs based on 30-day total mortality did not correlate at all with the proportion of deaths within 30 days of admission that occurred after discharge (ρ = 0.02, p=.77), whereas the regular HSMRs did show a modest correlation with this proportion (ρ=−0.36, p<.001).
Changes in Funnel Plot Outlier Status
Table 3 summarizes the proportion of hospitals flagged as high and as low with each method and also notes how often the outlier status changes. The proportions of flagged outliers was similar across the methods but was lower when using the first admission per patient and clearly lowest when using just five diagnosis groups. Using the last admission per patient resulted in the largest proportion being flagged as low outliers.
Table 3.
Agreement between the Regular HSMR and the Variants Regarding the Funnel Plot Bands Using 99.8% Control Limits
| Method | Number (%) of Trusts Flagged as High | Number (%) of Trusts Flagged as Low | Number (%) of Trusts in Different Band Compared with Regular HSMR Band | Number (%) of Trusts Flagged as Average with Regular but High with Variant | Number (%) of Trusts Flagged as High with Regular but Average with Variant |
|---|---|---|---|---|---|
| Regular | 31 (21%) | 24 (16%) | N/A | N/A | N/A |
| First admission per patient | 12 (8%) | 16 (11%) | 31 (21) | 1 (1%) | 20 (14%) |
| Last admission per patient | 19 (13%) | 35 (24%) | 29 (20) | 0 | 12 (8%) |
| No Charlson adjustment | 28 (19%) | 28 (19%) | 19 (13) | 5 (3%) | 8 (5%) |
| No palliative care adjustment | 26 (18%) | 29 (20%) | 22 (15) | 4 (3%) | 9 (6%) |
| Unplanned admissions of zero days' stay ending in live discharge excluded | 29 (20%) | 27 (18%) | 7 (5) | 1 (1%) | 3 (2%) |
| The above three changes combined | 22 (15%) | 25 (17%) | 29 (20) | 5 (3%) | 15 (10%) |
| 30-day total mortality | 31 (21%) | 27 (18%) | 39 (27) | 12 (8%) | 12 (8%) |
| Using 100% of admissions | 30 (20%) | 26 (18%) | 13 (9) | 4 (3%) | 5 (3%) |
| Using just five diagnosis groups | 13 (9%) | 8 (5%) | 40 (27) | 2 (1%) | 20 (14%) |
HSMR, hospital standardized mortality ratio.
Compared with the regular HSMRs, a small number of hospitals moved from “average” to “high”; this movement was greatest with 30-day total mortality, which saw 12 hospitals (8 percent) newly labeled “high.” It was more common for hospitals to change from “high” with the regular HSMRs to “average,” particularly when using the first admission per patient or using just five diagnosis groups. Excluding unplanned admissions of zero days' stay ending in live discharge had the smallest effect on outlier status.
All of our comparisons are between the variant and the regular HSMRs, but the difference in the proportion of hospitals flagged as outliers between using the first and using the last admission per patient was surprising and worth a comment here. Using the last admission per patient led to many more deaths being included and therefore reduced the width of the control limits. It was then possible for the HSMR to remain unchanged in value or even be slightly higher using the last admission per patient but yet move funnel plot banding. In just five out of the 21 hospitals flagged as low using the last admission but not low using the first was the difference in the two HSMRs >five points. The two distributions of HSMRs are comparable (Figure 2).
Figure 2.
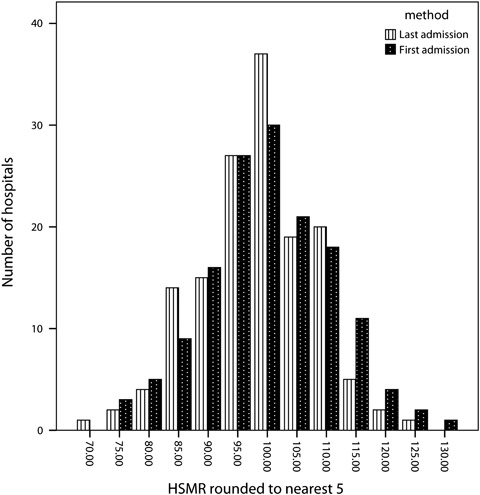
Hospital Standardized Mortality Ratios (HSMRs) for 2008/2009 for Acute Non-Specialist Trusts: Taking the First Admission per Patient versus Taking the Last Admission per Patient (Expected Counts Were Derived from Models Using Data for 2005/2006 to 2008/2009)
Across all the variants that we tried, in just one case was a change from low to high or from high to low observed (one hospital flagged as low with the regular version changed to high after making three changes to the model).
DISCUSSION
Summary of Findings
In this study, we have taken the current HSMR model and run a series of sensitivity analyses to determine how coding and some alternative formulations affect both the point estimate and its position in funnel plot bandings. The impact of the nine sets of changes was very variable. The inclusion of 100 percent of in-hospital deaths and the exclusion of unplanned zero-day live discharges each made relatively little difference. Correlations between the regular and the variant HSMRs were generally very high, but occasionally the choice of method had a large impact on the HSMR's point estimate. This was especially true for two hospital trusts when palliative care was not included in the model. However, using just five diagnosis groups for which mortality is a commonly used measure often led to large changes in the point estimate and a notable reduction in the number of both high and low outliers (i.e., much less overdispersion). Combining three of the changes and using total 30-day mortality also resulted in many 5–10 point and sometimes larger differences. Most of the variants tried here reduced the number of hospitals flagged as high, particularly the two using one admission per patient during the 4 years of data used in the modelling and HSMRs based on five diagnosis groups. We now consider our findings with respect to each of the criticisms of HSMRs listed in the introduction.
Relevance of Findings to Criticisms
Much hospital activity is excluded and so alternative formulation of the HSMR could lead to alternative conclusions about a hospital's mortality.
Including all admissions rather than just those accounting for 80 percent of deaths usually had modest impact on the HSMR values, though four hospitals were flagged as high with this variant that had been labelled as average using the regular version.
Many unpreventable deaths are included such as palliative care patients, which are not reliably flagged in administrative data partly due to inadequate coding guidelines.
Two hospitals were greatly affected when we did not adjust for palliative care and 22 hospitals in total had changes of 10 or more points in their HSMRs. The number of hospitals flagged as high fell by five. One explanation for this is that the coding of palliative care is unreliable and has introduced bias. Any use of the palliative care flag in a mortality indicator could be a potential opportunity for gaming, unless there were strictly controlled coding criteria and regular audits.
An increasing number of short-stay observation patients are being included, inflating the denominator.
These admissions are indeed common in England, though their exclusion made the least impact of all the modifications we tried. Nonetheless, there were occasionally large differences and one hospital labeled average with the regular version was now flagged as high.
Likewise, multiple admissions per patient can inflate the denominator.
Using either the first or the last admission per patient led to a reduction in the number of hospitals flagged as high; using the first, fewer hospitals were also flagged as low, but using the last, nearly one in four hospitals were labeled as low. The latter fact was not due to large changes, however, as Figure 1 shows, and seems to be partly due to narrower control limits when using the patient's last admission. There are other options for creating a patient-based HSMR, each with its own features (Bottle et al. 2011).
Comorbidity adjustment depends on the coding of secondary diagnoses, which could introduce bias due to variable recording between hospitals.
The Charlson index was often the second most important variable in the risk models after age or method of admission and not adjusting for it led to changes of between −8 and +10 in the HSMR. Five hospitals were now flagged as high instead of average and eight now flagged as average instead of high. The “real” level of comorbidity at a given hospital is unknown (but see Data quality issues), but one might hypothesize that if adjustment for comorbidity introduces bias then there would be some systematic change. While the distribution of differences in HSMRs with and without comorbidity adjustment as shown in Figure 1 was fairly symmetrical, rises of five points or more without adjustment were mostly seen in hospitals with regular HSMRs of 100 or over and not seen in any flagged as low. One interpretation of this is that this group of hospitals have different levels of coding from average, but equally it might also be true that they have genuinely higher levels of comorbidity among their patients than average and therefore the adjustment is warranted. It is not possible from these data to distinguish between these explanations. Our impression is that gaming of comorbidity via secondary diagnoses is not common in England.
Failure to capture posttransfer or postdischarge deaths may introduce bias due to differing discharge policies and intermediate care provision.
The HSMRs using 30-day total mortality captured postdischarge deaths, unlike the regular set, and frequently led to differences of between 5 and 15 points as well as changes in outlier status. The regular HSMRs were correlated with postdischarge deaths, but unsurprisingly those based on 30-day total deaths were not. This criticism seems justified for some hospitals even if the majority are little affected. The new NHS hospital mortality measure is likely to include out-of-hospital events, perhaps even until 28 days after discharge, to make the hospital “responsible” for the patient throughout this period. However, one cannot tell from the data whether the patient was discharged home to die due to their preference for place of death or was discharged prematurely and died as a (partial) consequence of care. A hospital may perhaps with some justification say that a death occurring out of hospital should not be attributed to them, as they have no further control over the care of that patient.
That a different formulation of a hospital mortality measure can lead to differences in the point estimate and sometimes also in the funnel plot bands is perhaps not surprising. In their recent comparison of four mortality “products” in the United States, Shahian et al. (2010) found that the four versions had just 22 percent of the patients in common and were only moderately correlated with each other. Sometimes, as we have seen in the present study, this resulted in different conclusions regarding a hospital's outlier status (though they used 95 percent confidence intervals instead of our 99.8 percent control limits). This led the Massachusetts Division of Health Care Finance and Policy to conclude that none of the four was suitable for public reporting of hospital mortality. However, the same group also surveyed the views of the hospital and invited them to undertake a case note audit (chart review) after receipt of their mortality reports. Results of this were not mentioned in the paper but are presented in their full report (Normand et al. 2010). This found that the majority of hospitals surveyed found one or two of the four vendors' standard reports to be a helpful screening tool, providing additional insights not revealed by current internal quality reviews. The reports of two of the vendors correctly identified situations in the majority of hospitals requiring further investigation for potential quality of care problems. This suggests to us that some formulations of the HSMR are more useful than others and that the challenge for the indicator developer is to maximize the signal-to-noise ratio.
Data Quality Issues
The case mix variables generally accounted for a modest proportion of the variation in the odds of death within a diagnosis group. Age and method of admission were usually the most important, with comorbidity as measured by the Charlson score commonly the second most important. For several cancers, palliative care was the second most important covariate. Both comorbidity and palliative care are derived from secondary diagnosis codes (the latter also from the specialty) and not adjusting for them was seen to result in small-to-moderate changes for most hospitals. It should be borne in mind that the “real” HSMR for any given trust—that calculated on using 100 percent accurate data—is of course unknown. HES data have long been criticized for data quality problems, and notable variations in recording still exist between trusts. The Audit Commission's Payment by Results data assurance framework audits, which assess the accuracy of primary and secondary diagnosis and procedure codes in a sample of records at every trust, showed a reduction in overall and inter-quartile range error rates from 2007/2008 to 2008/2009 (Audit Commission 2009), though some trusts have considerable problems in some areas. We found that some trusts flag a high proportion of their HSMR deaths as having palliative care, and the guidelines for coding palliative care have resulted in differing interpretations by coders. This led to the formulation of new Connecting for Health guidelines in March 2007. These allowed trusts to code any patient that had a noncurable illness and had advice from any member of a palliative care team to be coded as palliative care. The Canadian experience has shown the palliative care flag to be difficult to define and apply consistently (Downar, Sibbald, and Lazar 2010).
More promising is the set of new guidelines concerning comorbidity recording. Current guidance states that any comorbidity that affects the management of the patient and contributes to an accurate clinical picture within the current episode of care must be recorded, but others should not be. This has led to difficulties deciding the relevance of a given condition in a given admission. In the first stage of their review, the NHS Classifications Service working group produced a list of 61 comorbidities that, from April 2010, must always be recorded (NHS Classifications Service 2010a). Many of these are contained within the Charlson index, which should improve the models' performance.
The importance of the issues raised in this study will vary by country as, for example, the recent rise in short-stay unplanned admissions seen in England may have its roots in problems specific to the NHS. Although no “gold standard” for overall in-hospital mortality exists, analyses such as ours can increase our knowledge of how such indicators perform under different conditions. When a hospital claims that “our [typically high] HSMR would be much lower if you took out the palliative care patients in our on-site hospice,” for example (not an actual quote), the truth of the claim can be readily assessed.
CONCLUSIONS
Despite the theoretical concerns about bias raised by several groups including us, HSMRs in most hospital trusts were in practice usually only modestly affected by the differences in the predictive models that we tried here: high stayed high and low stayed low, though there could be plenty of movement in the middle. However, there were a few notable exceptions, particularly when not adjusting for palliative care, and even small changes could result in a change of outlier status. A hospital with a regular HSMR of 105, labeled as average, could easily see this drop to 100 or rise to 110 with a different formulation; a minority might see a difference of 10 or more points, particularly if considering just the five diagnosis groups that we combined here. Critics of HSMRs may seize on this as proof that the measure is unreliable and sometimes prone to bias. We believe that our results show some evidence of bias regarding palliative care recording and discharge policies and therefore HSMRs would be improved with better coding guidelines (and new ones were issued in June 2010 NHS Classifications Service 2010b) and timelier linkage with out-of-hospital deaths. The phenomenon of multiple admissions per patient did appear to increase the number of funnel plot outliers and a patient-based measure may be preferable, though it is not clear which admission should represent a given patient. In contrast, we did not find evidence of widespread bias regarding comorbidity recording, bias due to the omission of low-mortality admissions, or bias due to the inclusion of observation ward or medical assessment unit patients.
Extending the HSMR to cover all admissions made little difference, whereas using only five diagnoses had considerable impact and reduced the number of outliers and overdispersion, and would be worth considering as an alternative. Whatever the formulation of the HSMR, it is clear that the focus should not be on the point estimate, even though the NHS seems at last to be moving away from league tables. Alternatives included the use of banding, such as derived from funnel plots as used here or Bayesian ranking (Marshall and Spiegelhalter 1998), and the presentation of confidence intervals.
SUPPORTING INFORMATION
Additional supporting information may be found in the online version of this article:
Appendix SA1: Author Matrix.
Please note: Wiley-Blackwell is not responsible for the content or functionality of any supporting materials supplied by the authors. Any queries (other than missing material) should be directed to the corresponding author for the article.
REFERENCES
- Audit Commission. 2009. “PbR Data Assurance Framework 2008/09. Key Messages from Year 2 of the National Clinical Coding Audit Programme” [accessed August 31, 2010]. Available at http://www.audit-commission.gov.uk/SiteCollectionDocuments/AuditCommissionReports/NationalStudies/20090827pbrdataassuranceframework0809rep.pdf.
- Black N. “Assessing the Quality of Hospitals: Hospital Standardised Mortality Ratios Should be Abandoned”. British Medical Journal. 2010;340:933–4. [Google Scholar]
- Bottle A, Aylin P. “Intelligent Information: A National System for Monitoring Clinical Performance”. Health Services Research. 2008;43:10–31. doi: 10.1111/j.1475-6773.2007.00742.x. [DOI] [PMC free article] [PubMed] [Google Scholar]
- Bottle A, Jarman B, Aylin P. “Hospital Standardised Mortality Ratios: Strengths and Weaknesses”. British Medical Journal. 2011;342:c7116. doi: 10.1136/bmj.c7116. [DOI] [PubMed] [Google Scholar]
- Carstairs V, Morris R. “Deprivation: Explaining Differences in Mortality between Scotland and England and Wales”. British Medical Journal. 1989;299(6704):886–9. doi: 10.1136/bmj.299.6704.886. [DOI] [PMC free article] [PubMed] [Google Scholar]
- Department of Health. 2010. “Equity and Excellence: Liberating the NHS” [accessed August 31, 2010]. Available at http://www.dh.gov.uk/dr_consum_dh/groups/dh_digitalassets/@dh/@en/@ps/documents/digitalasset/dh_117794.pdf.
- Downar J, Sibbald R, Lazar NM. “Ethical Considerations for Classifying Patients as ‘Palliative’ When Calculating Hospital Standardised Mortality Ratios”. Journal of Medical Ethics. 2010;36(7):387–90. doi: 10.1136/jme.2010.035451. [DOI] [PubMed] [Google Scholar]
- Harrell F. Regression Modelling Strategies. New York: Springer; 2001. [Google Scholar]
- Jarman B, Gault S, Alves B, Hider A, Dolan S, Cook A, Hurwitz B, Iezzoni LI. “Explaining Differences in English Hospital Death Rates Using Routinely Collected Data”. British Medical Journal. 1999;318:1515–20. doi: 10.1136/bmj.318.7197.1515. [DOI] [PMC free article] [PubMed] [Google Scholar]
- Krumholz HM, Wang Y, Mattera JA, Wang Y, Han LF, Ingber MJ, Roman S, Normand S-LT. “An Administrative Claims Model Suitable for Profiling Hospital Performance Based on 30-Day Mortality Rates among Patients with an Acute Myocardial Infarction”. Circulation. 2006;113:1683–1692. doi: 10.1161/CIRCULATIONAHA.105.611186. [DOI] [PubMed] [Google Scholar]
- Lilford R, Pronovost P. “Using Hospital Mortality Rates to Judge Hospital Performance: A Bad Idea That Just Won't Go Away”. British Medical Journal. 2010;340:955–7. doi: 10.1136/bmj.c2016. [DOI] [PubMed] [Google Scholar]
- Marshall EC, Spiegelhalter DJ. “Reliability of League Tables of In Vitro Fertilisation Clinics: Retrospective Analysis of Live Birth Rates”. British Medical Journal. 1998;316:1701–5. doi: 10.1136/bmj.316.7146.1701. [DOI] [PMC free article] [PubMed] [Google Scholar]
- Mohammed MA, Deeks JJ, Girling A, Rudge G, Carmalt M, Stevens AJ, Lilford RJ. “Evidence of Methodological Bias in Hospital Standardised Mortality Ratios: Retrospective Database Study of English Hospitals”. British Medical Journal. 2009;338:b780. doi: 10.1136/bmj.b780. [DOI] [PMC free article] [PubMed] [Google Scholar]
- Move Your Dot ™. Measuring, Evaluating, and Reducing Hospital Mortality Rates (Part 1) 2003. IHI Innovation Series White Paper. Boston: Institute for Healthcare Improvement [accessed on June 28, 2011]. Available at http://www.IHI.org.
- NHS Classifications Service. 2010a. Coding of Comorbidities. Coding Clinic, Volume 6, Issue 6, March.
- NHS Classifications Service. 2010b. Palliative and End of Life Care. Coding Clinic, Volume 7, Issue 4, June.
- Nicholl J. “Case-Mix Adjustment in Non-Randomised Observational Evaluations: The Constant Risk Fallacy”. Journal of Epidemiology and Community Health. 2007;61:1010–3. doi: 10.1136/jech.2007.061747. [DOI] [PMC free article] [PubMed] [Google Scholar]
- Normand S-LT, Iezzoni L, Wolf R, Shahian D, Kirle L. A Comprehensive Comparison of Whole System Hospital Mortality Measures. 2010. A Report to the Massachusetts Division of Health Care Finance and Policy, December.
- Pitches DW, Mohammed MA, Lilford RJ. “What Is the Empirical Evidence That Hospitals with Higher-Risk Adjusted Mortality Rates Provide Poorer Quality Care? A Systematic Review of the Literature”. BMC Health Services Research. 2007;7:91–8. doi: 10.1186/1472-6963-7-91. [DOI] [PMC free article] [PubMed] [Google Scholar]
- Seagroatt V, Goldacre MJ. “Hospital Mortality League Tables: Influence of Place of Death”. British Medical Journal. 2004;328:1235–6. doi: 10.1136/bmj.38058.517118.47. [DOI] [PMC free article] [PubMed] [Google Scholar]
- Shahian DM, Wolf RE, Iezzoni LI, Kirle L, Normand S-LT. “Variability in the Measurement of Hospital-Wide Mortality Rates”. New England Journal of Medicine. 2010;363:2530–9. doi: 10.1056/NEJMsa1006396. [DOI] [PubMed] [Google Scholar]
- Sundararajan V, Henderson T, Perry C, Muggivan A, Quan H, Ghali WA. “New ICD-10 Version of the Charlson Comorbidity Index Predicted In-Hospital Mortality”. Journal of Clinical Epidemiology. 2004;57:1288–94. doi: 10.1016/j.jclinepi.2004.03.012. [DOI] [PubMed] [Google Scholar]
Associated Data
This section collects any data citations, data availability statements, or supplementary materials included in this article.