Abstract
Rationale
Human clinical trials using type 1 angiotensin (AT1) receptor antagonists indicate that angiotensin II is a critical mediator of cardiovascular and renal disease. However, recent studies have suggested that individual tissue pools of AT1 receptors may have divergent effects on target organ damage in hypertension.
Objective
We examined the role of AT1 receptors on T lymphocytes in the pathogenesis of hypertension and its complications.
Methods and Results
Deficiency of AT1 receptors on T cells potentiated kidney injury during hypertension with exaggerated renal expression of chemokines and enhanced accumulation of T cells in the kidney. Kidneys and purified CD4+ T cells from “T cell knockout” mice lacking AT1 receptors on T lymphocytes had augmented expression of Th1-associated cytokines including IFN-γ and TNF-α. Within T lymphocytes, the transcription factors T-bet and GATA-3 promote differentiation toward the Th1 and Th2 lineages, respectively, and AT1 receptor-deficient CD4+ T cells had enhanced T-bet / GATA-3 expression ratios favoring induction of the Th1 response. Inversely, mice that were unable to mount a Th1 response due to T-bet deficiency were protected from kidney injury in our hypertension model.
Conclusions
The current studies identify an unexpected role for AT1 receptors on T lymphocytes to protect the kidney in the setting of hypertension by favorably modulating CD4+ T helper cell differentiation.
Keywords: Hypertension, Kidney disease, T lymphocytes, Inflammation
INTRODUCTION
Chronic persistent hypertension is widely prevalent and leads to several catastrophic cardiovascular complications including stroke, congestive heart failure, and chronic kidney disease (CKD).1 The remarkable efficacy of type 1 angiotensin (AT1) receptor blockers (ARBs) in lowering blood pressure suggests that in hypertensive patients the renin-angiotensin system is broadly activated via AT1 receptor stimulation.2 Clinical trials have shown that pressure reduction during treatment with ARBs slows but does not halt or reverse the progression of hypertensive kidney injury.3 A more precise understanding of AT1 receptor functions in hypertension will therefore be critical to the optimization of treatment strategies for CKD.
Several studies have suggested that the regulation of immune responses by angiotensin (Ang) II during hypertension may alter the pattern and severity of associated kidney damage. For example, broad immunosuppression mitigates renal injury during Ang II-dependent hypertension,4 and lymphocyte deficiency during Ang II infusion blunts blood pressure elevation and target organ damage,5, 6 suggesting that Ang II can potentiate kidney injury by stimulating pro-inflammatory signals. However, these earlier studies did not determine whether Ang II shapes inflammatory responses through direct activation of AT1 receptors on immune cells or other intermediary cell lineages.
More recent studies have explored the role of AT1 receptors on immune cells in modulating target organ damage by using AT1 receptor-deficient bone marrow chimeras. These experiments have yielded conflicting results.7–10 However, several confounding elements of the bone marrow transfer model may complicate the interpretation of these results. For example, the lethal irradiation required for bone marrow transplantation may by itself alter gene expression programs in the recipient's heart and kidney thereby influencing the injury response,11 and re-population of the recipient's bone marrow with transplanted donor cells may not reliably recapitulate normal development of the endogenous immune system.12 These limitations highlight the need for a novel genetic approach to examine functions of AT1 receptors on immune cell lineages.
T lymphocytes are known to express AT1 receptors13 and infiltrate the kidney in the setting of hypertension.4 Therefore, to precisely determine the role of AT1 receptors on T lymphocytes in regulating blood pressure and target organ damage in hypertension we used a Cre-lox gene targeting strategy to selectively remove AT1A receptors from T lymphocytes. We find that AT1 receptors on T cells protect the kidney in hypertension and that activation of AT1 receptors on T cells in this setting suppresses their differentiation toward the pro-inflammatory Th1 phenotype. We further confirm that this pro-inflammatory Th1 immune response mediates hypertensive kidney damage by showing that T-bet-deficient mice lacking Th1 responses are protected from kidney injury in our hypertension model.
MATERIALS AND METHODS
Mice
C57BL/6 Agtr1aflox/flox mice were previously generated14 and were crossed in 2 steps of breeding with mice harboring Cre recombinase under the control of the CD4 promoter15 to generate CD4 Cre+ Agtr1aflox/flox (T cell KO) mice. To increase the susceptibility to kidney injury, T cell KO mice from the C57BL/6 strain were crossed with Agtr1aflox/flox mice from the 129/SvEv strain to yield the [C57BL/6 × 129/SvEv]F1 T cell KO and T cell WT (CD4 Cre− Agtr1aflox/flox) littermates for our experiments. To confirm selective CD4 Cre expression in lymphoid tissues, mT/mG mice from Jackson Laboratory were crossed with the CD4 Cre recombinase transgenic lines. mT/mG mice normally express red fluorescence protein in all tissues. When Cre is present, the mT cassette is deleted, triggering expression of the membrane-targeted EGFP.16 T-bet−/− mice on the C57BL/6 background were purchased from Jackson Laboratory and backcrossed to the 129/SvEv strain for 6 generations to increase susceptibility to kidney damage. Then, T-bet heterozygotes were intercrossed to yield the T-bet KO and WT littermates for our experiments. Further details are included in the Online Supplement.
Model of Angiotensin II-Dependent Hypertension
Experimental animals underwent left nephrectomy followed 1 week later by implantation of a pressure-sensing catheter via the left common carotid artery as previously described.17 After allowing 7 days for reestablishment of diurnal blood pressure variation, blood pressure measurements were recorded at baseline and during 4 weeks of chronic Ang II or saline infusion as detailed in the Online Supplement.
Histological Analysis
At the end of the 28-day experimental period, the heart and kidney were harvested and weighed. Portions of kidney were fixed and analysis of renal damage and inflammation was performed as outlined in the Online Supplement. To stain glomerular podocytes on kidney sections, we employed a WT1 antibody (Santa Cruz) at a 1:400 dilution per a previously established method.18 WT1-positive podocytes in each glomerular cross-section were then enumerated with a blinded approach, scoring 15–20 glomeruli per mouse.
Evaluation of Lymphocyte Populations
At the conclusion of the Ang II-infusion protocol, the spleen, thymus, and kidney were collected for analysis. Single cell suspensions of splenocytes, thymocytes, and kidney cells were prepared, and flow cytometry was performed as described previously.19, 20 The antibodies used and cell sorting procedures are detailed in the Online Supplement.
Isolation of RNA and Realtime PCR
Total RNA was isolated from individual cells or tissues by using the RNeasy Mini Kit according to manufacturer's instructions. RNA expression levels were then determined for Agtr1a, interferon-γ (IFN-γ ), tumor necrosis factor-α (TNF-α ), transforming growth factor-β (TGF-β), interleukin-1β (IL-1β), interleukin-4 (IL-4), monocyte chemoattractant protein 1 (MCP-1), CCL5 (regulated on activation, normal T expressed and secreted), neutrophil gelatinase-associated lipocalin (NGAL), CD4, CD8, T-bet, and GATA-3 by real-time PCR as detailed in the Online Supplement.
Cytokine ELISA
Splenic lymphocytes were obtained from both T cell KO and WT mice at the end of the Ang II infusion protocol as above. Cytokines were quantified in the media after the stated time of co-culture of the lymphocytes with anti-CD3ε (NA/LE, BD) or isotope antibody. ELISA assays targeting IFN-γ, TNF-α, and IL-4 were performed with specific kits from Invitrogen according to manufacturer's instructions.
Statistics
The values of each parameter within a group are expressed as the mean ± the standard error of the mean (SEM). Please see Online Supplement for further details of statistical analysis.
RESULTS
Generation of Mice With Specific Deletion of The AT1A Receptor on T Cells
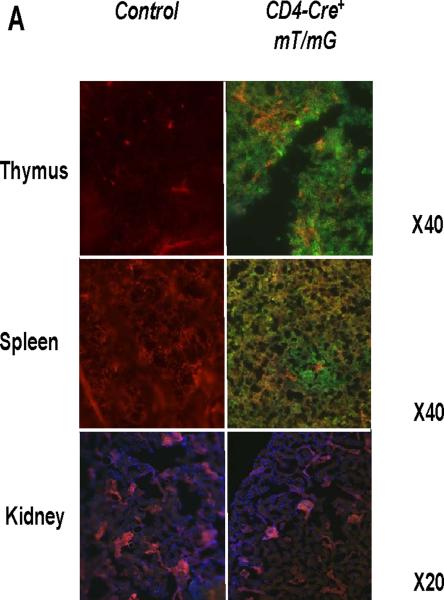
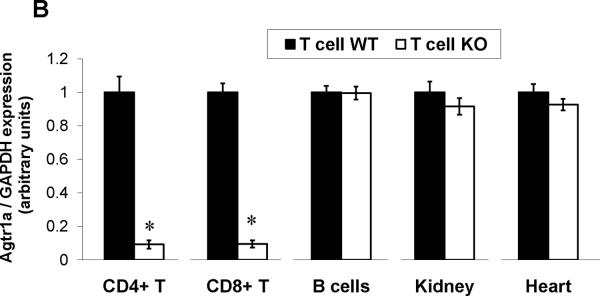
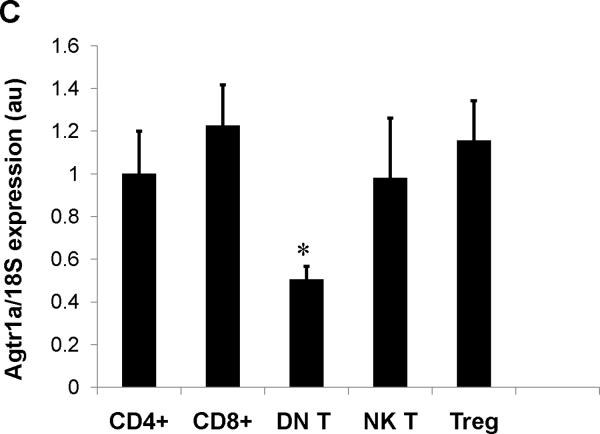
Consistent with previous reports13, we detected robust mRNA expression for the Agtr1a gene encoding the AT1A receptor in T lymphocytes, albeit at lower levels than in kidney and heart (Online Figure I). Therefore, to examine the functions of AT1 receptors on T cells in hypertension, we removed AT1A receptor-mediated responses from T lymphocytes by using a Cre-lox gene targeting approach. During the double positive phase of maturation in the thymus, all thymocytes destined to become single positive CD4+ or CD8+ circulating T lymphocytes express the CD4 promoter. Accordingly, by breeding a CD4-Cre mouse line15 with a double fluorescence reporter mouse (mT/mG) we confirmed robust Cre expression marked by GFP within the thymus and spleen of CD4-Cre+mT/mG mice but the absence of Cre expression marked by red fluorescent protein in non-lymphoid tissues such as the kidney (Figure 1A). We therefore bred the CD4-Cre mouse line with an Agtr1a flox line harboring loxP sites on either side of the coding region for the AT1A receptor. For our experiments, we employed CD4-Cre+Agtr1aflox/flox mice (T cell KO) and CD4 Cre− Agtr1aflox/flox (T cell WT) littermates. To confirm T cell-specific deletion of AT1A receptors in our T cell KO animals, we labeled splenocytes for T and B lymphocyte markers and isolated CD4+ T cells (CD4+CD8−CD19−), CD8+ T cells (CD8+CD4−CD19−), and B lymphocytes (CD19+Thy1−) via fluorescent cell sorting (Online Figure II). Using RNA from these immune cells and from kidney and heart, we then performed real-time PCR for the Agtr1a gene to confirm the degree and precision of T cell-specific deletion. Compared with their T cell WT littermates, T cell KO mice exhibited 90% deletion of the AT1A receptor from both CD4+ and CD8+ T cells but preserved AT1A receptor expression in all other tissues examined (Figure 1B). Within the T cell WT group, we detected similar levels of AT1A receptor expression on most circulating T cell subsets including CD4+, CD8+, T regulatory, and NK T cells. However, levels of Agtr1a mRNA were roughly 50% lower in the double negative CD3+CD4−CD8− T cells (Figure 1C).
Figure 1. Verification of T cell-specific deletion of the AT1A receptor in T cell KO mice.
A, Representative histology of thymus, spleen, and kidney in CD4-Cre+ mT/mG and Control (CD4 Cre- mT/mG) mice. Green fluorescence indicates the presence of CD4 Cre expression whereas red fluorescence indicates the absence of CD4 Cre expression. Blue fluorescence in kidney is a nuclear DAPI stain. B, Splenocytes were harvested from T cell WT and T cell KO littermates and sorted into 3 subpopulations. Agtr1a mRNA expression was quantitated in these purified immune cell populations and in kidney and heart from T cell WT and T cell KO groups (n≥6) and normalized to the T cell WT sample in each tissue. “CD4+ T” and “CD8+ T” refer to CD4+ and CD8+ T cells, respectively. *P<0.00001 vs. T cell WT. C, mRNA expression for AT1A receptor on T lymphocyte subsets in T cell WT mice. Agtr1a expression was similar on all T cell subsets analyzed except in double negative (DN) CD3+CD4-CD8- T cells, in which Agtr1a expression was significantly lower than in CD4+ or CD8+ T lymphocytes. Treg = CD4+CD25+ T regulatory cells. *P=0.04 vs. CD4+ T cells, P=0.005 vs. CD8+ T cells. N=6 per group.
AT1A Receptors on T Cells Do Not Regulate Blood Pressure
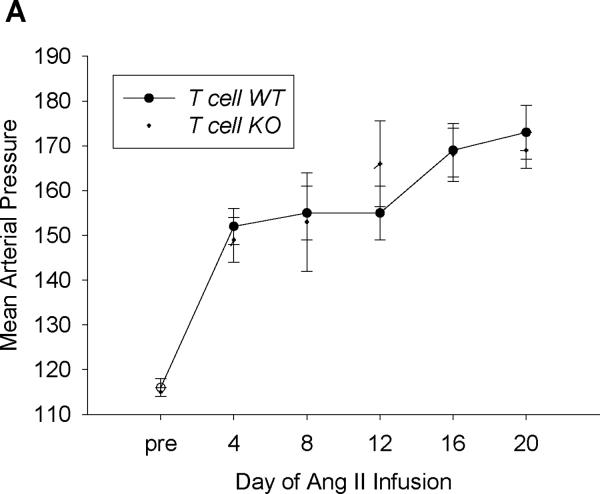
Following verification of AT1A receptor deletion in the T cell KO animals, mice underwent unilateral nephrectomy to render the remaining kidney more susceptible to hypertensive damage. After uni-nephrectomy, baseline blood pressures were measured by radiotelemetry in the experimental groups (Figure 2A). Baseline blood pressures in the T cell WT and T cell KO mice were virtually identical. Following measurement of baseline blood pressures, an osmotic mini-pump was implanted subcutaneously to chronically infuse Ang II as a robust model of hypertension with accompanying inflammatory kidney damage.4, 21 After the initiation of Ang II infusion, blood pressures in the T cell WT group rose more than 30 mm Hg and remained elevated throughout the infusion period (Figure 2A). During Ang II infusion, blood pressures measured in the T cell KO group remained similar to those of their WT littermates (Figure 2A), indicating that AT1 receptors on T lymphocytes do not regulate the chronic hypertensive response to Ang II.
Figure 2. Activation of AT1A receptors on T lymphocytes protects from hypertensive kidney injury.
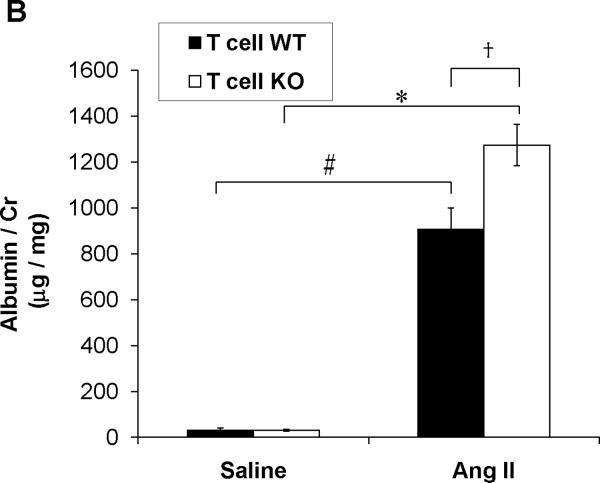
A, Baseline blood pressures were measured by radiotelemetry for 3 days. Then experimental mice were infused for 28 days with angiotensin II (1000ng/kg/min) via subcutaneously implanted osmotic minipump. Mean arterial pressures are depicted for T cell WT (n=11) and T cell KO (n=12) littermates. B, Urine samples were collected by placing experimental mice into metabolic cages after 25 days of saline or Ang II infusion. Urinary albumin excretion was quantitated per methods. #P<0.001 vs. Saline T cell WT; *P<0.0001 vs. Saline T cell KO; †P<0.009 vs. Ang II T cell WT. C-E, Staining of glomerular podocytes with WT1 antibody following 4 weeks of Ang II. Podocytes stain bright green. Representative images of (C) T cell WT and (D) T cell KO glomeruli. (Magnification 40×) E, number of podocytes per glomerulus in T cell WT and KO kidneys (6 mice per group). *P=0.02 vs. T cell WT. F, Renal NGAL mRNA expression in saline- or Ang II-infused T cell WT or T cell KO mice. #P<0.02 vs. Saline T cell WT; *P=0.005 vs. Saline T cell KO; †P=0.001 vs. Ang II T cell WT.
Cardiac hypertrophy is a frequent complication of persistent hypertension and typically correlates closely with the degree of blood pressure elevation.22 We therefore examined cardiac hypertrophy in the T cell WT and KO groups by measuring heart weight to body weight ratios after 4 weeks of saline or Ang II infusion (Online Figure III). Compared to saline, Ang II caused more than a 35% increase in heart weights in the T cell WT (P=0.0002) and T cell KO mice (P<0.0001). However, there was no difference between these groups in cardiac enlargement during Ang II-induced hypertension. The degree of pathological injury in the hearts of our experimental animals was quite mild with T cell infiltration that was marginally increased following Ang II compared to saline (Online Figure IV). The hearts from the Ang II-infused T cell KO mice contained numerically but not significantly greater T cell numbers than their T cell WT counterparts, matched by a trend toward enhanced expression of the T cell chemokine CCL5 in the T cell KO group (Online Figure V). Macrophage infiltration into the heart was sparse and similar with saline and Ang II infusion (<2 macrophages per heart cross-section in all groups).
AT1A Receptor-Deficiency on T Cells Exacerbates Kidney Injury in Ang II-Induced Hypertension
Interfering with T lymphocyte functions in the setting of hypertension reduces associated kidney damage.4, 23 Therefore, following 4 weeks of saline or Ang II infusion we quantitated urinary albumin excretion in the experimental groups as a marker for kidney injury (Figure 2B). Levels of albuminuria in the saline-infused T cell WT and KO mice were mild and identical. Ang II infusion was associated with a dramatic increase in urinary albumin excretion in the T cell WT and T cell KO groups. However, despite the similar blood pressures in these 2 groups, the Ang II-infused T cell KO mice had nearly 40% more urinary albumin excretion than the Ang II-infused T cell WTs (P<0.009). Within the kidney glomerulus, the podocyte is a key component of the filtration barrier such that podocyte loss leads to exaggerated urinary albumin excretion. We therefore stained the T cell WT and KO kidneys for the podocyte marker WT118 and counted the number of podocytes per glomerulus in each group (Figure 2C–E). Following Ang II, staining for podocytes was significantly reduced in the T cell KO kidneys compared to T cell WT controls (P=0.02). By contrast, semi-quantitative scoring of renal tubular damage revealed no epithelial reactivity in the saline- or Ang II-infused experimental groups and only rare tubular casts in the Ang II-infused T cell WT and KO kidneys (0.62±0.18 vs. 0.47±0.17 arbitrary units; P=NS). Moreover, renal function as measured by serum creatinines deteriorated only mildly with Ang II infusion and to a similar extent in the T cell WT and KO animals (Online Figure VI).
Neutrophil gelatinase associated lipocalin (NGAL) is another sensitive marker of progressive kidney injury.24 We therefore measured NGAL mRNA expression in the kidneys from our T cell WT and KO groups following saline or Ang II infusion (Figure 2F). Renal expression of NGAL was similar in the saline-infused T cell WT and KO mice. Induction of hypertension with Ang II resulted in a nearly 2-fold increment in NGAL expression in T cell WT kidneys. However, Ang II achieved an even more profound up-regulation in NGAL expression in the T cell KO kidneys (P=0.001 vs. Ang II T cell WT), suggesting that AT1 receptors on T lymphocytes paradoxically constrain the kidney injury response in the setting of Ang II-dependent hypertension.
Regulation of Mononuclear Cell Accumulation in the Kidney by T Cell AT1A Receptors
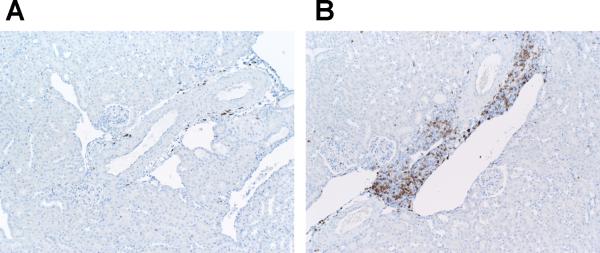
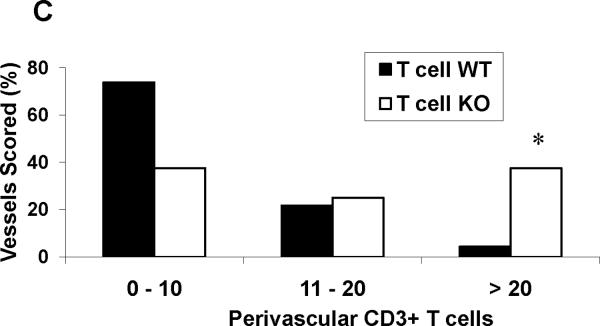
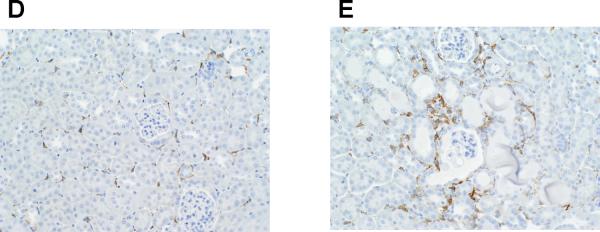
T cells and macrophages accumulate in the kidney in several forms of hypertension,4, 23, 25 and cytokines produced by these cells have the capacity to direct local inflammatory damage.26, 27 Therefore, following Ang II infusion, the T cell WT and KO kidneys were stained for the immune cell markers CD3 for T lymphocytes and F4/80 for macrophages. Because nearly all of the T cells were clustered around vessels in the kidney, we used a published system4 to quantitate the density of perivascular T cell infiltrates in the kidneys from the 2 groups (Figure 3A–C). The proportion of dense perivascular clusters containing >20 CD3+ T cells was dramatically enhanced in the kidneys from the T cell KO group (37.5%) compared with the T cell WT controls (4.3%; P=0.004). To estimate the proportions of CD4+ and CD8+ T cells infiltrating the kidney during Ang II-dependent hypertension, we computed the ratios of CD4 and CD8 mRNA expression in the T cell WT and KO kidneys. Compared to the T cell WTs, the T cell KO kidneys had a markedly enhanced CD4/CD8 ratio [1.00±0.16 vs. 2.89±0.50 arbitrary units (au); P=0.02]. To more precisely enumerate the CD4+ and CD8+ T lymphocytes infiltrating the kidney, we isolated T lymphocytes directly from the kidneys of our Ang II-infused animals using fluorescent cell sorting (Online Figure VIII). Compared to T cell WT controls, the T cell KO kidneys contained increased numbers of CD4+ T cells (P<0.04), indicating that deficiency of AT1 receptors on CD4+ T cells favors their infiltration into the inflamed hypertensive kidney. By contrast, renal infiltration of CD8+ T cells28, recently shown to be the pro-hypertensive T cell subset in the setting of Ang II infusion, was similar in the 2 groups. Macrophage staining of the kidneys following Ang II-induced hypertension revealed a similar trend toward enhanced macrophage accumulation in the T cell KO kidneys compared to their T cell WT counterparts (P=0.09; Figure 3D–E).
Figure 3. Role of the AT1A receptor on T cells in regulating infiltration of mononuclear cells into the kidney during Ang II-dependent hypertension.
Embedded kidney sections were obtained from Ang II-infused T cell WT and KO mice and stained with anti-CD3 or anti-F4/80 antibody. A–B, representative images of T lymphocyte staining in kidneys from Ang II-infused (A) T cell WT mice and (B) T cell KO mice. C, proportion of renal vessels from Ang II-infused T cell WT and KO groups surrounded by 0–10, 11–20, or >20 CD3+ T cells, respectively. *P<0.0001 vs. T cell WT (Fisher's exact test across all 3 tertiles). D–E, representative images of macrophage staining in kidneys from Ang II-infused (D) T cell WT and (E) T cell KO mice.
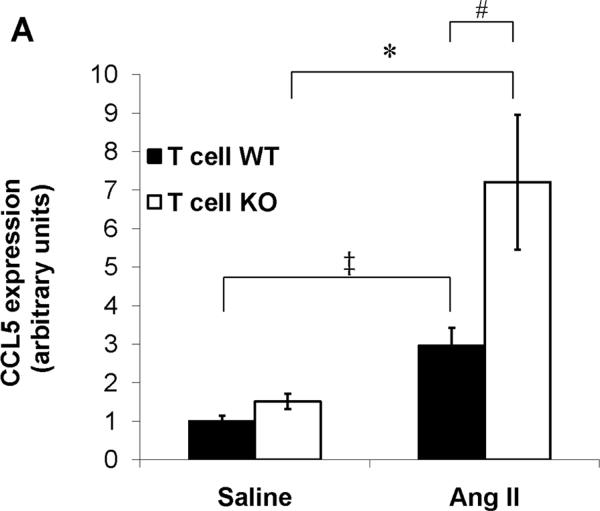
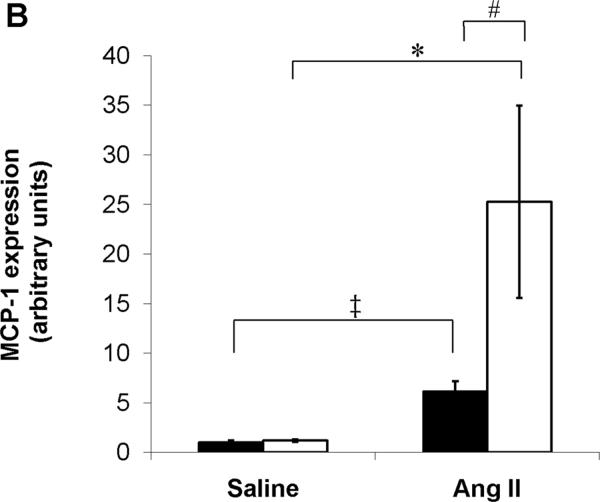
Chemokines play a critical role in recruiting inflammatory cells into the injured kidney, and their actions can have profound effects on progressive renal damage in hypertension.29 Therefore, to explore possible mechanisms through which AT1A receptor deficiency on T cells during Ang II infusion leads to accumulation of mononuclear cells in the kidney, we examined renal expression of the prototypical T cell and macrophage chemokines CCL5 and MCP-1, respectively. Compared to saline, Ang II caused significant upregulation in CCL5 mRNA expression in the kidneys from T cell WT mice. However, this exaggeration in renal CCL5 expression with Ang II was even more profound in the T cell KO group (P=0.03 vs. Ang II T cell WT; Figure 4A). With saline control, expression of MCP-1 was nearly identical in the T cell WT and KO kidneys. Similar to our CCL5 findings, Ang II infusion resulted in a > 6-fold increase in MCP-1 mRNA expression in T cell WT kidneys, but the induction of MCP-1 by Ang II in the kidneys of the T cell KO cohort was 4 times greater than in the T cell WTs (P<0.02; Figure 4B). These data indicate that AT1A receptors on T lymphocytes constrain renal expression of CCL5 and MCP-1 and limit the accumulation of mononuclear cells in the kidney during Ang II-dependent hypertension.
Figure 4. Deficiency of AT1A receptors on T lymphocytes permits enhanced renal expression of chemokines and inflammatory cytokines in Ang II-dependent hypertension.
A–B, Expression of chemokines in kidney tissues from saline- or Ang II-infused T cell WT and KO mice. A, CCL5 (RANTES) mRNA expression. ‡P<0.02 vs. Saline T cell WT; *P<0.05 vs. Saline T cell KO; #P=0.03 vs. Ang II T cell WT. B, MCP-1 mRNA expression. ‡P=0.009 vs. Saline T cell WT; *P<0.009 vs. Saline T cell KO; #P<0.02 vs. Ang II T cell WT. C, Expressions of IFN-γ, TNF-α, and IL-6 mRNA in kidneys from Ang II infused-T cell WT and KO mice. *P=0.04 vs. T cell WT; †P<0.04 vs. T cell WT.
AT1A Receptors on T Lymphocytes Suppress the Renal Inflammatory Response in Ang II-Dependent Hypertension
To determine whether the enhanced renal accumulation of T lymphocytes in the T cell KOs influenced the local generation of inflammatory mediators, we used RT-PCR to profile expression of several of these mediators in the kidney following Ang II infusion (Figure 4C). Renal expressions of IFN-γ and TNF-α were significantly upregulated in the T cell KO group compared to the T cell WTs (P≤0.04 for each). By contrast, expression of IL-6 was similar in the T cell WT and KO kidneys whereas IL-4 was not detectable in the kidneys from either group. The enhanced IFN-γ and TNF-α expressions in the T cell KO kidneys suggested the possible involvement of pro-inflammatory T lymphocytes in the accelerated hypertensive kidney injury in this group. Thus, we next examined how AT1A receptors on T lymphocytes regulate their differentiation and function in the setting of hypertension.
Maturation of T Lymphocytes in Thymus is Intact in T cell KO Mice
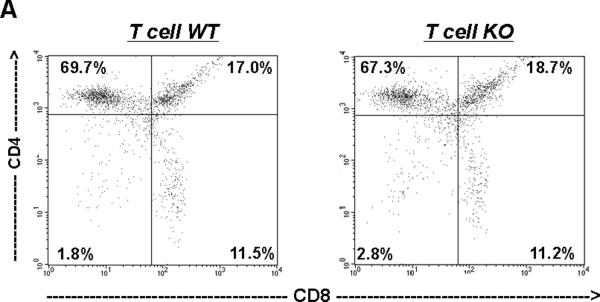
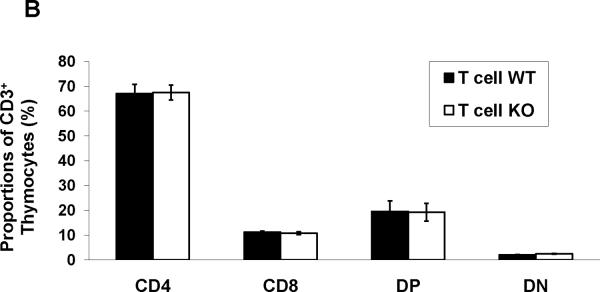
As the CD4 promoter is active relatively late during thymocyte differentiation in the so-called “double positive” phase, we anticipated that our model would not disrupt normal maturation of T cells in the thymus. Nevertheless, to characterize the maturation of T cells in the thymus of our experimental mice, we quantitated the proportions of CD3+CD4−CD8− double negative (DN), CD3+CD4+CD8+ double positive (DP), and CD4+ or CD8+ single positive thymocytes using flow cytometry (Figure 5A–B). This analysis revealed similar proportions of each of these thymocyte populations in the T cell WT and KO groups, suggesting that thymic maturation was indeed intact in the T cell KO animals.
Figure 5. T cell KO mice have normal maturation of T lymphocytes in the thymus.
Thymocytes were isolated from T cell WT and KO animals and labeled for CD4 and CD8. A, Representative dot-plots of single positive CD4+, CD8+, double positive, and double negative T cell proportions in thymus from T cell WT and KO animals. (n=4). B, Summary data for thymocyte proportions showing similar percentages of CD4+, CD8+, DP (CD4+CD8+), and DN (CD4−CD8−) thymocytes in T cell WT and KO animals.
Ang II-Infused T Cell KO Animals Have Altered Proportions of T Lymphocytes In Spleen
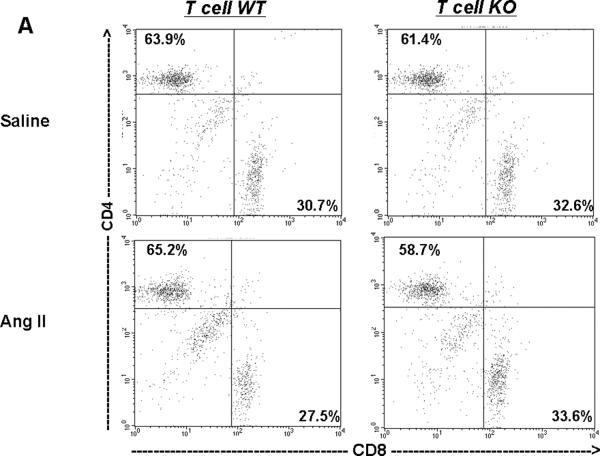
Next, we examined the proportions of T lymphocytes in the spleen, a major secondary peripheral lymphoid organ and reservoir for circulating mononuclear cells (Figure 6A–B). After saline infusion, proportions of CD4 and CD8 cells were similar in the T cell WT and KO groups (top panels of Figure 6A–B), indicating that homing of T lymphocytes to the spleen was intact in the T cell KO group. Following Ang II infusion, the proportions of CD4+ T cells in the T cell KO spleens were slightly but significantly diminished compared to their T cell WT counterparts (P<0.006) (bottom panels of Figure 6A–B), consistent with enhanced retention of CD4+ T lymphocytes in the T cell KO kidney during Ang II-dependent hypertension.
Figure 6. T cell KO mice have diminished proportions of CD4+ T lymphocytes residing in spleen during Ang II-dependent hypertension.
T cell proportions in spleen from saline- and Ang II-infused T cell WT and KO mice (n≥6). A, Representative dot plots of CD4+ and CD8+ T cell subsets in spleen following Saline or Ang II infusion in T cell WT and KO groups. B, Summary data for CD3+ splenocyte distribution showing diminished proportions of CD4+ T cells with a reciprocal increase in CD8+ T cell proportions in the spleens of T cell KO animals following Ang II infusion. *P<0.006 vs. Ang II T cell WT; †P<0.03 vs. Ang II T cell WT.
AT1 receptors on CD4+ T cells could limit their accumulation in the damaged kidney by influencing their recruitment from lymphoid reservoirs such as the spleen and/or by altering the proliferative response of T cells in the setting of hypertensive kidney injury. In this regard, CD4+ T cells isolated from the T cell KO group had exaggerated expression of the T cell chemokine CCL5 compared to controls (1.50±0.18 vs. 1.00±0.13 au; P=0.04), suggesting that enhanced chemokine production by infiltrating AT1A receptor-deficient T cells potentiated their accumulation in the T cell KO kidney. Consistent with this notion, we found considerably higher levels of intrinsic CCL5 expression in lymphocytes compared to whole kidney or freshly isolated renal tubular epithelial cells (Online Figure IX). To examine T cell proliferative responses, lymphocytes were isolated from experimental animals and labeled with CFSE. After re-stimulation with anti-CD3ε or vehicle control, CD4+ T cells were labeled, allowing the calculation of their proliferation indices (Online Figure XA–C).30 No significant differences in proliferative capacity were evident between the CD4+ T lymphocytes from T cell WT and KO groups in these studies.
Enhanced Differentiation Toward The Pro-Inflammatory Th1 Phenotype in AT1A Receptor-Deficient T Cells In Vivo
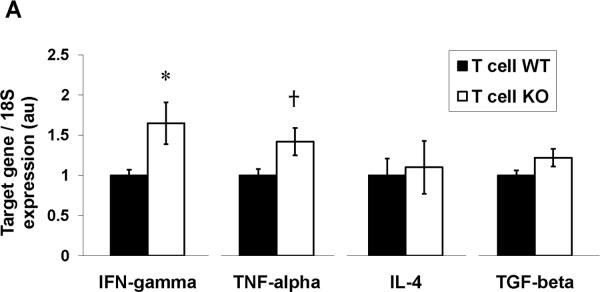
Upon activation, CD4+ T lymphocytes have the capacity to differentiate into several distinct subsets including the Th1, Th2, Treg, and Th17 phenotypes. As the pattern of cytokine expression in the hypertensive kidneys from our T cell KO group suggested the possible involvement of pro-inflammatory Th1 cells, we next examined the impact of the AT1 receptor on the differentiation of CD4+ T lymphocytes. To this end, we used fluorescent cell-sorting to isolate CD4+ T cells from the spleen and kidney following 4 weeks of Ang II infusion and measured mRNA expression of the cytokines that mark these T helper subsets. As shown in Figure 7A, we were able to detect in splenic CD4+ T cells expression of IFN-γ and TNF-α as markers for the Th1 subset, IL-4 as a marker for the Th2 subset, and TGF-β1 as a marker for Treg cells. Similar to our findings in whole kidney, mRNA expressions of IFN-γ and TNF-α were increased in the CD4+ T cells isolated from the T cell KO spleens (Figure 7A) and kidney (Online Figure XI) compared to T cell WT controls, confirming that the enhanced expression of these Th1-associated cytokines in the T cell KO kidneys was driven in part by increased production of these cytokines from the infiltrating T lymphocytes in this group. By contrast, CD4+ T cell expressions of IL-4, produced by Th2 cells, and TGF-β1, produced by T regulatory cells, respectively, were similar in the T cell KO and WT groups following Ang II infusion (Figure 7A).
Figure 7. Stimulation of the AT1A receptor on T lymphocytes constrains Th1 differentiation in the setting of hypertension.
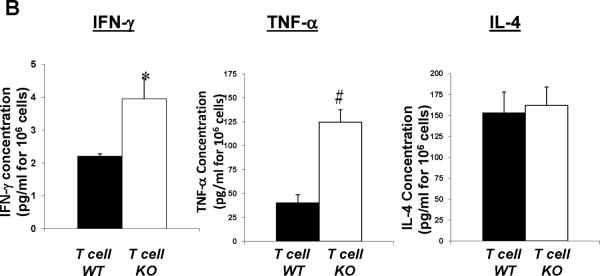
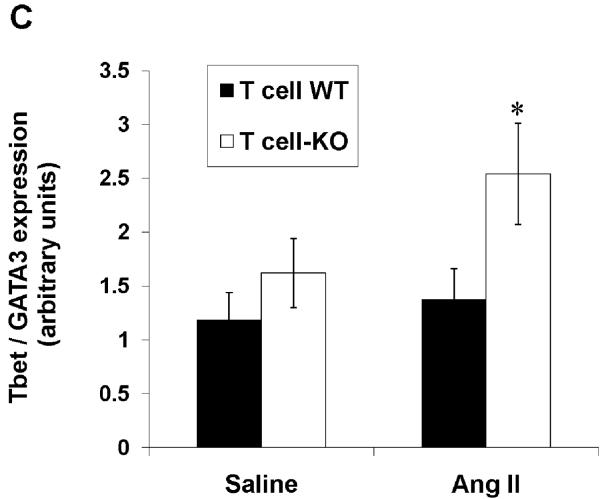
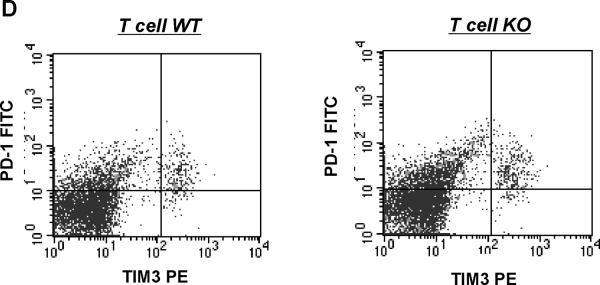
CD4+ T cells were isolated via fluorescent cell sorting from the spleens of Ang II-infused T cell WT and KO animals and characterized for Th1 vs. Th2 phenotype. A, mRNA expressions of IFN-γ, TNF-α, IL-4, and TGF-β in CD4+ T lymphocytes from T cell WT and KO mice (n≥6). *P<0.03 vs. T cell WT; †P=0.03 vs. T cell WT. B, concentrations of IFN-γ, TNF-α, and IL-4 proteins in supernatants of activated splenic lymphocytes from Ang II-infused T cell WT and KO mice (n=6). *P=0.05 vs. T cell WT; #P<0.005 vs. T cell WT. C, ratio of mRNA expression of T-bet/GATA3 in purified CD4+ T lymphocytes from T cell WT and KO mice (n=5–6). *P=0.05 vs. Ang II T cell WT. D, co-expression of PD-1 and TIM-3 measured by flow cytometry is similar on splenic CD4+ T cells from T cell WT and KO mice (n≥6). Representative dotplots are shown. Summary data are presented in the text.
The enhanced expression of IFN-γ and TNF-α in the CD4+ T cells from the T cell KO group indicated a propensity of these T cells toward a Th1 phenotype. Therefore, to confirm the differences seen in IFN-γ and TNF-α production at the protein level, we pursued an ELISA approach. Accordingly, we harvested splenic lymphocytes from our Ang II-infused T cell WT and KO groups, activated the T cells in the culture with anti-CD3ε, and assayed the culture supernatants for IFN-γ, TNF-α, and IL-4 (Figure 7B). Lymphocytes from the T cell KO animals had exaggerated production of IFN-γ (P<0.05) and TNF-α (P=0.005) compared to T cell WT controls. By contrast, IL-4 levels were similar in the culture supernatants from the T cell KO and WT groups. These data indicate that AT1 receptors on T lymphocytes suppress their production of Th1 cytokines, an effect that could be mediated through alterations in T cell differentiation and/or exhaustion.
Differentiation of CD4+ T lymphocytes into Th1 versus Th2 cells is reciprocally regulated by the T-bet and GATA-3 transcription factors, respectively.31, 32 Therefore, the ratio of these factors within the T cell determines its propensity for commitment to the Th1 or Th2 lineages.32, 33 Accordingly, we quantitated the ratio of T-bet/GATA-3 mRNA expression in the splenic CD4+ T cells from our T cell WT and KO groups. Following saline infusion, the T-bet/GATA-3 ratios were similar between the T cell WT and KO cohorts (Figure 7C). By contrast, following 4 weeks of in vivo Ang II infusion, purified CD4+ T lymphocytes from the T cell KO animals had augmented T-bet/GATA-3 ratios compared to T cell WT controls (P=0.05; Figure 7C). These changes in T cell differentiation were then confirmed in CD4+ T lymphocytes isolated directly from the kidneys of our Ang II-infused animals (Online Figure XI) with marked upregulation of T-bet (P=0.0003) and downregulation of GATA-3 (P<0.02) in the T cell KO group. Thus, in the setting of hypertension, AT1 receptor-deficiency in T lymphocytes triggers an imbalance in transcription factors within the T cell favoring Th1 differentiation and the accumulation of these pro-inflammatory Th1 cells within the kidney.
Recent evidence has emerged illustrating that, in the setting of chronic stimulation as might occur in our hypertension model, T cells may become exhausted and thereby secrete reduced amounts of cytokine. Exhausted T lymphocytes characteristically express higher surface levels of programmed death 1 (PD-1) coordinately with T cell immunoglobulin and mucin-domain-containing molecule 3 (Tim-3).34 Therefore, to evaluate whether a difference between our experimental groups in T cell exhaustion contributed to the disparate levels of IFN-γ and TNF-α produced by T lymphocytes in our model, we isolated CD4+ T cells from our Ang II-infused mice and labeled them for PD-1 and Tim-3 (Figure 7D). We found that concomitant cell surface expression of PD-1 and Tim-3 was similar on the CD4+ T lymphocytes from the T cell WT and KO groups (3.91±0.88 vs. 2.91±0.82%; P=NS; Figure 7D). Thus, AT1 receptors on T lymphocytes do not appear to regulate their exhaustion via a PD-1 dependent pathway.
To gain further insights into how chronic stimulation of the AT1 receptor suppresses Th1 pro-inflammatory responses in T lymphocytes in our hypertension model, we harvested CD4+ T lymphocytes directly from the kidneys our Ang II-infused experimental animals and surveyed their expression of immunity-related cell signaling molecules via microarray analysis. The genes that were differentially expressed by >1.5 fold in the infiltrating T cells from the T cell WT and KO groups are listed in Online Table I. Markers that were significantly upregulated in the AT1A receptor-deficient T cells included STAT4, a transcription factor that along with T-bet directs CD4+ T cells toward the Th1 lineage, CD3 and CD28, involved in Signals 1 and 2 of T cell activation, respectively, and CXCR3, a chemokine receptor preferentially expressed on Th1 cells. By contrast, CD25, a marker of activated T cells but also T regulatory cells was numerically but not significantly downregulated on the AT1A receptor-deficient T lymphocytes.
Chronic Stimulation of AT1 Receptors on T Cells Suppresses Their Th1 Differentiation In Vitro
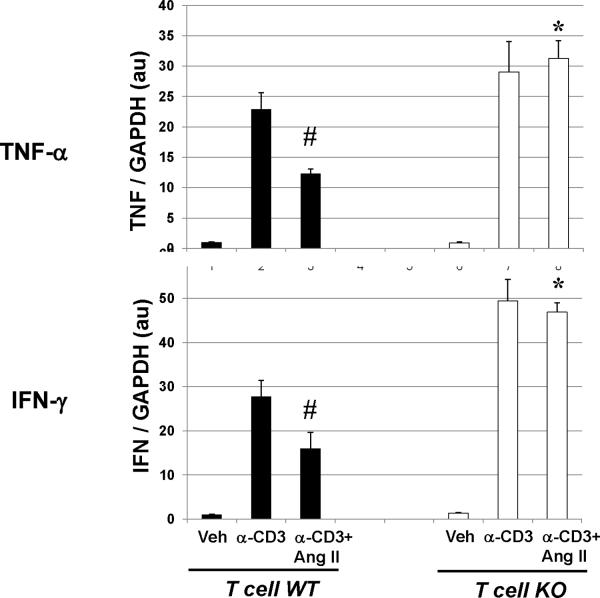
Previous reports indicated that AT1A receptor-deficient lymphocytes have impaired rather than exaggerated responses to acute stimuli.13, 35 Therefore, to better understand how AT1 receptors on T cells shape the inflammatory response, we examined the functions of naïve lymphocytes during in vitro stimulation. Consistent with prior studies, mixed lymphocyte reactions to allogeneic stimuli demonstrated a blunted proliferative response in AT1A receptor-deficient lymphocytes (Online Figure XII). By contrast, after 24 hours of T cell receptor stimulation in an ELISPOT assay, the frequency of IFN-γ-producing responders was enhanced among AT1A receptor-deficient lymphocytes in a dose-dependent pattern (Online Figure XIII), consistent with our in vivo findings. Thus, given that lymphocytes harvested from our experimental T cell KO animals displayed normal proliferative responses (Online Figure XA–C) and exaggerated Th1 cytokine production (Figure 7A–B), we hypothesized that the enhanced Th1 responses of T lymphocytes from our T cell KO animals arose from the chronic stimulation occurring in our hypertension model. We therefore subjected naive T cell WT and KO lymphocytes to persistent T cell receptor stimulation for 7 days during in vitro culture in the absence or presence of Ang II and measured their expression of IFN-γ and TNF-α (Figure 8). Similar to our in vivo findings, the persistently-activated T cell KO lymphocytes had exaggerated expression of IFN-γ and TNF-α compared to activated T cell WT controls. In these cultures, concomitant exposure to Ang II suppressed IFN-γ and TNF-α expression in the T cell WT but not the T cell KO lymphocytes, indicating that chronic exposure to Ang II as occurs in our hypertension model suppresses Th1 cytokine production in T cells via an AT1 receptor-dependent pathway.
Figure 8. Chronic stimulation of AT1 receptors on T cells suppresses Th1 response in vitro.
mRNA expressions of IFN-γ and TNF-α in T cell WT and KO lymphocytes subjected to 7 days of persistent T cell receptor stimulation with anti-CD3 +/− Ang II in in vitro culture. “Veh” = vehicle. #P≤0.02 vs. T cell WT+anti-CD3; *P≤0.003 vs. T cell WT+anti-CD3+AngII.
Pro-Inflammatory Th1 Immune Responses Mediate Hypertensive Kidney Damage
As our T cell KO animals had evidence of increased hypertensive kidney damage and enhanced Th1 immune responses, we hypothesized that the AT1 receptor on T lymphocytes constrains renal injury by blunting the Th1 differentiation of CD4+ T lymphocytes. Accordingly, to test the contribution of Th1 immune responses to the pathogenesis of hypertensive kidney damage, we subjected T-bet-deficient (T-bet KO) mice that are unable to mount a Th1 response and their littermate wild type controls (WT) to our Ang II-dependent hypertension model. Prior to Ang II infusion, there were no differences between the T-bet KO and WT groups in baseline blood pressure (Online Figure XIVA). Moreover, although both groups had a robust chronic hypertensive response to Ang II, the WT and T-bet KO animals maintained similar blood pressures throughout the Ang II infusion period (177±2 vs. 174±2 mmHg; p=NS; Online Figure XIVA), indicating that Th1 immune responses do not contribute to the regulation of blood pressure by Ang II. Despite these similar blood pressures, renal expression of the kidney injury marker NGAL was diminished by 55% in the Ang II-infused T-bet KO group compared to controls (0.45±0.041 vs. 1.00±0.11 au; P<0.001). As evidence of reduced glomerular injury, following 4 weeks of Ang II infusion the T-bet KO mice had more than 40% less albuminuria than controls (15.3±2.7 vs. 26.6±4.7 mg/mg Cr; P=0.05). Moreover, T-bet KO animals compared to WT controls had preserved podocyte numbers marked by WT1 staining in the kidney glomerulus following Ang II infusion (11.7±1.2 vs 9.1±1.3 podocytes/glomerulus; P<0.003; Online Figure XIVB–D). Within the renal interstitium, T-bet-deficiency led to diminished accumulation of F4/80+ macrophages (2.1±0.1 vs. 3.1±0.2% of high-powered field; P=0.001; Online Figures XIVE–F) and peri-vascular CD3+ T lymphocytes (58.6 vs. 85.2% of vessels with >30 T cells; P<0.006 by χ2). Consistent with a muted Th1 response in the T-bet KO mice, renal expressions of IFN-γ and TNF-α were reduced by half in this group compared to WT controls following Ang II (Online Figure XIVG), whereas IL-4 was not detectable in the kidneys from either group. Collectively, these data indicate that the Th1 immune response mediates kidney damage in Ang II-dependent hypertension.
DISCUSSION
Activation of the renin angiotensin system through stimulation of type 1 angiotensin (AT1) receptors is a key regulator in blood pressure elevation and hypertensive end-organ damage. However, accumulating data have suggested that the actions of AT1 receptors in the setting of hypertension are tissue- and cell- specific.22 Blockade of inflammatory signaling cascades in the setting of Ang II-induced hypertension certainly protects target organs from injury,4, 36 but whether Ang II activates the immune system during hypertension through stimulation of AT1 receptors directly on hematopoietic cells or through other intermediary cell lineages has not been clear from earlier studies. Although rodents have two AT1 receptor isoforms, AT1A is the dominant AT1 isoform in most murine tissues, and in our preliminary studies we were able to detect only this isoform on purified T lymphocytes. Moreover, in the current studies, we detected robust and similar AT1A expression on all T cell subpopulations with the exception of the double negative T cell subset that is prominent only during early thymocyte development. Therefore, to precisely examine the actions of AT1 receptors on mature T lymphocytes in the pathogenesis of hypertension, we ablated the AT1A receptor exclusively from T cells by a Creloxp gene targeting strategy and then subjected these mice and their control littermates to chronic Ang II infusion. Surprisingly, these studies reveal that activation of AT1 receptors directly on T lymphocytes limits kidney damage in hypertension and suppresses production of inflammatory mediators.
In our experiments, intra-arterial blood pressures were measured in large numbers of conscious unrestrained animals using state-of-the-art radiotelemetry technology, and yet baseline blood pressures were similar between the T cell KO mice and their wild-type littermates. These data indicate that AT1 receptors on T cells do not regulate normal blood pressure homeostasis. These findings are consistent with our previous experiments using AT1 receptor deficient bone marrow chimeras.37 Moreover, in the current studies blood pressures remained similar in the T cell KOs and their littermate controls throughout several weeks of chronic Ang II infusion, suggesting that AT1 receptors on T cells do not regulate the chronic hypertensive response to Ang II. This finding contrasts with the results of our previously published experiments in which AT1A receptor-deficient bone marrow chimeras had an accentuated hypertensive response to Ang II.37 In that experiment, mice underwent lethal irradiation prior to bone marrow transfer, which may have altered injury responses in the kidney and/or compromised renal epithelial functions. Thus, we believe that the approach in our current study is more physiologic than our bone marrow transfer strategy. Alternatively, the current results allow for the intriguing possibility that RAS activation on immune cell lineages other than T cells may account for the protective actions of AT1 receptors on bone-marrow derived cells with regard to blood pressure elevation.38
The failure of AT1 receptors on T lymphocytes to influence the chronic hypertensive response to Ang II in the current studies also contrasts with the results from the Rag1-deficient model in which adoptive transfer of AT1A receptor-deficient T lymphocytes prior to Ang II infusion yielded a blunted chronic hypertensive response compared with transfer of wild-type lymphocytes.5 However, there are several important differences in the design of these 2 models. First, the Rag1-deficient animal develops without functional lymphocytes, whereas our experimental animals are immune-competent during development. Second, in the Rag1 model, lymphocytes were transferred 3 weeks before initiation of Ang II infusion, whereas in our model immune cell populations infiltrating target organs are endogenous. Finally, the mouse strains used in the 2 experiments were different as was the dose of Ang II employed to induce hypertension. These factors may each have contributed to different patterns of lymphocyte trafficking and function in the Rag1 study versus the current model.
Infiltration of T lymphocytes into the kidney is associated with more severe kidney damage in several models of hypertension23, 36 and blockade of lymphocyte functions protects the kidney from hypertensive damage.4 Urinary albumin excretion is the most widely used marker of kidney injury as albuminuria correlates closely with progression of kidney disease and even survival.3, 39 Thus, to determine whether AT1 receptors on T cells influence the degree of renal injury in our hypertension model, we measured urinary albumin excretion following 4 weeks of Ang II infusion. We found that T cell KO animals had dramatically higher levels of albuminuria than controls in the setting of hypertension. Moreover, the T cell KO kidneys showed significantly reduced WT1 staining for podocytes, the cells within the kidney glomerulus that prevent loss of albumin in the urine, indicating that AT1 receptor activation on T lymphocytes limits glomerular damage in hypertension and thereby mitigates albuminuria. Multiple lines of evidence have suggested that NGAL can serve as a sensitive marker of both acute and chronic kidney injury.40 We therefore measured kidney NGAL expression as another important marker for renal injury in our experiment. Consistent with the albuminuria findings, T cell KO animals had a far more profound elevation of renal NGAL expression than controls following Ang II infusion. Thus, the podocytopenia, exaggerated albuminuria, and augmented NGAL expression indicate that deficiency of AT1 receptors specifically on T lymphocytes permits exaggerated kidney disease during hypertension.
Interestingly, AT1 receptor deficiency on T cells worsened the level of renal injury in our model without causing an exaggerated increase in blood pressure during Ang II infusion. While an increase in kidney damage could potentially aggravate hypertension by interfering with renal sodium handling, there are several reports in which modulating immune responses during hypertension influenced the extent of kidney injury without impacting blood pressure elevation.4, 36 In the current experiments, the level of CD8+ T cell infiltration into the kidneys of our Ang II-infused T cell WT and KO animals was similar (discussed below), and recent data have emerged indicating that CD8+ rather than CD4+ T lymphocytes are the pro-hypertensive T cell subset influencing blood pressure during Ang II infusion.28 Moreover, the level of kidney damage in our model was quite mild relative to that seen in the pure 129/SvEv mouse36 and spared the renal tubular epithelium responsible for sodium trafficking in the kidney. Accordingly, the increases in serum creatinine were modest with Ang II and were similar in our T cell WT and KO mice such that the level of hypertension was not altered despite their differences in glomerular injury.
As mononuclear cell accumulation is a predictive marker for the progression of chronic kidney disease including renal damage induced by Ang II-dependent hypertension,4, 41 we examined accumulation of T lymphocytes and macrophages in the kidney in our hypertension model. We found that activation of AT1 receptors on T cells limits the accumulation of T cells around blood vessels in the kidney following chronic Ang II infusion. To assess the proportions of CD4+ and CD8+ T cells infiltrating the kidney in our experimental groups, we measured expression of CD4 and CD8 from kidney samples and directly enumerated fluorescently sorted T cells in digested kidney specimens. These approaches revealed an exaggerated aggregation of CD4+ T lymphocytes in T cell KO kidneys compared to controls. We detected a similar pattern in the heart. However, the level of T cell infiltration into the heart was minimal such that no statistical differences between the T cell WT and KO hearts emerged. Thus, activation of AT1 receptors directly on T lymphocytes suppresses the accumulation of CD4+ T cells in the inflamed kidney during hypertension, leading us to explore how AT1 receptors specifically on T lymphocytes influence T cell differentiation and infiltration into the target organ.
There are several potential mechanisms that could underlie the enhanced accumulation of CD4+ T cells in the injured hypertensive kidney. One possibility is that deletion of AT1 receptors on T cells impacts their maturation in the thymus leading to increased production of single positive CD4+ thymocytes at the expense of the CD8+, double positive, and/or double negative thymocyte lineages. Our analysis of isolated thymocytes indicates that thymic maturation is intact in T cells lacking AT1 receptors (Figure 5). A second possibility is that AT1 receptor-deficiency on T cells alters the distribution of circulating T cells in the setting of Ang II-dependent hypertension. By labeling splenic lymphocytes, we found a slight but significant decrease in the proportion of CD4+ T cells in the spleens of the Ang II-infused T cell KO animals (Figure 6A–B, bottom panels), suggesting that more CD4+ T cells remain in the kidney in this group. We speculate that this difference in proportion of CD4+ T cells was quite small because an antigen-driven response would recruit only a select population of T cells based on specificity of the T cell receptor. Regarding mechanisms of T cell recruitment, we detected enhanced chemokine levels within the kidney and in circulating T lymphocytes from the T cell KO animals. Thus, augmented CCL5 production by the CD4+ T cells in the T cell KO group likely contributes to their enhanced renal accumulation through a paracrine mechanism. Finally, we considered the possibility that activated CD4+ T cells lacking the AT1 receptor could have an exaggerated proliferative response in our model, leading to the higher proportions of these cells within the kidney. However, using the CFSE assay, we demonstrated a similar proliferative response to T cell receptor activation regardless of the absence or presence of the AT1 receptor on the T lymphocyte. Taken together, our data indicate that AT1 receptors on T cells regulate their trafficking into the injured kidney in the setting of hypertension by influencing their generation of chemokines.
CD4+ T lymphocytes can be categorized into several distinct functional subsets including the Th1, Th2, Treg, and Th17 subtypes, and these T helper subsets appear to play diverse roles in immunologically-mediated kidney diseases.42 By contrast, the roles of these T cell lineages in mediating kidney damage during hypertension are less well understood. On naïve T cells, AT1 receptor-deficiency impairs proliferative responses to allogeneic stimuli.13 Moreover, we have previously found that Ang II infusion promotes infiltration of CD4+ T cells into the kidney coupled with renal expression of Th1 cytokines.36 Thus, we were surprised to find in the current study that ablation of AT1 receptors selectively from T cells enhanced their expression of Th1 cell-associated molecules such as IFN-γ and TNF-α in the setting of persistent hypertension. Therefore, to confirm our in vivo findings in vitro, we subjected T cell WT and KO lymphocytes to chronic T cell receptor stimulation in culture and found augmented Th1 cytokine expression in T cell KO lymphocytes consistent with our in vivo findings. Furthermore, Ang II suppressed these cytokines only in the T cell WT lymphocyte culture. Thus, although AT1 receptors on T cells potentiate the acute allogeneic immune response thereby promoting acute allograft rejection13, we now find that persistent activation of AT1 receptors directly on the T lymphocyte serves a protective role by limiting Th1 cell-mediated chronic inflammation. We therefore explored potential mechanisms through which AT1 receptors on T cells suppress the Th1 lineage during hypertension.
T-bet is a key transcription factor that is required for the differentiation of T lymphocytes into the pro-inflammatory Th1 cell lineage,31 and the ratio of T-bet to GATA-3 within the T helper cell governs its development toward the Th1 versus Th2 lineage, respectively.32 In the current model, we find elevated ratios of T-bet versus GATA-3 expression in the CD4+ T lymphocytes from our Ang II-infused T cell KO mice but similar T-bet/GATA-3 ratios in T cell WT and KO CD4 cells following saline infusion, supporting the notion that chronic activation of AT1 receptors on T lymphocytes constrains their differentiation toward the Th1 subset in our model. As the regulation of T-bet within the T cell is poorly understood, this finding uncovers a novel mechanism underlying the selection of T helper cell phenotypes during chronic kidney damage. Secondly, we considered the possibility that the initial blunted response of naïve AT1 receptor-deficient T cells to acute activation insulates them from the exhaustion that arises in T cells subjected to persistent activation43, allowing the T cell KO lymphocytes to generate high levels of cytokine even after chronic stimulation in vivo. However, we were not able to confirm that the AT1 receptor on T cells influences their susceptibility to exhaustion in our chronic disease model, at least via a PD-1-dependent pathway. Thirdly, we have previously demonstrated that AT1 receptors on T cells are required to drive cytoskeletal rearrangements necessary to recruit T cell signaling molecules into the immunological synapse36, 44, so we postulated that expression of signaling molecules might be dysregulated in the T lymphocytes from our Ang II-infused T cell KO animals. Indeed, microarray analysis revealed abnormal expression of key signaling molecules in T cell KO CD4+ cells including another Th1 transcription factor STAT4 but also enhanced expression of CXCR3, a receptor on Th1 cells that guides their infiltration into damaged tissues.45 While these data will require confirmation and further exploration in future studies, they suggest that, in conjunction with the increased CCL5 expression mentioned above, enhanced CXCR3 expression on T cells lacking AT1 receptors facilitates accumulation of proinflammatory Th1 cells in the kidney during hypertension.
As AT1 receptor-deficiency on T cells leads to an enhanced Th1 immune response and exaggerated hypertensive kidney damage, we sought to determine directly whether the Th1 response contributes to renal injury in the setting of blood pressure elevation. We therefore subjected T-bet deficient mice that cannot mount a Th1 response to our hypertension model and measured parameters of renal damage. We find that the Th1 response does not influence the chronic hypertensive response to Ang II. As global T cell deficiency causes a muted hypertensive response in other studies,5, 6 our data suggest that actions of T lymphocyte populations other than CD4+ Th1 cells, such as CD8+ T cells28, influenced blood pressure levels in those experiments. Nevertheless, in the current studies T-bet deficiency affords significant protection to the kidney, particularly within the glomerular compartment. Collectively, the Th1 response is known to shape the injury response in immune-mediated crescentic glomerulonephritis.46 To our knowledge, however, the current experiments are the first to indicate that the Th1 immune response, potentiated by AT1 receptor-deficiency on T cells, plays a major role in driving renal injury in hypertension.
One direct consequence of inflammatory cell infiltration into the kidney is the local generation of cytokines which may in turn influence the course and pattern of kidney damage. Accordingly, we found that IFN-γ and TNF-α were upregulated in the kidneys from the T cell KO group manifesting an exaggerated Th1 response and conversely downregulated in the kidneys from T-bet deficient mice lacking a Th1 response. IFN-γ and TNF-α are known to directly mediate kidney injury, particularly to the kidney glomerulus, in several models.4, 27, 47 We therefore submit that the mononuclear cells infiltrating the kidney in our model similarly contribute to renal injury via the direct actions of inflammatory cytokines on kidney cells independently of any effects these cytokines may have on blood pressure in other models,48 particularly as the exaggeration of glomerular damage in the T cell KO kidneys and the protection from hypertensive renal injury in our T-bet KO mice was associated with a preserved hypertensive response to Ang II.
In summary, the current experiments demonstrate a paradoxical role for AT1 receptors on T lymphocytes to protect the kidney in the setting of chronic hypertension by constraining their propensity to propagate the pro-inflammatory Th1 response. We further show that this Th1 response directly mediates hypertensive renal damage. Thus, the actions of AT1 receptors on T cells to limit injury during hypertension may represent a negative feedback mechanism counteracting the broad pro-hypertensive and pro-inflammatory effects of global RAS activation. The wide use of AT1 receptor blockers in the setting of cardiovascular and renal disease makes our findings widely relevant to clinical medicine. Blocking AT1 receptor signals directly within the kidney clearly ameliorates hypertension and the resulting injury to the heart and kidney.22, 49 However, the current studies suggest that preserving or even stimulating AT1 receptor signaling pathways in T lymphocytes could provide important additional protection for the kidney during hypertension, and thus uncovers the potential for a novel therapeutic maneuver to suppress the renin angiotensin system in renal and cardiovascular tissues while concomitantly preserving or even enhancing AT1 receptor-mediated signals within the immune system. Such an approach may yield even greater benefits in hypertension than the current strategy of globalized angiotensin receptor blockade.
Supplementary Material
Novelty and Significance.
What Is known?
Activation of type 1 angiotensin (AT1) receptors in the kidney drives blood pressure elevation and the ensuing damage to the kidney and the heart.
T lymphocytes express AT1 receptors and contribute to blood pressure elevation and tissue injury in hypertension.
Global inhibition of AT1 receptors with angiotensin receptor blockers (ARBs) lowers blood pressure and slows the progression of kidney disease in hypertensive patients.
What New Information Does This Article Contribute?
T cell-specific deletion of the AT1 receptor potentiates kidney damage in the setting of angiotensin II-induced hypertension through a blood pressure-independent mechanism.
In the setting of hypertension, activation of AT1 receptors on T lymphocytes limits their differentiation toward the pro-inflammatory Th1 lineage and thereby constrains T cell production of cytokines and chemokines that contribute to renal inflammation.
Mice lacking Th1 immune responses are protected from damage to the kidney glomerulus during angiotensin II-dependent hypertension.
Despite evidence from large-scale clinical trials showing that global blockade of AT1 receptors ameliorates target organ damage in hypertension, the precise contribution of AT1 receptors on T lymphocytes to the pathogenesis of hypertension remains unclear. In the current study, we found that deleting AT1 receptors selectively from T cells in mice (T cell KO) does not alter the chronic hypertensive response to angiotensin II infusion. However, T cell KO mice display exaggerated kidney injury in angiotensin-induced hypertension, with enhanced infiltration of T lymphocytes into the kidney. Moreover, AT1 receptor-deficient T cells infiltrating the kidney manifest exaggerated pro-inflammatory Th1 immune responses, which directly mediate damage to the kidney glomerulus. These findings reveal a paradoxical role for AT1 receptors of T lymphocytes in limiting kidney damage during chronic hypertension by constraining the propensity of T cells to propagate Th1 immune responses. Thus, preserving or even stimulating AT1 receptor-mediated responses of T lymphocytes might protect against renal injury during chronic hypertension.
Acknowledgements
The authors acknowledge outstanding administrative support from Ms. Norma Barrow and critical review of scientific content from Dr. Mary Foster.
Sources of Funding This work was supported by funding from National Institutes of Health Grant DK087893-01, the Medical Research Service of the Veterans Administration, and by the Edna and Fred L. Mandel Center for Hypertension and Atherosclerosis Research.
Non-standard Abbreviations and Acronyms
- CKD
chronic kidney disease
- AT1
type 1 angiotensin
- ARB
type 1 angiotensin receptor blocker
- Ang
angiotensin
- IFN
interferon
- TNF
tumor necrosis factor
- TGF
transforming growth factor
- IL-1
interleukin-1
- IL-4
interleukin-4
- MCP-1
monocyte chemoattractant protein 1
- CCL5
regulated on activation, normal T expressed and secreted
- NGAL
neutrophil gelatinase-associated lipocalin
Footnotes
Disclosures None.
Publisher's Disclaimer: This is a PDF file of an unedited manuscript that has been accepted for publication. As a service to our customers we are providing this early version of the manuscript. The manuscript will undergo copyediting, typesetting, and review of the resulting proof before it is published in its final citable form. Please note that during the production process errors may be discovered which could affect the content, and all legal disclaimers that apply to the journal pertain.
REFERENCES
- 1.Lewington S, Clarke R, Qizilbash N, Peto R, Collins R. Age-specific relevance of usual blood pressure to vascular mortality: A meta-analysis of individual data for one million adults in 61 prospective studies. Lancet. 2002;360:1903–1913. doi: 10.1016/s0140-6736(02)11911-8. [DOI] [PubMed] [Google Scholar]
- 2.Dahlof B, Devereux RB, Kjeldsen SE, Julius S, Beevers G, de Faire U, Fyhrquist F, Ibsen H, Kristiansson K, Lederballe-Pedersen O, Lindholm LH, Nieminen MS, Omvik P, Oparil S, Wedel H. Cardiovascular morbidity and mortality in the losartan intervention for endpoint reduction in hypertension study (life): A randomised trial against atenolol. Lancet. 2002;359:995–1003. doi: 10.1016/S0140-6736(02)08089-3. [DOI] [PubMed] [Google Scholar]
- 3.Brenner BM, Cooper ME, de Zeeuw D, Keane WF, Mitch WE, Parving HH, Remuzzi G, Snapinn SM, Zhang Z, Shahinfar S. Effects of losartan on renal and cardiovascular outcomes in patients with type 2 diabetes and nephropathy. N Engl J Med. 2001;345:861–869. doi: 10.1056/NEJMoa011161. [DOI] [PubMed] [Google Scholar]
- 4.Muller DN, Shagdarsuren E, Park JK, Dechend R, Mervaala E, Hampich F, Fiebeler A, Ju X, Finckenberg P, Theuer J, Viedt C, Kreuzer J, Heidecke H, Haller H, Zenke M, Luft FC. Immunosuppressive treatment protects against angiotensin ii-induced renal damage. Am J Pathol. 2002;161:1679–1693. doi: 10.1016/S0002-9440(10)64445-8. [DOI] [PMC free article] [PubMed] [Google Scholar]
- 5.Guzik TJ, Hoch NE, Brown KA, McCann LA, Rahman A, Dikalov S, Goronzy J, Weyand C, Harrison DG. Role of the t cell in the genesis of angiotensin ii induced hypertension and vascular dysfunction. J Exp Med. 2007;204:2449–2460. doi: 10.1084/jem.20070657. [DOI] [PMC free article] [PubMed] [Google Scholar]
- 6.Crowley SD, Song Y-S, Lin EE, Griffiths R, Kim H-S, Ruiz P. Lymphocyte responses exacerbate angiotensin ii-dependent hypertension. Am J Physiol Regul Integr Comp Physiol. 2010;298:R1089–1097. doi: 10.1152/ajpregu.00373.2009. [DOI] [PMC free article] [PubMed] [Google Scholar]
- 7.Hisada Y, Sugaya T, Tanaka S, Suzuki Y, Ra C, Kimura K, Fukamizu A. An essential role of angiotensin ii receptor type 1a in recipient kidney, not in transplanted peripheral blood leukocytes, in progressive immune-mediated renal injury. Lab Invest. 2001;81:1243–1251. doi: 10.1038/labinvest.3780338. [DOI] [PubMed] [Google Scholar]
- 8.Nishida M, Fujinaka H, Matsusaka T, Price J, Kon V, Fogo AB, Davidson JM, Linton MF, Fazio S, Homma T, Yoshida H, Ichikawa I. Absence of angiotensin ii type 1 receptor in bone marrow-derived cells is detrimental in the evolution of renal fibrosis. J Clin Invest. 2002;110:1859–1868. doi: 10.1172/JCI200215045. [DOI] [PMC free article] [PubMed] [Google Scholar]
- 9.Kato H, Ishida J, Nagano K, Honjo K, Sugaya T, Takeda N, Sugiyama F, Yagami K, Fujita T, Nangaku M, Fukamizu A. Deterioration of atherosclerosis in mice lacking angiotensin ii type 1a receptor in bone marrow-derived cells. Lab Invest. 2008;88:731–739. doi: 10.1038/labinvest.2008.42. [DOI] [PubMed] [Google Scholar]
- 10.Lu H, Rateri DL, Feldman DL, RJ, Fukamizu A, Ishida J, Oesterling EG, Cassis LA, Daugherty A. Renin inhibition reduces hypercholesterolemia-induced atherosclerosis in mice. J Clin Invest. 2008;118:984–993. doi: 10.1172/JCI32970. [DOI] [PMC free article] [PubMed] [Google Scholar]
- 11.Kuin A, Kruse JJ, Stewart FA. Proteinuria and vascular changes after renal irradiation: The role of reactive oxygen species (ros) and vascular endothelial growth factor (vegf) Radiat Res. 2003;159:174–181. doi: 10.1667/0033-7587(2003)159[0174:pavcar]2.0.co;2. [DOI] [PubMed] [Google Scholar]
- 12.Ehninger A, Trumpp A. The bone marrow stem cell niche grows up: Mesenchymal stem cells and macrophages move in. J Exp Med. 2011;208:421–428. doi: 10.1084/jem.20110132. [DOI] [PMC free article] [PubMed] [Google Scholar]
- 13.Nataraj C, Oliverio MI, Mannon RB, Mannon PJ, Audoly LP, Amuchastegui CS, Ruiz P, Smithies O, Coffman TM. Angiotensin ii regulates cellular immune responses through a calcineurin-dependent pathway. J Clin Invest. 1999;104:1693–1701. doi: 10.1172/JCI7451. [DOI] [PMC free article] [PubMed] [Google Scholar]
- 14.Gurley SB, Riquier-Brison AD, Schnermann J, Sparks MA, Allen AM, Haase VH, Snouwaert JN, Le TH, McDonough AA, Koller BH, Coffman TM. At(1a) angiotensin receptors in the renal proximal tubule regulate blood pressure. Cell Metab. 2011;13:469–475. doi: 10.1016/j.cmet.2011.03.001. [DOI] [PMC free article] [PubMed] [Google Scholar]
- 15.Lee PP, Fitzpatrick DR, Beard C, Jessup HK, Lehar S, Makar KW, Perez-Melgosa M, Sweetser MT, Schlissel MS, Nguyen S, Cherry SR, Tsai JH, Tucker SM, Weaver WM, Kelso A, Jaenisch R, Wilson CB. A critical role for dnmt1 and DNA methylation in t cell development, function, and survival. Immunity. 2001;15:763–774. doi: 10.1016/s1074-7613(01)00227-8. [DOI] [PubMed] [Google Scholar]
- 16.Muzumdar MD, Tasic B, Miyamichi K, Li L, Luo L. A global double-fluorescent cre reporter mouse. Genesis. 2007;45:593–605. doi: 10.1002/dvg.20335. [DOI] [PubMed] [Google Scholar]
- 17.Crowley SD, Gurley SB, Oliverio MI, Pazmino AK, Griffiths R, Flannery PJ, Spurney RF, Kim HS, Smithies O, Le TH, Coffman TM. Distinct roles for the kidney and systemic tissues in blood pressure regulation by the renin-angiotensin system. J Clin Invest. 2005;115:1092–1099. doi: 10.1172/JCI200523378. [DOI] [PMC free article] [PubMed] [Google Scholar]
- 18.Wang L, Chang JH, Paik SY, Tang Y, Eisner W, Spurney RF. Calcineurin (cn) activation promotes apoptosis of glomerular podocytes both in vitro and in vivo. Mol Endocrinol. 2011;25:1376–1386. doi: 10.1210/me.2011-0029. [DOI] [PMC free article] [PubMed] [Google Scholar]
- 19.Mannon RB, Kotzin BL, Nataraj C, Ferri K, Roper E, Kurlander RJ, Coffman TM. Downregulation of t cell receptor expression by cd8(+) lymphocytes in kidney allografts. J Clin Invest. 1998;101:2517–2527. doi: 10.1172/JCI1229. [DOI] [PMC free article] [PubMed] [Google Scholar]
- 20.Crowley SD, Vasievich MP, Ruiz P, Gould SK, Parsons KK, Pazmino AK, Facemire C, Chen BJ, Kim HS, Tran TT, Pisetsky DS, Barisoni L, Prieto-Carrasquero MC, Jeansson M, Foster MH, Coffman TM. Glomerular type 1 angiotensin receptors augment kidney injury and inflammation in murine autoimmune nephritis. J Clin Invest. 2009;119:943–953. doi: 10.1172/JCI34862. [DOI] [PMC free article] [PubMed] [Google Scholar]
- 21.Lautrette A, Li S, Alili R, Sunnarborg SW, Burtin M, Lee DC, Friedlander G, Terzi F. Angiotensin ii and egf receptor cross-talk in chronic kidney diseases: A new therapeutic approach. Nat Med. 2005;11:867–874. doi: 10.1038/nm1275. [DOI] [PubMed] [Google Scholar]
- 22.Crowley SD, Gurley SB, Herrera MJ, Ruiz P, Griffiths R, Kumar AP, Kim HS, Smithies O, Le TH, Coffman TM. Angiotensin ii causes hypertension and cardiac hypertrophy through its receptors in the kidney. Proc Natl Acad Sci U S A. 2006;103:17985–17990. doi: 10.1073/pnas.0605545103. [DOI] [PMC free article] [PubMed] [Google Scholar]
- 23.De Miguel C, Das S, Lund H, Mattson DL. T lymphocytes mediate hypertension and kidney damage in dahl salt-sensitive rats. Am J Physiol Regul Integr Comp Physiol. 2010;298:R1136–1142. doi: 10.1152/ajpregu.00298.2009. [DOI] [PMC free article] [PubMed] [Google Scholar]
- 24.Paragas N, Qiu A, Zhang Q, Samstein B, Deng SX, Schmidt-Ott KM, Viltard M, Yu W, Forster CS, Gong G, Liu Y, Kulkarni R, Mori K, Kalandadze A, Ratner AJ, Devarajan P, Landry DW, D'Agati V, Lin CS, Barasch J. The ngal reporter mouse detects the response of the kidney to injury in real time. Nat Med. 2011;17:216–222. doi: 10.1038/nm.2290. [DOI] [PMC free article] [PubMed] [Google Scholar]
- 25.Ozawa Y, Kobori H, Suzaki Y, Navar LG. Sustained renal interstitial macrophage infiltration following chronic angiotensin ii infusions. Am J Physiol Renal Physiol. 2007;292:F330–339. doi: 10.1152/ajprenal.00059.2006. [DOI] [PMC free article] [PubMed] [Google Scholar]
- 26.Ramesh G, Reeves WB. Tnf-{alpha} mediates chemokine and cytokine expression and renal injury in cisplatin nephrotoxicity. J. Clin. Invest. 2002;110:835–842. doi: 10.1172/JCI15606. [DOI] [PMC free article] [PubMed] [Google Scholar]
- 27.Balomenos D, Rumold R, Theofilopoulos AN. Interferon-gamma is required for lupus-like disease and lymphoaccumulation in mrl-lpr mice. J. Clin. Invest. 1998;101:364–371. doi: 10.1172/JCI750. [DOI] [PMC free article] [PubMed] [Google Scholar]
- 28.Thabet SR, Wu J, Chen W, Marvar PJ, Gongora MC, Madhur MS, Blinder Y, Weyand C, Harrison DG. The role of cd8+ t cells, ip-10 and mmp12 in hypertension. Hypertension. 2011;58:e49. Abstract. [Google Scholar]
- 29.Liao TD, Yang XP, Liu YH, Shesely EG, Cavasin MA, Kuziel WA, Pagano PJ, Carretero OA. Role of inflammation in the development of renal damage and dysfunction in angiotensin ii-induced hypertension. Hypertension. 2008;52:256–263. doi: 10.1161/HYPERTENSIONAHA.108.112706. [DOI] [PMC free article] [PubMed] [Google Scholar]
- 30.Rudolph EH, Congdon KL, Sackey FN, Fitzsimons MM, Foster MH. Humoral autoimmunity to basement membrane antigens is regulated in c57bl/6 and mrl/mpj mice transgenic for anti-laminin ig receptors. J Immunol. 2002;168:5943–5953. doi: 10.4049/jimmunol.168.11.5943. [DOI] [PubMed] [Google Scholar]
- 31.Szabo SJ, Kim ST, Costa GL, Zhang X, Fathman CG, Glimcher LH. A novel transcription factor, t-bet, directs th1 lineage commitment. Cell. 2000;100:655–669. doi: 10.1016/s0092-8674(00)80702-3. [DOI] [PubMed] [Google Scholar]
- 32.Chakir H, Wang H, Lefebvre DE, Webb J, Scott FW. T-bet/gata-3 ratio as a measure of the th1/th2 cytokine profile in mixed cell populations: Predominant role of gata-3. J Immunol Methods. 2003;278:157–169. doi: 10.1016/s0022-1759(03)00200-x. [DOI] [PubMed] [Google Scholar]
- 33.Sun Q, Cheng D, Zhang M, He Q, Chen Z, Liu Z. Predominance of intraglomerular t-bet or gata3 may determine mechanism of transplant rejection. J Am Soc Nephrol. 2011;22:246–252. doi: 10.1681/ASN.2010050471. [DOI] [PMC free article] [PubMed] [Google Scholar]
- 34.Fourcade J, Sun Z, Benallaoua M, Guillaume P, Luescher IF, Sander C, Kirkwood JM, Kuchroo V, Zarour HM. Upregulation of tim-3 and pd-1 expression is associated with tumor antigen-specific cd8+ t cell dysfunction in melanoma patients. J Exp Med. 2010;207:2175–2186. doi: 10.1084/jem.20100637. [DOI] [PMC free article] [PubMed] [Google Scholar]
- 35.Hoch NE, Guzik TJ, Chen W, Deans T, Maalouf SA, Gratze P, Weyand C, Harrison DG. Regulation of t-cell function by endogenously produced angiotensin ii. Am J Physiol Regul Integr Comp Physiol. 2009;296:R208–216. doi: 10.1152/ajpregu.90521.2008. [DOI] [PMC free article] [PubMed] [Google Scholar]
- 36.Crowley SD, Frey CW, Gould SK, Griffiths R, Ruiz P, Burchette JL, Howell DN, Makhanova N, Yan M, Kim H-S, Tharaux P-L, Coffman TM. Stimulation of lymphocyte responses by angiotensin ii promotes kidney injury in hypertension. Am J Physiol Renal Physiol. 2008;295:F515–524. doi: 10.1152/ajprenal.00527.2007. [DOI] [PMC free article] [PubMed] [Google Scholar]
- 37.Crowley SD, Song YS, Sprung G, Griffiths R, Sparks M, Yan M, Burchette JL, Howell DN, Lin EE, Okeiyi B, Stegbauer J, Yang Y, Tharaux PL, Ruiz P. A role for angiotensin ii type 1 receptors on bone marrow-derived cells in the pathogenesis of angiotensin ii-dependent hypertension. Hypertension. 2010;55:99–108. doi: 10.1161/HYPERTENSIONAHA.109.144964. [DOI] [PMC free article] [PubMed] [Google Scholar]
- 38.Nahmod KA, Geffner JR, Walther T. Angiotensin ii type 1a-deficient bone marrow-derived dendritic cells produce higher levels of monocyte chemoattractant protein 1. Hypertension. 2010;56:e6–7. doi: 10.1161/HYPERTENSIONAHA.110.153205. author reply e8. [DOI] [PubMed] [Google Scholar]
- 39.Gerstein HC, Mann JF, Yi Q, Zinman B, Dinneen SF, Hoogwerf B, Halle JP, Young J, Rashkow A, Joyce C, Nawaz S, Yusuf S. Albuminuria and risk of cardiovascular events, death, and heart failure in diabetic and nondiabetic individuals. JAMA. 2001;286:421–426. doi: 10.1001/jama.286.4.421. [DOI] [PubMed] [Google Scholar]
- 40.Bolignano D, Lacquaniti A, Coppolino G, Donato V, Campo S, Fazio MR, Nicocia G, Buemi M. Neutrophil gelatinase-associated lipocalin (ngal) and progression of chronic kidney disease. Clin J Am Soc Nephrol. 2009;4:337–344. doi: 10.2215/CJN.03530708. [DOI] [PMC free article] [PubMed] [Google Scholar]
- 41.Eddy AA. Progression in chronic kidney disease. Adv Chronic Kidney Dis. 2005;12:353–365. doi: 10.1053/j.ackd.2005.07.011. [DOI] [PubMed] [Google Scholar]
- 42.Strom TB, Koulmanda M. Recently discovered t cell subsets cannot keep their commitments. J Am Soc Nephrol. 2009;20:1677–1680. doi: 10.1681/ASN.2008101027. [DOI] [PubMed] [Google Scholar]
- 43.Wherry EJ. T cell exhaustion. Nat Immunol. 2011;12:492–499. doi: 10.1038/ni.2035. [DOI] [PubMed] [Google Scholar]
- 44.Mitchell JS, Kanca O, McIntyre BW. Lipid microdomain clustering induces a redistribution of antigen recognition and adhesion molecules on human t lymphocytes. J Immunol. 2002;168:2737–2744. doi: 10.4049/jimmunol.168.6.2737. [DOI] [PubMed] [Google Scholar]
- 45.Qin S, Rottman JB, Myers P, Kassam N, Weinblatt M, Loetscher M, Koch AE, Moser B, Mackay CR. The chemokine receptors cxcr3 and ccr5 mark subsets of t cells associated with certain inflammatory reactions. J Clin Invest. 1998;101:746–754. doi: 10.1172/JCI1422. [DOI] [PMC free article] [PubMed] [Google Scholar]
- 46.Phoon RK, Kitching AR, Odobasic D, Jones LK, Semple TJ, Holdsworth SR. T-bet deficiency attenuates renal injury in experimental crescentic glomerulonephritis. J Am Soc Nephrol. 2008;19:477–485. doi: 10.1681/ASN.2007030392. [DOI] [PMC free article] [PubMed] [Google Scholar]
- 47.Bertani T, Abbate M, Zoja C, Corna D, Perico N, Ghezzi P, Remuzzi G. Tumor necrosis factor induces glomerular damage in the rabbit. Am J Pathol. 1989;134:419–430. [PMC free article] [PubMed] [Google Scholar]
- 48.Sriramula S, Haque M, Majid DSA, Francis J. Involvement of tumor necrosis factor-{alpha} in angiotensin ii-mediated effects on salt appetite, hypertension, and cardiac hypertrophy. Hypertension. 2008;51:1345–1351. doi: 10.1161/HYPERTENSIONAHA.107.102152. [DOI] [PMC free article] [PubMed] [Google Scholar]
- 49.Crowley SD, Zhang J, Herrera M, Griffiths R, Ruiz P, Coffman TM. Role of at1 receptor-mediated salt retention in angiotensin ii-dependent hypertension. Am J Physiol Renal Physiol. 2011;301:F1124–1130. doi: 10.1152/ajprenal.00305.2011. [DOI] [PMC free article] [PubMed] [Google Scholar]
Associated Data
This section collects any data citations, data availability statements, or supplementary materials included in this article.


