

Abstract
An epithelial–mesenchymal transformation (EMT) involves alterations in cell–cell and cell–matrix adhesion, the detachment of epithelial cells from their neighbors, the degradation of the basal lamina and acquisition of mesenchymal phenotype. Here we present Monte Carlo simulations for a specific EMT in early heart development: the formation of cardiac cushions. Cell rearrangements are described in accordance with Steinberg’s differential adhesion hypothesis, which states that cells possess a type-dependent adhesion apparatus and are sufficiently motile to give rise to the tissue conformation with the largest number of strong bonds. We also implement epithelial and mesenchymal cell proliferation, cell type change and extracellular matrix production by mesenchymal cells. Our results show that an EMT is promoted more efficiently by an increase in cell–substrate adhesion than by a decrease in cell–cell adhesion. In addition to cushion tissue formation, the model also accounts for the phenomena of matrix invasion and mesenchymal condensation. We conclude that in order to maintain epithelial integrity during EMT the number of epithelial cells must increase at a controlled rate. Our model predictions are in qualitative agreement with available experimental data.
Keywords: Differential adhesion hypothesis, Self-assembly, Cushion tissue, Monte Carlo simulation
1. Introduction
The term epithelial–mesenchymal transformation (EMT) refers to the phenomenon in which cells undergo a transition from epithelial to mesenchymal phenotype. EMT involves the detachment of certain epithelial cells from their neighbors, the degradation of the underlying basal lamina, and active migration into the adjacent extracellular matrix (ECM). EMTs are important both in embryonic morphogenesis (Hay, 2005; Markwald et al., 1996), as well as in the adult organism, often in pathological processes (Arciniegas et al., 2007; Lee et al., 2006; O’Riordan et al., 2007; Thiery, 2003; Zeisberg et al., 2007a,b).
EMT represents the interplay of biochemical and biophysical processes. Signaling pathways elicit alterations in the expression of cell–cell and cell–matrix adhesion molecules. These alterations eventually manifest in changes in cell morphology and invasive motility–a defining trait of mesenchymal cells (Hay, 2005). Our focus in this study is modeling the biophysical aspects of EMT on the basis of tissue liquidity.
In this work, we discuss an EMT that is specific to early heart development (Butcher et al., 2007; Camenisch et al., 2008; Markwald et al., 1996, 1990; Wessels and Sedmera, 2003). The primitive heart tube consists of three distinct layers: (i) an external epithelial lining of muscle (myocardium), (ii) an internal endothelial cell lining (endocardium) and (iii) an ECM (cardiac jelly) sandwiched in between. Immediately following looping of the primitive heart tube, regional, myocardium-driven expansion of the cardiac jelly occurs to initiate endocardial cushion morphogenesis, which eventually is completed via an EMT. This process occurs initially in the atrioventricular (AV) canal and results in pairs of major and minor (or lateral) cushions, with members of the pairs at diametrically opposite sides of heart tube (Fig. 1). First, the two major cushions appear and grow towards each other. Upon contact these cushions act as valves, and promote unidirectional blood flow even before they become fully mesenchymalized (Fig. 1). With further development the two major cushion masses fuse to form the AV septum intermedium that separates the common AV canal into a right-sided tricuspid orifice and left-sided, mitral orifice (Fig. 1). The lateral cushions whose development lags behind the major cushions contribute to the mural leaflets of the mitral and tricuspid valves (Eisenberg and Markwald, 1995). Once these structures are in place, the formation of the four-chambered heart is complete.
Fig. 1.

Cushion tissue morphogenesis. Top. Schematic illustration of the development of cardiac cushions from the primitive heart tube (left) until the formation of the AV septum and appearance of the lateral cushions. Bottom. The in vivo process in the chick, shown by nuclear staining with propidium iodide and observed by confocal microscopy. The fluorescence image was colorized to show the different tissues in the AV region. The three panels correspond to Hamburger–Hamilton (HH) developmental stages 16 (left), 18 (middle) and 20 (right) (Hamburger and Hamilton, 1951). The figures show the AV canal (light gray and black, respectively in the top and bottom panel), the myocardium (red), endocardium (blue), the cardiac jelly (dark gray on top, not shown in the bottom) and extracellular matrix producing mesenchymal cells (green) as the result of EMT. (For interpretation of the references to color in this figure caption, the reader is referred to the web version of the article.)
The molecular regulation of EMT in cardiac cushions is complex (Armstrong and Bischoff, 2004; Camenisch et al., 2008; Person et al., 2005; Schroeder et al., 2003). In vitro cultures of cushion tissue explants on collagen substrates revealed that the regional localization of EMT hinges on endothelial competence and on molecules secreted by the myocardium (Eisenberg and Markwald, 1995): mesenchymal cells emerged only when both the endothelium and the myocardium were harvested from the cushion-forming regions of the embryonic heart (Mjaatvedt and Markwald, 1989). The growth of the cushion mesenchyme depends on the orchestrated expression of fibroblast growth factor FGF-4, a potent mitogen, and of its receptors (FGFR1–3) (Sugi et al., 2003). While FGF-4 has been detected throughout the heart, the expression of some FGF receptors was spatially restricted: FGFR2 was expressed only by mesenchymal cells, whereas FGFR3 was expressed only by AV endocardial endothelial cells overlying the cushions. There is evidence that FGFR3 assures that the growth of the endocardium is commensurate with the growth of the cushion (Sugi et al., 2003). Cushion development and ECM remodeling also depend on a T-box transcription factor, Tbx20, which promotes mesenchymal cell proliferation and enhances matrix metalloproteinase (MMP) expression (Shelton and Yutzey, 2007). In turn, MMPs enable mesenchymal cells to migrate and reorganize the ECM.
Due to the complexity of biological regulatory mechanisms, understanding the behavior of large interacting cell populations, such as in the cardiac cushions, and their morphogenetic transformations, such as EMT, necessitates computational modeling. There is growing interest in developing in silico models of in vivo and In vitro morphogenesis (Galle et al., 2005; Grant et al., 2006; Lao and Kamei, 2008; Neagu et al., 2005; Newman, 2005; Ramis-Conde et al., 2008; Schaller and Meyer-Hermann, 2007).
The main objective of the present work is to construct a computational model of EMT-driven rearrangements of cells during cardiac cushion tissue formation. Early computer simulations, although limited by computer power, pointed to important factors involved in cushion tissue morphogenesis, such as cell migration, cell division, cell adhesion, and stochastic events (Kurnit et al., 1985). Nevertheless, to our knowledge, EMT-related changes in cell adhesion and type were not considered in earlier computational studies.
We propose a model of EMT to describe the mesenchymalization of cushion tissues that combines some of the ideas put forward by Kurnit et al. (1985) with Steinberg’s differential adhesion hypothesis (DAH), an established early developmental morphogenetic mechanism. The DAH states that cells possess type-dependent adhesion apparatus and take advantage of their motility to minimize the total adhesive energy of the tissue (Foty and Steinberg, 2005; Steinberg, 1963). A corollary of DAH is tissue liquidity, a concept that expresses the apparent analogy between embryonic tissues and highly viscous liquids (Steinberg, 2007). Tissue liquidity implies that embryonic tissues can be characterized by effective surface tension. Defined In vitro, the effective surface tension is the free energy of the unit area of interface between the tissue and cell culture medium (Foty et al., 1994). The surface tension of a cell population composed of a single cell type is proportional to the strength of adhesion between the constituent cells (Forgacs et al., 1998), and may be used to predict cell sorting patterns: in a random mixture of two cell populations, segregation results in a configuration in which the more adhesive population is surrounded by the less adhesive one (Foty et al., 1996).
The DAH has inspired numerous theoretical models of structure formation. Monte Carlo simulations, based on the Potts model known from statistical physics, successfully described cell sorting and the mutual engulfment of contiguous tissue fragments (Graner and Glazier, 1992). These simulations also suggested that cell motility may be ascribed to an effective, temperature-like parameter (Beysens et al., 2000; Mombach et al., 1995).
We have recently set up a three-dimensional lattice model with some features akin to the model of Glazier and Graner, (Jakab et al., 2006, 2004; Neagu et al., 2005). Here we extend the model to demonstrate that EMT and cushion tissue formation may be driven by the competition of cell–cell and cell–ECM interactions, similarly to tumor invasion (Gerisch and Chaplain, 2008; Hegedus et al., 2006). The proposed model incorporates differential adhesion, EMT, cell proliferation and matrix production by mesenchymal cells. The aim of our study is not a detailed description of cushion tissue formation; rather we seek to identify the essential elements of this process and study their interplay using in silico experiments. To our knowledge, this is the first attempt to model cardiac cushion tissue formation by taking into account EMT.
2. Preliminaries
2.1. Lattice representation
Consider a planar fragment of an endocardium (i.e. endothelial cell layer) separating the cardiac jelly (i.e. ECM) from the lumen of the primitive heart tube (i.e. medium). The myocardium will not be included explicitly in our model. Its effect is incorporated through the ECM, which is assumed to contain the myocardium-produced signaling molecules that promote EMT.
We represent cells, and similar-sized volume elements of medium and ECM, as particles on a simple cubic lattice. Particle type is specified by an integer (Graner and Glazier, 1992): σ = 1 for medium (type M), σ = 2 for ECM (type ECM), σ = 3 for endothelial cells (type EC) and σ = 4 for mesenchymal cells (type MC). Interactions are described in terms of bonds, defined by the works of cohesion (εσ,σ), and adhesion (εσ,σ’, with σ ≠ σ’), defined as the mechanical work needed to separate two particles of the same and different type, respectively. (The stronger is the interaction between σ and σ’, the larger is εσ,σ’.) The total interaction energy of the system is written as (Neagu et al., 2006).
| (1) |
where the first term represents the interfacial part of the total energy of adhesion, and the second term describes the adhesive energy of particles of the same type. Furthermore, Nσ,σ’ denotes the total number of bonds between particles of type σ and σ’ (σ ≠ σ’), nn is the number of neighbors that interact with a given particle, and γσ,σ’ = (εσ,σ + εσ’,σ’ )/2 – εσ,σ’ is the interfacial tension between the population of particles of type σ and σ’. In order to minimize the anisotropy of the model tissue, we consider interactions (bonds) of the same magnitude between nearest, next-nearest and secondnearest neighbors (i.e. nn = 26). In what follows we refer to this set of sites as the vicinity of a given site. The numbers of particles, Nσ (σ ∈ {1, 2, 3, 4 } ), vary due to changes in cell number (i.e. endothelial cells transform into mesenchymal cells) and ECM production.
Since our model system comprises four types of particles, it is described by 10 distinct ε s (works of adhesion and cohesion), which give rise to six interfacial tension parameters (see Table 1).
Table 1.
The works of adhesion (εσ,σ’ ) and interfacial tension parameters (γσ,σ’ ) used in the simulations, expressed in units of the energy of biological fluctuations, ET. The works of adhesion that involve the medium from the apical side of the epithelium were set to zero (εM, M = εM,ECM = εM, EC = εM,MC = 0).
| Set | ε ECM,ECM | ε EC, EC | ε MC,MC | ε ECM, EC | ε ECM,MC | ε EC,MC | γ M,ECM | γ M, EC | γ M,MC | γ ECM, EC | γ ECM,MC | γ EC,MC |
|---|---|---|---|---|---|---|---|---|---|---|---|---|
| 1 | 1 | 1 | 4 | 0.5 | 1.75 | 0.5 | 0.5 | 0.5 | 2 | 0.5 | 0.75 | 2 |
| 2 | 4 | 1 | 4 | 2 | 3.25 | 0.5 | 2 | 0.5 | 2 | 0.5 | 0.75 | 2 |
| 3 | 4 | 1 | 4 | 2 | 4.50 | 0.5 | 2 | 0.5 | 2 | 0.5 | −0.5 | 2 |
| 4 | 4 | 1.2 | 4 | 2 | 4.50 | 0.6 | 2 | 0.6 | 2 | 0.6 | −0.5 | 2 |
| 5 | 4 | 1.2 | 4 | 2 | 3.25 | 0.6 | 2 | 0.6 | 2 | 0.6 | 0.75 | 2 |
| 6 | 4 | 1.2 | 4 | 2 | 2 | 0.6 | 2 | 0.6 | 2 | 0.6 | 2 | 2 |
| 7 | 1 | 1.2 | 4 | 0.5 | 1.75 | 0.6 | 0.5 | 0.6 | 2 | 0.6 | 0.75 | 2 |
2.2. Computational algorithm
According to DAH, morphogenetic changes involve cell displacements leading to configurations of lowest energy and thus the largest possible number of strong bonds (Steinberg, 1963, 1996). This process can conveniently be simulated by the Metropolis algorithm (Amar, 2006; Metropolis et al., 1953), which yields the lowest energy conformation of an interacting particle system through successively lower energy states resulting from the random displacements of the particles (e.g. cells) referred to as elementary events. This approach provided an accurate description of cell sorting (Glazier and Graner, 1993; Graner and Glazier, 1992).
In order to describe an EMT, in particular the one that may underlie cardiac cushion tissue formation, we propose an algorithm that accounts for cell movement and proliferation, transformation of epithelial cells into mesenchymal cells and matrix production by the latter.
The elementary events in the simulation are summarized in Fig. 2. The left panel shows the events associated with EC movement, proliferation and type change. An EC moves by swapping positions with an adjacent volume element of apical medium (Fig. 2A) or matrix. Following the standard Metropolis Monte Carlo algorithm, we compute the corresponding energy change, ΔE, and accept the new configuration with a probability min(1, exp(−ΔE/ET )). Here ET, is the biological analog of the energy of thermal fluctuations in statistical physics (Beysens et al., 2000); it is related to metabolically driven membrane ruffling, and was used as a measure of cell motility. To describe proliferation, a volume element of medium adjacent to an EC is changed into a new EC (Fig. 2B). To describe cell type change in the course of EMT, an EC is transformed into an MC (Fig. 2C). Such a cell type change implies modification in cell adhesion properties.
Fig. 2.

Transitions of model endothelial (green) cells and mesenchymal (red) cells. Cell-sized volume elements of extracellular matrix (silver) and apical medium (empty circles) are rearranged by cells. (For details, see text). (For interpretation of the references to color in this figure caption, the reader is referred to the web version of the article.)
The right panel in Fig. 2 depicts MC movement and division, along with matrix production. An MC moves by swapping positions with either an EC, adjacent volume element of ECM or apical medium. The criterion for accepting the move is the same as described for ECs. However, if the movement of a MC results in a “hole” in the endothelium (i.e. direct contact between the ECM and the surrounding medium), to preserve its integrity, we assume that MC movement also triggers EC proliferation (and concomitant displacement of the endothelium). Such a case is depicted in Fig. 2D. (In reality, endothelial integrity is maintained also by EC deformation, an event not included in the present simulation.) During proliferation, a volume element of ECM, adjacent to a randomly chosen MC is transformed into a MC. To conserve the amount of ECM during such an event, a new ECM particle is created in a random position below the endothelium (Fig. 2E). Matrix production by MCs results in the decrease of the amount of apical medium (Fig. 2F). Note that the last two events also lead to the displacement of the endothelium, consistent with the preservation of its integrity.
The events shown in Fig. 2 are implemented in the simulations in the following sequence:
Interfacial MCs are detected. Those in contact with ECs are given the chance to move. MC movement could lead to the displacement of an ECM particle such that the ECM particle acquires first order neighbors of type M. Such a situation arises when the MC is swapped with the ECM particle underneath it (respectively the red and silver spheres in Fig. 2D, left). Such an event would lead to the disruption of the endothelium. Endothelial integrity can be restored by EC proliferation: replacing some of the M-type first order neighbors of the ECM particle by ECs (Fig. 2D, right). However, due to the discrete nature of the lattice, if the M-type particle (to be replaced by an EC) has more than eight EC neighbors in its vicinity, this proliferative step impairs the monolayer character of the endothelium. Thus, in such a case, endothelial integrity will be restored by the movement of the EC neighbors. (The number eight stems from the following. On a cubic lattice, if a cell is part of the endothelium, the latter’s integrity and mono-layer character requires that the cell’s vicinity comprise eight cells. An additional EC neighbor would need to reside above or below the endothelium, resulting in the loss of its monolayer character.)
Interfacial ECs are detected and classified as active or inactive (i.e. respectively located within or outside of the cushion-tissue-forming region).
A MC, not in the vicinity of the epithelium, is allowed to move, proliferate with probability pMC, or generate ECM with probability pECM. Movement is implemented as explained above. To simulate MC proliferation, an ECM neighbor of the MC is transformed into another MC. To conserve ECM volume, we randomly select an active EC and replace it with an ECM particle. As this step impairs endothelial integrity, we restore it following the procedure outlined in point 1 above.
Repeat step 2. (Note that MC movement, proliferation, as well as ECM production, as described under points 1 and 3 above, modify the configuration of the endothelium. As a consequence ECs may leave or enter the cushion-forming region, thus changing their active or inactive character.)
Each active EC is allowed to move or undergo EMT with probability pEMT. During its movement, it may change positions with M or ECM particles. During EMT, it turns into a MC.
Each inactive EC is allowed to move.
A Monte Carlo step (MCS) is defined as the set of operations during which each interfacial cell has been given the chance to experience a change. We performed the simulations with fixed boundary conditions: cell movement was confined to the volume of the simulated box and epithelial cells from the boundary did not change position or type.
3. Results
Our starting point for modeling EMT was the planar configuration depicted in Fig. 3A: a spatially uniform endothelial monolayer that covers a fragment of ECM. Evolution of the system was simulated using the parameters given in Table 1. To express the facts that negligible energy is needed to displace the apical medium during cell movement, and that cells interact much stronger with each other and ECM than with the medium (M-type particles, not shown in the figures), we set εM,M = εM,ECM = εM, EC = εM, MC = 0. Each line in Table 1 lists a set of interaction parameters used in simulations. The first six columns of the table (left panel) contain the non-vanishing works of adhesion, whereas columns 7–12 (right panel) contain the corresponding interfacial tension parameters.
Fig. 3.

The starting configuration (A): a monolayer of 6400 endothelial cells (EC, green), which separates the extracellular matrix (ECM, silver, transparent) from the surrounding medium (M, not shown). The conformations obtained during three representative simulations of 30 % 103 Monte Carlo steps (MCS): during simulation S1 (interaction energies in Table 1, Set 1) the endothelial layer broke down and mesenchymal cells (MCs, green) aggregated (B); simulation S2 (parameters in Table 1, Set 2) preserved the endothelial layer (C); simulation S3 (interfacial tensions in Table 1, Set 3) resulted in uniform invasion of the ECM by MCs, while the endothelium remained stable (D). MCs are represented as red spheres. In all three simulations the probability of EMT was pEMT = 2 × 10⁻⁶, whereas the probability of MC proliferation pMC = 0 and for extracellular matrix production pECM = 0. (For interpretation of the references to color in this figure caption, the reader is referred to the web version of the article.)
In the absence of EMT, the initial conformation in Fig. 3A remained unchanged upon simulations, confirming that a system composed of an endothelial layer in contact with a basal lamina is robust (i.e. it corresponds to an energy minimum). We simulated EMT by gradually increasing the complexity of the underlying model. This approach allowed dissecting the role and importance of the various biological determinants.
3.1. A minimal model of epithelial–mesenchymal transition
We begin with a minimal model for EMT, incorporating cell movement, endothelial cell type change and proliferation (but no mesenchymal cell proliferation and matrix production). This model clearly showed the role of adhesive energies in controlling mesenchymal invasiveness. Fig. 3 illustrates the impact of cell–cell and cell–ECM interactions on the emergent morphology. Panels B, C, and D show the final state of the model tissue in simulations S1, S2 and S3, with respective parameters listed under Sets 1, 2, and 3 in Table 1. Note that “inappropriate” adhesivities lead to epithelial sheet breakdown (Fig. 3B) and/or mesenchymal condensation (Fig. 3B and C). Simulations S1 and S2 only differ in the medium–ECM interfacial tension, γM, ECM. Small γM, ECM led to the breakdown of the epithelial sheet, followed by the rounding up of the fragments (Fig. 3B), whereas large γM, ECM preserved epithelial stability (Fig. 3C). Negative interfacial tension between the ECM and the MCs (γECM,MC < 0; S3) systematically resulted in uniform matrix invasion. In this case, consistent with DAH, the cells adopted a configuration with the largest possible contact area with the ECM (Fig. 3D). The situation with γECM,MC < 0 can arise either through the weakening of cell adhesion (i.e. decreasing εMC,MC) or the strengthening of cell–ECM interaction (i.e. increasing εECM,MC), both effects clearly promoting matrix invasion (Fig. 3D).
We used interfacial areas as quantitative measures of morphology, as often done to characterize patterns emerging in systems of immiscible fluids. We associated the same membrane area (1/26 of the cell surface area) to each bond with particles from the vicinity of a cell and expressed interfacial areas in this unit. In Fig. 4 we show the evolution of the contact area between ECs and the apical medium (thin lines), and between MCs and the ECM (thick lines) throughout the simulations S1, S2 and S3. The quick drop in the area of the M–EC interface (thin dotted line) reflects the breakdown of the endothelial layer in simulation S1, while the constant M–EC interfacial area during simulations S2 (thin dashed line) and S3 (thin solid line) implies a stable EC monolayer. The ECM–MC interfacial area during simulations S1 (thick dotted line) and S2 (thick dashed line), after an initial increase, seems to saturate (a signature of mesenchymal condensation), whereas in simulation S3 (thick solid line) increases linearly, corresponding to uniform matrix invasion.
Fig. 4.

The evolution of endothelial area (thin lines) and of the area of the MCECM interface (thick lines). The three pairs of curves correspond to simulations that yielded the structures shown in Fig. 3B (dotted line, simulation S1), Fig. 3C (dashed line, simulation S2), and Fig. 3D (solid line, simulation S3).
Thus, we conclude that in our minimal model the invasion and the resulting distribution of MCs within the ECM are determined by adhesive properties, i.e. by the corresponding interfacial tensions.
3.2. The effect of mesenchymal cell proliferation
We next focused on the role of MC proliferation (but no ECM production by these cells). The mesenchymal cell population results from EMT (i.e. transformed ECs) and division of the already present MCs (Fitzharris, 1981). To determine which of these two sources is dominant, we performed simulations with systematically changing the probabilities of EMT ant MC division, respectively pEMT and pMC. We found that as long as pMC < pEMT (Fig. 5, curve a) or pMC ≈ pEMT (Fig. 5, curves b and c) the increase in mesenchymal mole fraction is mostly due to EMT, resulting in linear growth. However, as pMC exceeds pEMT, cell division progressively takes over, leading to a nonlinear increase in MCs (Fig. 5, curves d and e).
Fig. 5.

The evolution of the mole fraction of MCs in the sub-endothelial ECM for different values of the MC proliferation probability, pMC, and EMT probability, pEMT: a (pEMT = 5 × 10⁻⁶, pMC = 0); b (pEMT = pMC = 10−6); c (pEMT = 10−6, pMC = 10−5); d (pEMT = 10−6, pMC = 5 × 10⁻⁵); e (pEMT = 10−6, pMC = 10−4). All simulations started from the initial state of Fig. 3A, with adhesive properties given in Table 1, Set 3; the entire endothelium was considered EMT-competent and matrix production was neglected (pECM = 0).
In vivo observations during avian heart development between Hamburger–Hamilton (HH) stages 16 HH and 20 HH (Hamburger and Hamilton, 1951) indicate that the mesenchymal cell population in the atrioventricular cushions increases nonlinearly (Moreno-Rodriguez et al., 1997). These experimental findings are consistent with the assumption of constant probabilities of EMT and mesenchymal proliferation only if pEMT « pMC (Fig. 5, curves d and e). Thus, our simulations suggest that the increase in the number of MCs during AVC tissue formation may be due to cell division and/or increase in the EMT rate.
3.3. The full model
To elucidate the mechanism of cushion tissue morphogenesis (Eisenberg and Markwald, 1995; Wessels and Sedmera, 2003), we simulated regionally restricted EMT incorporating all the biological features discussed (including ECM production).
The initial state in the simulations, an endothelial cell monolayer covering a layer of acellular cardiac jelly, is shown in cross-section in the upper left corner of Fig. 6A. In order to mimic regional localization, we suppose that endothelial cells are capable of EMT and proliferation only if they are within 30 cell diameters from the normal symmetry axis of the initial epithelium. Endothelial cells outside this active region are considered quiescent, unable to undergo EMT, but still able to move. (We do not consider here the initial myocardium-driven expansion of the cardiac jelly. Inclusion of this process, which is not part of EMT would merely require a slight modification of the initial state.)
Fig. 6.

Simulation snapshots of regionally restricted EMT (A). The initial state was a square-shaped epithelium, with a side length of 80 cell diameters, which covered a layer of ECM, with a thickness of four cell diameters. Images show the appearance of a cardiac cushion as seen across a cut through the diagonal of the original epithelial sheet. The label in the upper left corner of each image is the number of performed MCS. EMT was assumed to be restricted to a circular domain of 30 cell diameters in radius, and only occurred during the first 30 % 103 MCS, while the probabilities of proliferation and matrix production were: pEMT = 10−6, pMC = 1.2 × 10⁻⁴, pECM = 9 × 10⁻³. In the remainder of the simulation no EMT takes place and the system relaxes only by cell movement according to the Metropolis algorithm. With interfacial tensions given in Table 1, Set 4, the final state (B) is obtained in 50 × 103 MCS. The left, middle and right images in B show the final state, respectively in perspective, with part of the epithelium removed and additionally part of the ECM removed.
Snapshots of successive states in the simulation, labeled by the number of elapsed MCS, are shown in Fig. 6. Cell proliferation and EMT was considered to occur in the active region during the first 30,000 MCS. After this stage, during the last 20,000 MCS, the system relaxed by cell movement guided by differential adhesion. Mesenchymal cells invade the matrix due to increased cell–matrix adhesion (see parameters in Table 1, Set 4). As they produce ECM, they displace the EMT-competent, active endothelium in the direction of the apical medium. The monolayer character of the endothelium is maintained by a large value of the medium–ECM interfacial tension (γM,ECM) and by locally controlled endothelial proliferation.
The role of various factors in shaping the cushion is illustrated by examples of correct (column A in Fig. 7) and defective morphogenesis (columns B, C and D in Fig. 7). When γECM,MC > 0 aggregates form within the mesenchyme (Fig. 7, column B). If γECM,MC is too high, MCs generated by EMT remain in the vicinity of the endothelium rather than invading the ECM (Fig. 7, column C). A low interfacial tension between the ECM and the apical medium leads to spontaneous rupture of the endothelium and the emergent ECM becomes irregular in shape (Fig. 7, column D).
Fig. 7.
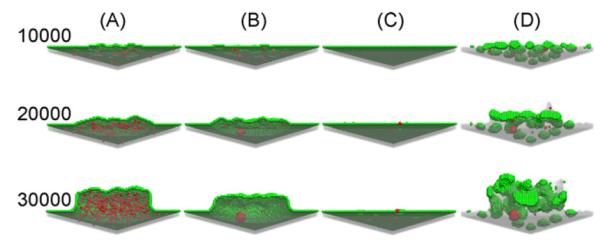
Cross-sections of snapshots of regionally restricted EMT, viewed from below the endothelium. A suitable set of parameters (Table 1, Set 4) gave rise to configu-ration (A, the same as in Fig. 6), which is similar to atrioventricular cushion tissues observed in early heart development (Moreno-Rodriguez et al., 1997). Interaction energies in Set 5, caused mesenchymal condensation (B), those in Set 6, did not allow MCs to spread in the underlying ECM (C), whereas those in Set 7, lead to disruption of the endothelial layer and mesenchymal condensation (D). The values of the probabilities pMC, pEC , pEMT used in these simulations was the same given in the caption to Fig. 4. Labels on the left of each row denote the number of elapsed MCS and refer to each panel in that row.
The simulations that yielded the snapshots in Fig. 7 are further characterized in Fig. 8 by monitoring interfacial areas. The first 30,000 MCS simulate regionally restricted EMT as in Figs. 6 and 7, whereas the last 20,000 MCS simulate tissue shape changes driven by differential adhesion. The left panel in Fig. 8 corresponds to the endothelium-medium interfacial area. The thick solid lines (A), are in qualitative agreement with experimental findings on cushion tissue formation (Moreno-Rodriguez et al., 1997; Wessels and Sedmera, 2003). The endothelial area, expressed by the number of M–EC bonds (left panel in Fig. 8), increases due to the proliferation of ECs needed to cover the growing cushion (A and B), remains constant if the cushion volume does not change (C). The endothelial area decreases if the endothelium ruptures and its fragments round up, and increases upon proliferation (D). (Compare these curves with the similarly labeled columns in Fig. 7.). The right panel in Fig. 8 shows that the MC-ECM interface always expands during (and only during) EMT, with the most rapid expansion taking place when the interaction energies lead to uniform matrix invasion (A).
Fig. 8.

The evolution of the areas of the endothelial layer (left) and of the MC-ECM interface (right) during the simulations that generated the states shown in Fig. 7, columns A–D.
The simulations are consistent with the fact that normal cushion tissue morphogenesis (Fig. 7, column A and Fig. 8, curves A in the simulations) is a robust phenomenon, as it resulted for a wide range of parameters (results not shown).
4. Discussion and Conclusions
We have developed a modeling framework for in silico studies of EMT-driven morphogenesis in the context of early heart development, in particular, cushion tissue formation. Our in silico study goes beyond earlier computational approaches (Kurnit et al., 1985). It incorporates recent findings from developmental biology, as well as from the field of computational biophysics. We represented the multicellular system on a cubic lattice, cell movement was simulated based on DAH (Steinberg, 1996) using the Metropolis Monte Carlo method, whereas EMT, mesenchymal cell proliferation and extracellular matrix production by mesenchymal cells were assumed to occur with constant probabilities. Modeling of endothelial cell proliferation was guided by experimental facts: the preservation of epithelial monolayer integrity during the growth of cushions.
Clearly, our computational model cannot provide a fully realistic description of cushion tissue formation. Given the complexity of the system, we attempted to build the simplest possible model that incorporates differential adhesion, EMT, cell proliferation and matrix production by mesenchymal cells. Simplicity allowed us to track the impact of individual parameters (and thereby of the associated mechanisms) on the emergent morphologies.
Despite the inherent limitations (e.g. absence of cell shape changes and cytoskeletal tension in the model), our simulations provide new insight into cushion tissue formation. They show (Figs. 6–8) that regionally restricted EMT, differential adhesion, endothelial and mesenchymal cell division along with ECM production by the latter are sufficient to produce structures consistent with the spatially regulated development of cardiac cushions (Butcher et al., 2007; Wessels and Sedmera, 2003). They suggest that EMT involves molecular events that decrease the cell–ECM interfacial tension by weakening cell–cell adhesion and/or by strengthening cell–ECM interaction. According to the model the latter mechanism is more efficient than the first.
It is known, however, that weakening of cell–cell adhesion occurs during endothelial cell activation that starts as early as HH stage 14 and leads to changes in EC morphology and separation between ECs (Icardo, 1989). The strengthening of cell–ECM interactions and subsequent ECM invasion is observed later, between HH stages 16 and 18 (Boyer et al., 1999; Runyan et al., 1990). Although the sequence of simulated events defines a certain chronology, Metropolis Monte Carlo simulations do not include an explicit time variable. Thus, our MCSs do not correspond to a rigorously defined time interval. Nevertheless, assuming a roughly linear correspondence between time and the number of performed MCSs, one may estimate the time scale of the simulations. Knowing from experiments (Moreno-Rodriguez et al., 1997) that cardiac cushion formation takes about 20 h, one can estimate that 1 MCS corresponds to approximately 2.4 s in the simulations of Fig. 6. Taking into account the transient loss of endothelial monolayer integrity during endothelial cell activation and the delay between the weakening of EC-EC adhesion and strengthening of MC-ECM adhesion would require a modeling framework with an explicit time variable.
Regarding the mechanism by which cardiac cushions are populated by cells, our model suggests that mesenchymal cell division plays a significant role. This conclusion is consistent with the mitogenic effects of FGF-4 (Sugi et al., 2003) and Tbx20 (Shelton and Yutzey, 2007), observed in chick AV cushions.
The model further implies that cell movement may be directed by interfacial tensions (i.e. a specific combination of interaction energies). Nevertheless, our simulations do not rule out other morphogenetic mechanisms such as chemotaxis (Eyiyurekli et al., 2008) and mechanical signaling. The determinant role of interfacial tensions on cell motility could be verified In vitro by genetically tuning cell–cell adhesion and/or cell–substrate interactions (e.g. via the concentration of integrin-binding domains attached to synthetic hydrogels (Butcher et al., 2007; Wessels and Sedmera, 2003)).
Cushion tissue morphogenesis also implies changes in cell shape. It has been observed by scanning electron microscopy that after completion of EMT, the cells that remain in the endothelial layer become flattened and adopt a polygonal morphology, suggesting that the activity of AV endothelial cells is related to the maintenance of endocardial integrity (Icardo, 1989). Therefore, future models of cushion tissue morphogenesis may benefit from a representation of cells as deformable structural units.
The Glazier–Graner–Hogeweg model (Glazier et al., 2007), implemented in the CompuCell 3D open-source platform (Cickovski et al., 2005), describes cell shape changes in a lattice representation, in which a cell spans several lattice sites and its subunits move according to a Metropolis Monte Carlo algorithm. Cell deformability is also described in off-lattice, force based models, which rely on Langevin dynamics to describe cell movement (Flenner et al., 2008; Galle et al., 2005; Newman, 2005). In vitro epithelial morphogenesis was simulated also by treating cells as elastic, adhesive spheres, and incorporating three regulatory mechanisms: cell–cell contact inhibition of cell growth, anchorage dependence of cell growth, and programmed cell death due to loss of contact with the substrate (Galle et al., 2005). Applied to the invasion of stroma by colorectal tumor cells, this model revealed that tumor cell growth rates and survival have moderate effects on invasion compared to the proteolytic activity of cells and directed cell migration, (Galle et al., 2006). Epithelial maintenance mechanisms depend on cell shape and cytoskeletal tension (Huang and Ingber, 1999); such aspects may be addressed in a recently developed finite-element model of cells (Hutson et al., 2008). While all these models account for DAH and cell proliferation, they need to be extended to incorporate ECM production by cells. Furthermore, models of tissues made of deformable cells face serious difficulties in finding the parameters that describe the mechanical properties of the constituent cells. Once these difficulties are surmounted, models of deformable cells may lead to deeper insight into cushion tissue morphogenesis.
Acknowledgments
This work was supported by NSF under grant EF 0526854 and by the Romanian Program for Excellence in Research, CEEX 62/2005 (MN).
References
- Amar JG. The Monte Carlo method in science and engineering. Computing in Science & Engineering. 2006;8:9–19. [Google Scholar]
- Arciniegas E, Frid MG, Douglas IS, Stenmark KR. Perspectives on endothelial-to-mesenchymal transition: potential contribution to vascular remodeling in chronic pulmonary hypertension. American Journal of Physiology: Lung Cellular and Molecular Physiology. 2007:293. doi: 10.1152/ajplung.00378.2006. [DOI] [PubMed] [Google Scholar]
- Armstrong EJ, Bischoff J. Heart valve development: endothelial cell signaling and differentiation. Circulation Research. 2004;95:459–470. doi: 10.1161/01.RES.0000141146.95728.da. [DOI] [PMC free article] [PubMed] [Google Scholar]
- Beysens DA, Forgacs G, Glazier JA. Cell sorting is analogous to phase ordering in fluids. Proceedings of the National Academy of Sciences USA. 2000;97:9467–9471. doi: 10.1073/pnas.97.17.9467. [DOI] [PMC free article] [PubMed] [Google Scholar]
- Boyer AS, Erickson CP, Runyan RB. Developmental Dynamics. vol. 214. An Official Publication of the American Association of Anatomists; 1999. Epithelial–mesenchymal transformation in the embryonic heart is mediated through distinct pertussis toxin-sensitive and TGFbeta signal transduction mechanisms; pp. 81–91. [DOI] [PubMed] [Google Scholar]
- Butcher JT, McQuinn TC, Sedmera D, Turner D, Markwald RR. Transitions in early embryonic atrioventricular valvular function correspond with changes in cushion biomechanics that are predictable by tissue composition. Circulation Research. 2007;100:1503–1511. doi: 10.1161/CIRCRESAHA.107.148684. [DOI] [PubMed] [Google Scholar]
- Camenisch TD, Runyan RB, Markwald R. Molecular regulation of cushion morphogenesis. In: Harvery R, Rosenthal N. (Eds.), editors. Heart Development and Regeneration. 2nd ed Elsevier; London: 2008. [Google Scholar]
- Cickovski TM, Chengbang H, Chaturvedi R, Glimm T, Hentschel HGE, Alber MS, Glazier JA, Newman SA, Izaguirre JA. A framework for three-dimensional simulation of morphogenesis. IEEE/ACM Transactions on Computational Biology and Bioinformatics. 2005;2:273–288. doi: 10.1109/TCBB.2005.46. [DOI] [PubMed] [Google Scholar]
- Eisenberg LM, Markwald RR. Molecular regulation of atrioventricular valvuloseptal morphogenesis. Circulation Research. 1995;77:1–6. doi: 10.1161/01.res.77.1.1. [DOI] [PubMed] [Google Scholar]
- Eyiyurekli M, Manley P, Lelkes PI, Breen DE. A computational model of chemotaxis-based cell aggregation. Biosystems. 2008;93:226–239. doi: 10.1016/j.biosystems.2008.05.005. [DOI] [PubMed] [Google Scholar]
- Fitzharris TP. Origin and migration of cushion tissue in the developing heart. Scanning Electron Microscopy. 1981;2:255–260. [PubMed] [Google Scholar]
- Flenner E, Marga F, Neagu A, Kosztin I, Forgacs G. Relating biophysical properties across scales. Current Topics in Developmental Biology. 2008;81:461–483. doi: 10.1016/S0070-2153(07)81016-7. [DOI] [PubMed] [Google Scholar]
- Forgacs G, Foty RA, Shafrir Y, Steinberg MS. Viscoelastic properties of living embryonic tissues: a quantitative study. Biophysical Journal. 1998;74:2227–2234. doi: 10.1016/S0006-3495(98)77932-9. [DOI] [PMC free article] [PubMed] [Google Scholar]
- Foty RA, Forgacs G, Pfleger CM, Steinberg MS. Liquid properties of embryonic-tissues–measurement of interfacial-tensions. Physical Review Letters. 1994;72:2298–2301. doi: 10.1103/PhysRevLett.72.2298. [DOI] [PubMed] [Google Scholar]
- Foty RA, Pfleger CM, Forgacs G, Steinberg MS. Surface tensions of embryonic tissues predict their mutual envelopment behavior. Development. 1996;122:1611–1620. doi: 10.1242/dev.122.5.1611. [DOI] [PubMed] [Google Scholar]
- Foty RA, Steinberg MS. The differential adhesion hypothesis: a direct evaluation. Developmental Biology. 2005;278:255–263. doi: 10.1016/j.ydbio.2004.11.012. [DOI] [PubMed] [Google Scholar]
- Galle J, Loeffler M, Drasdo D. Modeling the effect of deregulated proliferation and apoptosis on the growth dynamics of epithelial cell Populations In vitro. Biophysical Journal. 2005;88:62–75. doi: 10.1529/biophysj.104.041459. [DOI] [PMC free article] [PubMed] [Google Scholar]
- Galle J, Sittig D, Hanisch I, Wobus M, Wandel E, Loeffler M, Aust G. Individual cell-based models of tumor-environment interactions–multiple effects of CD97 on tumor invasion. American Journal of Pathology. 2006;169:1802–1811. doi: 10.2353/ajpath.2006.060006. [DOI] [PMC free article] [PubMed] [Google Scholar]
- Gerisch A, Chaplain MA. Mathematical modelling of cancer cell invasion of tissue: local and non-local models and the effect of adhesion. Journal of Theoretical Biology. 2008;250:684–704. doi: 10.1016/j.jtbi.2007.10.026. [DOI] [PubMed] [Google Scholar]
- Glazier JA, Balter A, Popławksi NJ. Magnetization to morphogenesis: a history of the GGH model. In: Anderson ARA, Chaplain MAJ, Rejniak RA, editors. Single-cell-based Models in Biology and Medicine. Birkhauser, Basel; Boston, Berlin: 2007. pp. 79–106. [Google Scholar]
- Glazier JA, Graner F. Simulation of the differential adhesion driven rearrangement of biological cells. Physical Review E. 1993;47:2128–2154. doi: 10.1103/physreve.47.2128. [DOI] [PubMed] [Google Scholar]
- Graner F, Glazier JA. Simulation of biological cell sorting using a 2-dimensional extended Potts-model. Physical Review Letters. 1992;69:2013–2016. doi: 10.1103/PhysRevLett.69.2013. [DOI] [PubMed] [Google Scholar]
- Grant MR, Mostov KE, Tlsty TD, Hunt CA. Simulating properties of In vitro epithelial cell morphogenesis. PLoS Computational Biology. 2006;2:e129. doi: 10.1371/journal.pcbi.0020129. [DOI] [PMC free article] [PubMed] [Google Scholar]
- Hamburger V, Hamilton HL. A series of normal stages in the development of the chick embryo. Journal of Morphology. 1951;88:49–92. doi: 10.1002/aja.1001950404. [DOI] [PubMed] [Google Scholar]
- Hay ED. The mesenchymal cell, its role in the embryo, and the remarkable signaling mechanisms that create it. Developmental Dynamics. 2005;233:706–720. doi: 10.1002/dvdy.20345. [DOI] [PubMed] [Google Scholar]
- Hegedus B, Marga F, Jakab K, Sharpe-Timms KL, Forgacs G. The interplay of cell–cell and cell–matrix interactions in the invasive properties of brain tumors. Biophysical Journal. 2006;91:2708–2716. doi: 10.1529/biophysj.105.077834. [DOI] [PMC free article] [PubMed] [Google Scholar]
- Huang S, Ingber DE. The structural and mechanical complexity of cell-growth control. Nature Cell Biology. 1999;1:E131–E138. doi: 10.1038/13043. [DOI] [PubMed] [Google Scholar]
- Hutson MS, Brodland GW, Yang J, Viens D. Cell sorting in three dimensions: topology, fluctuations, and fluidlike instabilities. Physical Review Letters. 2008;101:148105–148104. doi: 10.1103/PhysRevLett.101.148105. [DOI] [PubMed] [Google Scholar]
- Icardo JM. Changes in endocardial cell morphology during development of the endocardial cushions. Anatomy and Embryology. 1989;179:443–448. doi: 10.1007/BF00319586. [DOI] [PubMed] [Google Scholar]
- Jakab K, Damon B, Neagu A, Kachurin A, Forgacs G. Three-dimensional tissue constructs built by bioprinting. Biorheology. 2006;43:509–513. [PubMed] [Google Scholar]
- Jakab K, Neagu A, Mironov V, Markwald RR, Forgacs G. Engineering biological structures of prescribed shape using self-assembling multicellular systems. Proceedings of the National Academy of Sciences U.S.A. 2004;101:2864–2869. doi: 10.1073/pnas.0400164101. [DOI] [PMC free article] [PubMed] [Google Scholar]
- Kurnit DM, Aldridge JF, Matsuoka R, Matthysse S. Increased adhesiveness of trisomy 21 cells and atrioventricular canal malformations in Down syndrome: a stochastic model. American Journal of Medical Genetics. 1985;20:385–399. doi: 10.1002/ajmg.1320200222. [DOI] [PubMed] [Google Scholar]
- Lao BJ, Kamei DT. Investigation of cellular movement in the prostate epithelium using an agent-based model. Journal of Theoretical Biology. 2008;250:642–654. doi: 10.1016/j.jtbi.2007.11.001. [DOI] [PubMed] [Google Scholar]
- Lee JM, Dedhar S, Kalluri R, Thompson EW. The epithelial–mesenchymal transition: new insights in signaling, development, and disease. Journal of Cell Biology. 2006;172:973–981. doi: 10.1083/jcb.200601018. [DOI] [PMC free article] [PubMed] [Google Scholar]
- Markwald R, Eisenberg C, Eisenberg L, Trusk T, Sugi Y. Epithelial–mesenchymal transformations in early avian heart development. Acta Anatomica. 1996;156:173–186. doi: 10.1159/000147845. [DOI] [PubMed] [Google Scholar]
- Markwald RR, Mjaatvedt CH, Krug EL, Sinning AR. Inductive interactions in heart development–role of cardiac adherons in cushion tissue formation. Annals of the New York Academy of Sciences. 1990;588:13–25. doi: 10.1111/j.1749-6632.1990.tb13193.x. [DOI] [PubMed] [Google Scholar]
- Metropolis N, Rosenbluth AW, Rosenbluth MN, Teller AH, et Telle E. Equation of state calculations by fast computing machines. Journal of Chemical Physics. 1953;21:1087–1097. [Google Scholar]
- Mjaatvedt CH, Markwald RR. Induction of an epithelial–mesenchymal transition by an in vivo adheron-like complex. Developmental Biology. 1989;136:118–128. doi: 10.1016/0012-1606(89)90135-8. [DOI] [PubMed] [Google Scholar]
- Mombach JCM, Glazier JA, Raphael RC, Zajac M. Quantitative comparison between differential adhesion models and cell sorting in the presence and absence of fluctuations. Physical Review Letters. 1995;75:2244–12244. doi: 10.1103/PhysRevLett.75.2244. [DOI] [PubMed] [Google Scholar]
- Moreno-Rodriguez RA, de la Cruz MV, Krug EL. Temporal and spatial asymmetries in the initial distribution of mesenchyme cells in the atrioventricular canal cushions of the developing chick heart. The Anatomical Record. 1997;248:84–92. doi: 10.1002/(SICI)1097-0185(199705)248:1<84::AID-AR10>3.0.CO;2-1. [DOI] [PubMed] [Google Scholar]
- Neagu A, Jakab K, Jamison R, Forgacs G. Role of physical mechanisms in biological self-organization. Physical Review Letters. 2005;95:178104. doi: 10.1103/PhysRevLett.95.178104. [DOI] [PubMed] [Google Scholar]
- Neagu A, Kosztin I, Jakab K, Barz B, Neagu M, Jamison R, Forgacs G. Computational modeling of tissue self-assembly. Modern Physics Letters B. 2006;20:1217–1231. [Google Scholar]
- Newman TJ. Modeling multicellular systems using subcellular elements. Mathematical Biosciences and Engineering. 2005;2:611–622. doi: 10.3934/mbe.2005.2.613. [DOI] [PubMed] [Google Scholar]
- O’Riordan E, Mendelev N, Patschan S, Patschan D, Eskander J, Cohen-Gould L, Chander P, Goligorsky MS. Chronic NOS inhibition actuates endothelial–mesenchymal transformation. American Journal of Physiology, Heart and Circulatory Physiology. 2007;292:H285–294. doi: 10.1152/ajpheart.00560.2006. [DOI] [PubMed] [Google Scholar]
- Person AD, Klewer SE, Runyan RB. Cell biology of cardiac cushion development. International Review of Cytology. 2005;243:287–335. doi: 10.1016/S0074-7696(05)43005-3. [DOI] [PubMed] [Google Scholar]
- Ramis-Conde I, Drasdo D, Anderson ARA, Chaplain MAJ. Modeling the influence of the E-cadherin-{beta}-catenin pathway in cancer cell invasion: a multiscale approach. Biophysical Journal. 2008;95:155–165. doi: 10.1529/biophysj.107.114678. [DOI] [PMC free article] [PubMed] [Google Scholar]
- Runyan RB, Potts JD, Sharma RV, Loeber CP, Chiang JJ, Bhalla RC. Signal transduction of a tissue interaction during embryonic heart development. Cell Regulation. 1990;1:301–313. doi: 10.1091/mbc.1.3.301. [DOI] [PMC free article] [PubMed] [Google Scholar]
- Schaller G, Meyer-Hermann M. A modelling approach towards epidermal homoeostasis control. Journal of Theoretical Biology. 2007;247:554–573. doi: 10.1016/j.jtbi.2007.03.023. [DOI] [PubMed] [Google Scholar]
- Schroeder JA, Jackson LF, Lee DC, Camenisch TD. Form and function of developing heart valves: coordination by extracellular matrix and growth factor signaling. Journal of Molecular Medicine. 2003;81:392–403. doi: 10.1007/s00109-003-0456-5. [DOI] [PubMed] [Google Scholar]
- Shelton EL, Yutzey KE. Tbx20 regulation of endocardial cushion cell proliferation and extracellular matrix gene expression. Developmental Biology. 2007;302:376–388. doi: 10.1016/j.ydbio.2006.09.047. [DOI] [PMC free article] [PubMed] [Google Scholar]
- Steinberg MS. Reconstruction of tissues by dissociated cells. Some morpho-genetic tissue movements and the sorting out of embryonic cells may have a common explanation. Science. 1963;141:401–408. doi: 10.1126/science.141.3579.401. [DOI] [PubMed] [Google Scholar]
- Steinberg MS. Adhesion in development: an historical overview. Developmental Biology. 1996;180:377–388. doi: 10.1006/dbio.1996.0312. [DOI] [PubMed] [Google Scholar]
- Steinberg MS. Differential adhesion in morphogenesis: a modern view. Current Opinion in Genetics & Development. 2007;17:281–286. doi: 10.1016/j.gde.2007.05.002. [DOI] [PubMed] [Google Scholar]
- Sugi Y, Ito N, Szebenyi G, Myers K, Fallon JF, Mikawa T, Markwald RR. Fibroblast growth factor (FGF)-4 can induce proliferation of cardiac cushion mesenchymal cells during early valve leaflet formation. Developmental Biology. 2003;258:252–263. doi: 10.1016/s0012-1606(03)00099-x. [DOI] [PubMed] [Google Scholar]
- Thiery JP. Epithelial–mesenchymal transitions in development and pathologies. Current Opinion in Cell Biology. 2003;6:740–746. doi: 10.1016/j.ceb.2003.10.006. [DOI] [PubMed] [Google Scholar]
- Wessels A, Sedmera D. Developmental anatomy of the heart: a tale of mice and man. Physiological Genomics. 2003;15:165–176. doi: 10.1152/physiolgenomics.00033.2003. [DOI] [PubMed] [Google Scholar]
- Zeisberg EM, Potenta S, Xie L, Zeisberg M, Kalluri R. Discovery of endothelial to mesenchymal transition as a source for carcinoma-associated fibroblasts. Cancer Research. 2007a;67:10123–10128. doi: 10.1158/0008-5472.CAN-07-3127. [DOI] [PubMed] [Google Scholar]
- Zeisberg EM, Tarnavsk IO, Zeisberg M, Dorfman AL, McMullen JR, Gustafsson E, Chandraker A, Yuan X, Pu WT, Roberts AB, Neilson EG, Sayegh MH, Izumo S, Kalluri R. Endothelial-to-mesenchymal transition contributes to cardiac fibrosis. Nature Medicine. 2007b;8:952–961. doi: 10.1038/nm1613. [DOI] [PubMed] [Google Scholar]