

Abstract
Objective
One effective event-level index that can assist in identifying risky intoxication levels among college students is blood alcohol concentration (BAC). Despite widespread exposure to BAC information, doubt exists as to whether American college students can accurately estimate their own BAC level or drinking behaviors while intoxicated. This study assessed whether students can accurately guesstimate their BAC level (gBAC) and drinking behaviors used to estimate BAC (eBAC) while drinking in social college settings
Method
Participants (N = 225; 56.4% male) consisted of emerging adults attending either a two- or four-year college who had at least one alcoholic drink within the two hours prior to assessment. Participants were approached at night when returning from parties and/or alcohol-serving establishments. They completed an initial questionnaire, gave a breath sample to assess breath alcohol content (BrAC), and then completed an on-line follow-up questionnaire within 48 hours of baseline assessment.
Results
Participants at lower levels of intoxication tended to slightly overestimate their BAC level, while those at higher levels tended to markedly underestimate their BAC level. In addition, discrepancies among BrAC, gBAC, and eBAC were found as a function of gender. Lastly, differences in eBAC scores did not differ when drinking behaviors were obtained via in vivo versus retrospective methodology.
Conclusions
Findings suggest that college students generally have difficulty assessing their BAC level and drinking behaviors while drinking in the college social setting. This study offers particular insight for research relying on estimates of BAC as well as interventions utilizing BAC education.
Abuse of alcohol by undergraduates is a serious health concern for American universities (Hingson, Zha, & Weitzman, 2009; O’Malley & Johnston, 2002). Many college students drink to intoxication levels that place them at risk for serious negative consequences (National Center on Addiction and Substance Abuse at Columbia University, 2007; Task Force of the National Advisory Council on Alcohol Abuse and Alcoholism, 2002). One effective event-level index for identifying such risky intoxication levels is blood alcohol concentration (BAC). As the most proximal outcome of drinking, BAC has unique explanatory power over other predictors of alcohol-related problems because it accounts for extraneous variables (e.g., quantity of alcohol consumed, alcohol type, duration of drinking) that affect one’s level of intoxication (Lange & Voas, 2001; Bullers & Ennis, 2006). This standardization of intoxication across individuals offers a directly interpretable, objective value that can be utilized in educating students on alcohol-related risk.
As awareness campaigns about possible physical, social, and legal consequences of high intoxication levels are increasingly promoted across the U.S. and on college campuses (Toomey & Wagenaar, 2002), BAC is being used as an index for alcohol-related risk. Messages expose college students to the dangers associated with high BAC levels (e.g., injuries and deaths from drunk driving) and consequently call attention to the importance of being able to monitor one’s BAC while drinking. BAC is also being utilized as an outcome measure for research on heavy alcohol use (e.g. Perkins, DeJong, & Linkenbach, 2001; Thombs et al., 2008). Many widespread, multi-component alcohol interventions for students, such as BASICS (Dimeff, Baer, Kivlahan, & Marlatt 1999), AlcoholEdu® (Outside the Classroom, 2010), and Heads UP (LaBrie, 2010), also have some focus on BAC education. Students are shown how to estimate their BAC level based on their gender, weight, number of standard drinks consumed, and duration spent drinking (Bullers & Ennis, 2006). Theoretically, prior to BAC education, students assess their level of intoxication viscerally, yet once students are taught how to estimate their BAC using these factors, they are believed to better monitor their own drinking in the moment as well as improve planning for future drinking behavior (e.g., by setting a priori limits on acceptable drinking quantities).
Despite intended widespread exposure to BAC information, however, doubt exists as to whether college students can accurately monitor their BAC level while they are drinking. While research appears to suggest that increases in intoxication hinder the ability to accurately assess one’s BAC, findings regarding the pattern of BAC misperceptions (i.e., whether drinkers tend to overestimate or underestimate their BAC levels) are inconsistent (see Bullers & Ennis, 2006). Although early research concerning BAC estimations examined if drinkers can judge whether they have reached the legal limit for intoxication (Cox et al., 1995; Williams, 1991), researchers have recently had students report precise values of their ‘guesstimated BAC’ (gBAC; Hustad & Carey, 2005) for a naturally occurring drinking event to examine the validity of self-reported BAC. For example, when retrospectively asking students to guess their BAC for a drinking event the previous night, Hustad & Carey (2005) found gBAC to be a relatively strong predictor of breath alcohol content (BrAC). However, they did not test whether discrepancies existed between the two indices. To assess misperceptions while intoxicated, Thombs, Olds, & Snyder (2003) had students guess their BAC in vivo during a drinking event. At lower intoxication levels, drinkers tended to overestimate BAC, while at higher levels, drinkers increasingly underestimated BAC. More research is needed to elucidate the precise relationship between level of intoxication and gBAC accuracy.
Research investigating high-risk drinking among college students has increasingly begun to estimate intoxication using BAC equations (eBACs). While BAC assessed directly with physiological samples (e.g., breath, blood) yields the most accurate measurement of intoxication (Carey & Hustad, 2002), direct assessment of BAC is seldom available and thus is quite impractical for research or intervention programs (Turner, Bauerle, & Shu, 2004). eBACs, however, are relatively easy to calculate by using self-report data of relevant demographics and drinking behaviors (NHTSA, 1994), making them a useful alternative (Carey & Hustad, 2002; Perkins et al., 2001; Turner et al., 2004). Nevertheless, eBAC does have its limitations. Most significantly, the calculation of eBAC depends on students’ self-reports of drinking behaviors, which can be influenced by several factors: ignorance of standard drink volumes (White, Kraus, McCracken, & Swartzwelder, 2003; White et al., 2005), poor recall while intoxicated (Babor, Steinberg, Anton, & Del Boca, 2000; Hustad & Carey, 2005), and environmental factors that influence self-monitoring of alcohol consumption (Clapp, Min, & Shillington, 2006). Consequently, researchers have found that even the best fitting BAC equation produces discrepancies between eBAC and BrAC (Carey & Hustad, 2002; Hustad & Carey, 2005).
Although several studies have examined the validity of BAC estimates, no studies to our knowledge have examined either between- or within-subjects discrepancies among BrAC, eBAC, and gBAC. While Hustad & Carey (2005) found via correlational comparisons that the strength of the linear relationships between BrAC with eBAC versus BrAC with gBAC did not differ, incorporating these measures into one model and analyzing their relationships via mean comparisons may help to identify discrepancies among these indices and elucidate reasons for incongruities. For example, membership in at-risk student groups may influence the accuracy of BAC estimates. The most intoxicated drinkers are the most likely to be impaired and least likely to accurately estimate their drinking behaviors while intoxicated (Clapp et al., 2006; Hustad & Carey, 2005).
One demographic variable known to influence drinking behavior is gender. Male students consistently report higher levels of alcohol use than their female counterparts (e.g., O’Malley & Johnston, 2002; Vaisman-Tzachor & Lai, 2008), so they may experience more difficulty in assessing their BAC or drinking behaviors due to cognitive impairments while drinking. This well known moderating factor should be examined while investigating the relationships among BrAC, eBAC, and gBAC, as nuances revealed between groups could assist research examining the use of eBAC as a predictor of actual BAC. This could ultimately improve the design of targeted interventions and risk-reduction efforts that utilize BAC measures to educate students on monitoring their drinking.
The validity of eBAC may also differ by the time at which drinking behaviors are self-reported. While researchers have had participants self-report their drinking behaviors either retrospectively (Carey & Hustad, 2002; Hustad & Carey, 2005) or concurrently with BrAC assessment (Clapp et al., 2006; Thombs et al., 2003, 2008), none have directly compared the two methodologies. Differential effectiveness of retrospective versus in vivo eBAC may provide insight into factors that prevent students from accurately assessing their drinking behaviors. For instance, in vivo eBAC may approximate BrAC less adequately due to intoxication effects at the time of assessment. Conversely, higher associations between in vivo eBAC and BrAC may occur because self-reports are closer to the drinking event, diminishing the possibility of recall bias. Moreover, eBAC equations were developed in controlled laboratory settings and therefore may not be as valid for approximating BAC in a naturally occurring drinking event where situational features and drinking behaviors show greater variance (Carey & Hustad, 2002). The use of event-level data is important to determine whether eBAC equations developed in laboratory settings maintain reliability when used in natural settings, and whether time of drinking behavior assessment affects this reliability.
The purpose of this study is threefold: to assess whether students can accurately guess their BAC level while drinking; to examine possible predictors of discrepancies among the relationships between BrAC, gBAC, and eBAC by gender; and to compare in vivo versus retrospective eBAC. Our hypotheses were as follows: (a) as intoxication levels increased, students would produce greater misperceptions of their BAC; (b) BrAC, gBAC, and eBAC would display differential discrepancies by gender; and (c) in vivo and retrospective eBACs would differentially approximate BrAC.
Methods
Participants
Participants were 305 (182 males and 123 females) college students recruited on or near the campuses of two universities on Tuesday, Thursday, and Friday nights for an IRB-approved study. Inclusion criteria included being a current college student who reported consuming at least one alcoholic beverage within two hours prior to baseline assessment. Of the 305 participants, 225 (127 males and 98 females; age M = 20.22, SD = 1.26) completed the follow-up survey and comprised the final sample used in all analyses, yielding a retention rate of 73.7%. The ethnicity of the sample was 71.1% Caucasian, 12.0% Hispanic, 4.4% Asian, 0.9% African American, 8.4% Mixed, and 3.0% Other. Retained participants did not significantly differ from the attrition sample on age, ethnicity, total self-reported drinks consumed, or BrAC value at baseline.
Materials and Procedure
The research team (consisting of three to five research assistants) approached participants either as they exited alcohol serving establishments, events at which alcohol was consumed, or in front of their residence as they returned home (e.g., on-campus dormitories or off-campus Greek housing). Sampling occurred between the hours of 10 P.M. and 3 A.M. Each research assistant was individually trained, prior to assessment, to administer either a breath test or questionnaire. Research team members asked potential participants if they would be willing to partake in a brief study on alcohol beliefs and behaviors. If they expressed interest in the study, they were assessed for inclusion criteria. If they met criteria, the researcher explained that study participation would involve (a) learning about the study and providing informed consent, (b) answering a brief paper-pencil questionnaire, (c) providing a breath sample to assess BrAC, and (d) providing an email address to allow the researchers to contact them within the following 48 hours for a brief follow-up survey. After this explanation, participants were given an IRB-approved informed consent form to review with the staff member and then sign, prior to beginning the assessment.
Special attention was given to ethical concerns regarding the inclusion of intoxicated individuals. Firstly, the pre-established protocol was to not approach individuals who appeared to be extremely intoxicated and unable to control themselves. If, once engaged, a potential participant could not comprehend the informed consent form (which was the most cognitively difficult as well as an ethically important task) and displayed signs of alcohol poisoning, research team members were prepared to summon the on-call student emergency medical technicians or local paramedics. No such emergency calls were necessary. Secondly, care was taken to ensure individuals’ competency to consent. Following review of the informed consent, research staff double-checked that each potential participant understood the form’s content by asking them if they understood the procedure they were about undertake and what it entailed. Participants had to state that they would answer a brief paper-and-pencil questionnaire about their drinking behaviors, would provide a breath sample to assess BrAC, would provide an email address for a brief follow-up contact, and that all information would remain confidential. If participants did not mention one/any of these components, the staff member reviewed them again and reaffirmed that the participant consented to these conditions. Participants were then reminded that they would receive a follow-up survey via email, and that, upon completion of the follow-up survey, they would receive a second email with their BrAC reading and information on how to redeem a $10 iTunes® gift certificate. If the participant agreed to all study conditions, he/she signed the form and began assessment.
Baseline assessment
Participants first completed a brief questionnaire (approximately 10 to 15 minutes in length) and then had their BrAC assessed via the AlcoHAWK PT500 P, a Department of Transportation approved breath test screening device. While evidential screening devices consist of a higher standard of detecting blood alcohol concentration compared to screening devices, the PT500P has many characteristics unique to evidential devices, including quantitative digital readouts, high BrAC detection (up to 0.40), printers recording assessment information, and 3 decimal-place BrAC displays (Dubowski, 1991). Participants were instructed to take a deep breath and then to blow strongly into the breath device mouthpiece for five seconds. Participants were not asked to rinse prior to the breath test as in previous studies (e.g., Carey & Hustad, 2002; Hustad & Carey, 2005) because the questionnaire assessment period required approximately 10 to 15 minutes to complete, thus serving as a safeguard against residual mouth alcohol. The breath device was modified so that participants’ BrAC values were not visibly displayed; thus, both participants and researchers were blinded from the BrAC value during assessment. BrAC readings were recorded internally, and test results were sent immediately via a wireless connection to a private printer accessible only by the researcher. Printouts had unique identification numbers, which were paired with corresponding participants and recorded on their questionnaires. Printouts were not accessed and examined by the principal investigator until the following day. This procedure was consistent with previous IRB-approved studies of the same nature to meet validity concerns regarding length of the entire procedure, experimenter bias, the possibility of influencing students to drink more after assessment, and ethical standards for privacy and legal liability (e.g., Carey & Hustad, 2002; Clapp et al., 2006; Hustad & Carey, 2005; Lange & Voas, 2001).
Follow-up survey
Within 48 hours following each respective baseline assessment, participants received a follow-up email that contained a link to a Web-based survey. Before taking the survey, participants once again received and electronically signed an IRB-approved informed consent form. They were then directed to a questionnaire that took approximately 10 minutes to complete. Once completed, participants were electronically sent their BrAC reading as well as an internet code to redeem their $10 iTunes® gift certificate. Participants who had a BrAC over 0.15 were also sent general information on BAC, alcohol’s effects at different BAC levels, and follow-up information on counseling services and other resources for alcohol use.
Measures
Demographics
The baseline questionnaire began with an assessment of demographic variables including age, gender, ethnicity, and weight.
gBAC
Participants were asked to ‘guesstimate’ their current BAC level with the following question: “What do you estimate is your current Blood Alcohol Content?” If participants asked what particular BAC values corresponded to, research assistants gave the following answer: “Answers may range from 0.00 (which is sober) to 0.40 (which is the lethal limit), where .08 is the legal limit for intoxication while driving in the state of California.” Participants then marked their guesstimate on the questionnaire. Coaching participants on BAC values and their associated effects was abbreviated compared to previous studies on self-reported BAC (e.g., Hustad & Carey, 2005) in order to examine students’ ability to guesstimate BAC with little assistance.
Drinking behaviors
The number of standard drinks and duration spent drinking were assessed both at baseline and at follow-up (to calculate in vivo eBAC and retrospective eBAC, respectively). Before answering questions about drinking behavior, participants were presented with standard drink definitions (i.e., a drink containing one-half ounce of ethyl alcohol — one 12 oz. beer, 8 oz. of malt liquor, one 4 oz. glass of wine, or one 1.25 oz. shot). Participants also responded to: “How long [in hours] have you been drinking tonight (from first sip to last sip)?” Similarly, in the follow-up survey, participants were asked to retrospectively recall these alcohol use behaviors over the course of that night up until the baseline assessment. Questions paralleled those asked during the baseline assessment, producing retrospective ‘total standard drinks’ and ‘time spent drinking’ variables.
Total past-month drinks and past-month binge episodes were assessed on the follow-up survey. Participants reported how many days they had drank in the past month and how many drinks they typically consumed on each drinking occasion. ‘Total past-month drinks’ was calculated by multiplying these two variables. Participants also responded to the following question: “How many times did you binge drink in the past month?” Binge drinking was defined as five or more drinks in two hours for males and four or more drinks in two hours for females (Wechsler, Dowdall, Davenport, Castillo, 1995).
eBAC
Self-reported drinking data and a modified version of the NHTSA (1994) equation were used for calculating event-level eBAC: BAC = (SD*(2.24146232/(W*TBW)))-(β60*t), where SD is the number of self-reported standard drinks, W is weight in pounds, TBW is total body water (0.58 for males, 0.49 for females), β60 is the metabolism rate of alcohol per hour (i.e., 0.017g/dl), and t is time spent drinking in hours. This equation has previously been used in research examining undergraduate alcohol use (e.g., Carey & Hustad, 2002; Hansson, Rundberg, Zetterlind, Johnsson, & Berglund, 2006; LaBrie & Pedersen, 2008). The NHTSA equation was preferred to other well-known equations (e.g., the Widmark equation; Watson, Watson, & Batt, 1981) because other equations estimate peak BAC, whereas an equation that estimated BAC for the same time point as gBAC and BrAC assessment was needed for the current study. The NHTSA equation approximates BAC at any given time by decreasing a person’s theoretical instantaneous peak BAC by the amount of alcohol metabolized from the beginning of drinking (i.e., adjusting for time spent drinking t and an estimate of metabolism rate of alcohol per hour β60; NHTSA, 1994). Calculations for in vivo eBAC utilized drinking behaviors reported at baseline, while retrospective eBAC used drinking behaviors self-reported at follow-up.
Results
Analytic Plan
To assess BAC misperceptions, a paired samples t-test was used to examine whether BrAC significantly differed from gBAC. Next, level of BAC misperception was calculated for each participant by taking the BAC actual (BrAC) score and subtracting the guesstimated BAC (gBAC) score. A derived positive score represented underestimation of BAC, a score of zero represented accurate estimation of BAC, and a negative score represented overestimation of BAC. A Pearson correlation was utilized to assess whether the magnitude of BAC misperception was associated with BrAC score. In addition, to provide further insight into the relationship between gBAC accuracy and level of intoxication, the sample was split into three approximately equivalent groups based on BrAC intervals of 0.08, which are also significant markers of physiological impairment (NHTSA, 2001; White et al., 2005). Participants were assigned to BAC Group 1 if their BrAC was from 0.00 to 0.08, Group 2 if their BrAC was from 0.081 to 0.16, and Group 3 if their BrAC was above 0.16. A one-way ANOVA with the three BrAC groups as the independent factor and BAC misperception as the dependent factor was used to examine patterns of misperception at various ranges of intoxication.
Next, repeated measure ANOVA models were undertaken to investigate whether the means of the three BAC measures (BrAC, gBAC, and eBAC) were significantly different and whether they were moderated by gender. All eBAC values were capped at .40 as the BrAC device cannot detect BACs above this level. This adjustment only affected three males in the sample and thus, was not found to alter any results. The three BAC measures served as the within-subjects factor, while gender was specified as the moderating between-subjects factor. Planned contrasts followed to pair-wise decompose omnibus results. Lastly, paired t-tests were used to investigate differences between in vivo eBAC and retrospective eBAC, as well as total drinks self-reported at baseline and at follow-up.
Although all analyses were conducted on the sample of 225 students who completed both the baseline assessment and follow-up survey, we also conducted the analyses that involved only baseline assessment data on the full 305 students who completed the baseline assessment. The pattern of significant findings found when including the attriters was exactly the same as reported below.
Descriptives
On average, participants had consumed 6.44 standard drinks the night of assessment (SD = 3.80), 66.15 drinks in the past month (SD = 44.74), and had binge drank 5.55 times in the past month (SD = 4.53). On average, males consumed 7.53 standard drinks at baseline (SD = 4.04), 79.19 drinks in the last month (SD = 47.66), and had binge drank 6.57 times in the past month (SD = 4.67). Females consumed 5.01 standard drinks at baseline (SD = 2.90), 49.04 drinks in the last month (SD = 33.87), and had binge drank 4.20 times in the last month (SD = 3.97).
Misperceptions of BAC
The sample mean BrAC was 0.12 (SD = 0.07), the mean in vivo eBAC was 0.12 (SD = 0.09), and the mean gBAC was 0.10 (SD = 0.05). Overall, participants significantly misperceived their BAC on the night of assessment, paired t(222) = 5.34, p < 0.001. In addition, BAC misperception was significantly correlated with BrAC, r(223) = 0.72, p < 0.001. A one-way ANOVA utilizing the three defined BrAC groups revealed that misperceptions differed across groups, F(2, 220) = 63.61, p < 0.001. Post hoc comparisons using the Fisher LSD test yielded significant differences by BAC group, such that participants in the lowest BAC group slightly overestimated their BAC levels, those in the middle group slightly underestimated their BAC levels, and the highest group considerably underestimated their BAC levels (see Table 1).
Table 1.
Drinking Characteristics by BAC Group
| Characteristic | BAC Group
|
||
|---|---|---|---|
| 1 | 2 | 3 | |
| N (%) | 70 (31.1%) | 95 (42.2%) | 60 (26.7%) |
| BrAC | |||
| Mean (SD) | 0.05 (0.03)b,c | 0.12 (0.02)c | 0.21 (0.05)b,c |
| Range | 0.00 - 0.08 | 0.081 - 0.16 | 0.161+ |
| eBAC | |||
| Mean (SD) | 0.08 (0.06)a | 0.13 (0.07)c | 0.17 (0.11)a,c |
| Range | 0.00 - 0.26 | 0.01 - 0.33 | 0.03 - 0.55 |
| gBAC | |||
| Mean (SD) | 0.07 (0.04)a | 0.10 (0.04)a,b | 0.12 (0.06)a,b |
| Range | 0.01 - 0.20 | 0.01 - 0.30 | 0.01 - 0.25 |
| Mean BAC Misperception Score (SD) | -0.026 (0.05)*** | 0.024 (0.05)*** | 0.088 (0.08)*** |
| Pearson Correlation (r) of BAC Misperception with BrAC | 0.38** | 0.40** | 0.59** |
| Average Reported Standard Drinks at Baseline (SD) | 4.12 (2.79) | 6.77 (3.30) | 8.62 (4.12) |
| Average Drinks per Month (SD) | 46.12 (30.17) | 66.78 (43.32) | 88.59 (50.61) |
| Binge Episodes in Last Month (SD) | 4.22 (3.87) | 5.12 (4.32) | 7.78 (4.82) |
Note: BAC = blood alcohol concentration. BrAC = breath alcohol concentration. eBAC = estimated blood alcohol concentration. gBAC = guesstimated blood alcohol concentration.
BAC groups are defined by BrAC range: Group 1 = 0.00 – 0.08, Group 2 = 0.081 – 0.16, and Group 3 = 0.161 and above.
= significantly different from BrAC at p < 0.05 at least.
= significantly different from eBAC at p < 0.05 at least.
= significantly different from gBAC at p < 0.05 at least.
= significant at the p < 0.01 level.
= significant at the p < 0.001 level.
Between- and Within-Subjects Effects
Repeated measures estimation discovered a BAC measure main effect, F(2, 434) = 12.92, p < 0.001, such that the overall means for BrAC (M = 0.12, SD = 0.07) and eBAC (M = 0.12, SD = 0.09) were not significantly different, but both were significantly greater than the gBAC (M = 0.10, SD = 0.05), ps < 0.001. When gender was entered into the model, a significant main effect emerged, F(1, 217) = 4.33, p < 0.05, such that males typically scored higher than females across BAC measures. BAC measure was also moderated by gender, F(2, 434) = 8.42, p < 0.001. Specifically as illustrated in Figure 1, planned contrasts revealed that among male respondents, BrAC (M = 0.13, SD = 0.07) was significantly (ps < 0.05) higher than both gBAC (M = 0.11, SD = 0.06) and eBAC (M = 0.11, SD = 0.09), but these last two measures were not significantly different from each another. Among female respondents, eBAC (M = 0.13, SD = 0.10), BrAC (M = 0.11, SD = 0.07), and gBAC (M = 0.08, SD = 0.04) were all discovered to be significantly different in contrasts, ps < 0.05. Finally, previous research indicates that females typically underreport their body weight by an average of 5.6 pounds (Betz, Mintz, & Speakmon, 1994). To assess whether female eBAC was inaccurate due to possible underreporting of their body weight, the model was re-analyzed with 5.6 pounds systematically added to all females’ weight. Despite this addition, the same pattern of significant findings emerged, indicating that the observed results were not an artifact of inaccurate reporting of one’s body weight.
Figure 1.
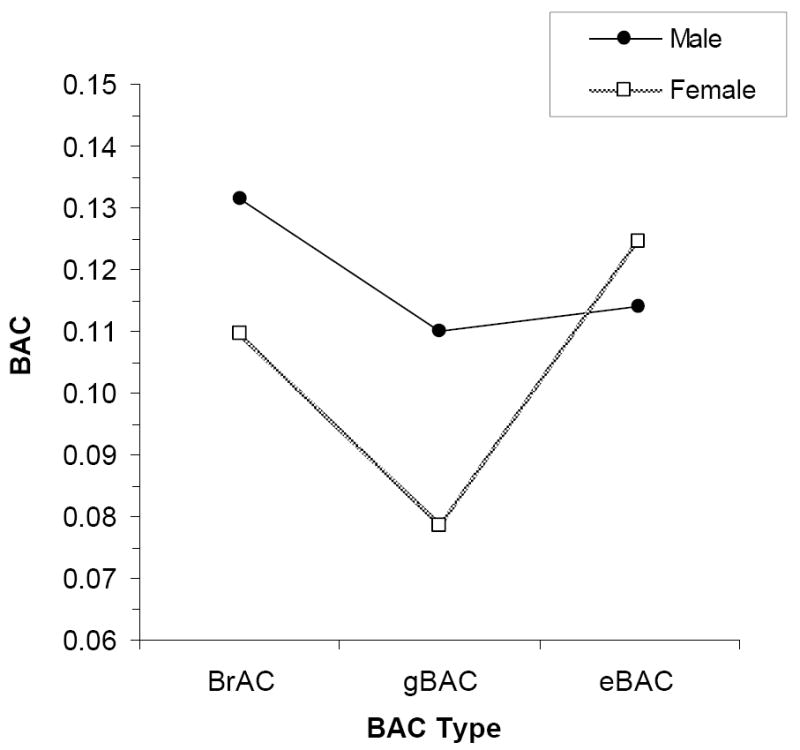
BAC type as moderated by gender.
In Vivo Versus Retrospective eBAC
A paired samples t-test revealed that there were no significant differences between in vivo and retrospective eBAC, t(216) = -.33, p > .05, nor between total drinks self-reported at baseline and at follow-up, t(224) = -.82, p > .05. Moreover, differences were not found between the two eBAC values nor between the total drink variables when analyses were run within each BAC group or within each gender, all p > .05.
Discussion
The present research extends previous work examining the validity of BAC estimates among American college students in social drinking environments (e.g., Clapp et al., 2006; Hustad & Carey, 2005; Thombs et al., 2003). Results showed that participants at lower levels of intoxication tended to slightly overestimate their BAC level, while those at higher levels tended to increasingly underestimate their BAC. In addition, discrepancies among BrAC, gBAC, and eBAC were found as a function of gender. Lastly, differences in eBAC scores were not found based on self-report format (i.e., in vivo versus retrospective methodology).
Findings corroborate previous research demonstrating that BAC misperceptions increase with level of intoxication (Bullers & Ennis, 2006). Furthermore, our data elucidates the relationship between BAC misperceptions and BAC level by revealing a pattern of over- and under-estimation that to some extent resembles the relationship found in Thombs et al., (2003). Results confirm overestimation at low BAC-levels, which may actually have a positive effect on students’ behavior if they curb subsequent drinking due to beliefs that they are more intoxicated than they actually are. In contrast to Thombs et al. (2003), however, we found that even drinkers at a BAC of 0.08 significantly underestimated their BAC, and this underestimation grew considerably larger as BAC increased. These results challenge the validity of BAC guesstimations as indicators of actual intoxication levels.
Discrepancies between eBAC and BrAC raise concern about using estimates from current BAC equations as outcome measures in research identifying changes in drinking patterns over time (Bien et al., 1993; Larimer et al., 2001) or as a source for personalized feedback interventions (Collins et al., 2002; Larimer et al., 2001). One potential reason for inaccuracies of eBACs may be due to equations not taking into consideration delay between last drink and eBAC calculation. As BAC is calculated based on average values, estimates may vary in validity amongst individuals in a population due to individual factors (NHTSA, 1994), one of which may be time since last sip. Comparisons of BrAC, gBAC, and eBAC by gender suggest that these equations may also need to be further adjusted for gender. While previous research assessing the validity of eBAC as an approximation of BrAC has resulted in conflicting conclusions about whether males or females have more accurate eBACs (Hustad & Carey, 2005; Sommers et al., 2000; 2002), our findings suggest inaccuracy by both genders in unique and different ways. Males’ eBACs matched their gBACs, yet both measures were significantly below males’ BrAC. Females, conversely, had eBACs significantly higher than their BrACs, which in turn were higher than their gBACs. In other words, females believed their BAC to be lower than it was, yet their discovered high eBAC scores (even after weight-adjustments in the BAC equation) reveal that they either reported consuming more standard drinks or drinking for fewer hours than actually occurred.
Considering that BAC education informs students how to monitor BAC using demographic factors and drinking behaviors, and that number of standard drinks consumed and duration spent drinking are the only variables that differ across drinking occasions for a particular individual, inaccurate estimations may result from an inability to accurately assess the number of drinks consumed or time spent drinking. In particular, males appear to wrongly perceive or calculate how many standard drinks they have consumed or how long they have been drinking for, yet they can accurately guesstimate their BAC from what they believe their drinking behaviors were. This interpretation is consistent with the finding that students tend to overestimate how much alcohol is in a standard drink (White et al., 2005). Thus, while alcohol may impair males’ memory-recall of recent behaviors (i.e., number of drinks consumed and time spent drinking), males still seem able to retain knowledge on how to guesstimate their intoxication from their perceived drinking behaviors.
For females, in addition to possible errors in self-reports of standard drinks and time spent drinking, gBAC may have been lower than actual BAC because of an unawareness of alcohol’s differential impact on women. Controlling for body weight, women become more intoxicated than men for a given quantity of alcohol due to higher fat, lower water volume/body mass, lower levels of gastric alcohol dehydrogenase, and effects of the menstrual cycle (Neighbors et al., 2003). In contrast, female eBACs may have been higher than actual BAC due to college females’ perceived “reflective” normative preferences of the amount of alcohol they believe men would want female friends or romantic interests to drink. Previous research has shown that females overestimate the amount of alcohol that males want their female friends, dating partners, and sexual partners to drink, and that these misperceptions strongly predict females’ drinking behavior (LaBrie et al., 2009). Given the social and sexual nature of the college drinking environment, females’ self-reports of drinks consumed may incorporate internalized perceptions of their drinking behaviors that slant in a way that they believe would receive positive attention.
That the accuracy of BAC estimates is moderated by gender has important implications for research investigating the modification of BAC equations that are based on self-reported drinking behaviors. Identifying the mechanisms leading to discrepancies between BAC estimates and actual BAC can help researchers increase the external validity of equations created in controlled settings. Seeking to discover why and for whom certain discrepancies among BAC measures occur will extend knowledge specifying what types of estimation (accurate, under-, and overestimation) occur under what circumstances and conditions (Thombs et al., 2003). To assist in this project, college health personnel and administration should seek to better inform students how to keep track of their drinking behaviors while intoxicated. Such knowledge would offer more accurate naturalistic data for research examining BAC estimates (Hustad & Carey, 2005).
In addition to directing future research, these inaccuracies in BAC estimations have important implications for interventions seeking to reduce alcohol-related consequences. Underestimating one’s BAC can place students at serious risk, as students presumably self-assess their intoxication level and then make behavioral decisions based on those perceptions. If decisions while drinking are impaired and based on inaccurate estimations, drinkers may confidently initiate behaviors or entertain situations that they actually cannot safely complete or navigate. For example, as underestimated intoxication and severely impaired driving occur at a BAC of around 0.08, student drinkers may falsely believe that they are safely capable of driving a car. These findings are particularly striking when noting that younger drivers (ages 21-34) are disproportionately represented in alcohol crashes and represent the highest rate of driving with BAC levels over .08% (NHTSA, 2004). If level of intoxication affects ability to assess one’s BAC, then BAC education needs to be adjusted for heavier drinkers who concurrently are more likely to underestimate their level of intoxication and are most at risk for the negative outcomes that BAC education aims to prevent. To provide college drinkers with helpful information on measuring their BAC, these interventions need to particularly focus on informing students that their ability to correctly recall drinking behavior and calculate BAC is significantly more difficult while drinking in social settings than while sober during a lesson. In addition, modifying this education based on the gender of intervention participants may prevent gendered-biases in self-assessment of drinking behaviors and consequently assist students in making safer and more responsible decisions while drinking.
Lastly, and contrary to our final hypothesis, we found that neither eBAC methodology (i.e., in vivo nor retrospective) approximated BrAC better than the other. In addition, differences were not found as a result of intoxication level or self-reported standard drinks, which was surprising considering that as intoxication increases, the accuracy of encoding details is likely to decrease (Williams & Rundell, 1984). These findings suggest that retrospective memory of drinking behaviors appears to be consistent with in vivo recollection among college students. Despite this consistency, students still failed to accurately report their drinking behaviors, according to comparisons with the BrAC data. This suggests that inaccuracies in retrospective drinking data arise from students’ inability to properly estimate drinking behaviors as opposed to issues with memory, further emphasizing the need of prevention and intervention efforts to help students better understand standard drink values so they can accurately assess how much alcohol they are consuming while drinking. Nonetheless, retrospective eBAC may have been even less accurate if the follow-up assessment were more delayed. Error is more likely to be introduced when recreating details of a drinking episode as time increases (Hustad & Carey, 2005). Consequently, research relying on eBAC as an indicator of actual intoxication may wish to assess participants soon after a drinking event to prevent participants from utilizing heuristics or typical drinking patterns rather than specific memories of the event.
Some limitations of the current study should be noted. Firstly, participants may have been heavier drinkers not representative of the general population of college students. Observed high reports of both event-level and general drinking behaviors are expected from a sample recruited from a social drinking environment, especially because environmental factors common to the college drinking culture are related to higher BAC levels, such as large party size and drink specials at bars (Clapp et al., 2006; Thombs et al., 2008). Thus, the current study may be particularly useful for interventions geared toward more at-risk students. Follow-up studies could examine discrepancies among BAC measures with a more representative sample to incorporate more moderate drinkers as well. Another limitation was that factors that can influence alcohol absorption and cognitive abilities (e.g., concurrent drug and food consumption of participants, time from last sip to BAC measurement, pattern of drinking throughout the night) were not included in our model. Because these factors can lead to key differences in predicting BAC from self-reported drinking behaviors, future research examining event-level BAC should incorporate these variables. Moreover, standard drinks were defined as .5oz of alcohol in accord with the Harvard College Alcohol Survey (Wechsler et al., 2002), whereas the NIAAA (2005) definition lists .6oz of alcohol as a standard drink. Using an alternative definition may influence the accuracy of self-reported drinking behaviors and subsequently the validity of eBAC-analyses. Lastly, our study did not assess how much exposure to BAC education participants had received. Future research could investigate (via randomized control trials) whether students, despite receiving BAC education, still have difficulty assessing drinking behaviors and guesstimating their BAC in natural drinking environments. Because multi-component programs that incorporate BAC education have demonstrated efficacy in reducing alcohol use and negative consequences (Hustad et al., 2010; LaBrie et al., 2007; Larimer et al., 2007), such findings would offer insight as to whether the reduced alcohol-related risk resulting from these interventions is partly due to students’ increased ability to monitor their intoxication level.
The current study advances knowledge on self-estimations of alcohol intoxication as one of few investigations in the important yet under-researched area of comparisons between subjective drunkenness measures and biological assessment of intoxication. Findings particularly add to this subject area by systematically collecting event-level BAC and self-report data from drinking college students in a naturalistic setting and by including underage students typically excluded from laboratory studies of eBAC. Results offer further insight into discrepancies of BAC estimations based on gender as well as the accuracy of in vivo versus retrospectively self-reported drinking behaviors. While many multi-component interventions educate students how to estimate BAC in a controlled setting, findings call into question how accurately college students can recall their drinking behaviors or assess their level of intoxication while drinking. Consequently, future research should seek to modify indirect estimates of BAC so that approximations in natural environments yield the same accuracy as approximations in the laboratory.
Acknowledgments
The authors wish to thank the research assistants who assisted in data collection: Greg Wisenberg, Alexandria May, Tristan Sguigna, Brooke Kassel, John Rohrbach, Zach Fenoglio, and Vince Brouwers.
This research was supported by Grant R01 AA 012547-06A2 from the National Institute of Alcohol Abuse and Alcoholism (NIAAA), Grant Q184H070017 from the U.S. Department of Education, and a 2010 Honors Thesis Grant from the Loyola Marymount University Honors Program.
Footnotes
Publisher's Disclaimer: The following manuscript is the final accepted manuscript. It has not been subjected to the final copyediting, fact-checking, and proofreading required for formal publication. It is not the definitive, publisher-authenticated version. The American Psychological Association and its Council of Editors disclaim any responsibility or liabilities for errors or omissions of this manuscript version, any version derived from this manuscript by NIH, or other third parties. The published version is available at www.apa.org/pubs/journals/adb
Contributor Information
Sean Grant, Department of Psychology, Loyola Marymount University, 1 LMU Drive, Suite 4700, Los Angeles, CA 90045; Pn: (310) 338-7770; sgrant3@lion.lmu.edu.
Joseph W. LaBrie, Department of Psychology, Loyola Marymount University, 1 LMU Drive, Suite 4700, Los Angeles, CA 90045; Pn: (310) 338-5238; Fx: (310) 338-7726. jlabrie@lmu.edu
Justin F. Hummer, Department of Psychology, Loyola Marymount University, 1 LMU Drive, Suite 4700, Los Angeles, CA 90045; Pn: (310) 338-7770; jhummer@lmu.edu
Andrew Lac, Department of Psychology, Loyola Marymount University, 1 LMU Drive, Suite 4700, Los Angeles, CA 90045; andrew.lac@cgu.edu.
References
- Babor T, Steinberg K, Anton R, Del Boca F. Talk is cheap: Measuring drinking outcomes in clinical trials. Journal of Studies on Alcohol. 2000;61:55–63. doi: 10.15288/jsa.2000.61.55. [DOI] [PubMed] [Google Scholar]
- Barry A. Using theory-based constructs to explore the impact of Greek membership on alcohol-related beliefs and behaviors: A systematic literature review. Journal of American College Health. 2007;56:307–315. doi: 10.3200/JACH.56.3.307-316. [DOI] [PubMed] [Google Scholar]
- Betz N, Mintz L, Speakmon G. Gender differences in the accuracy of self-reported weight. Sex Roles. 1994;30:543–552. [Google Scholar]
- Bien TH, Miller WR, Boroughs JM. Motivational interviewing with alcohol outpatients. Behavioural and Cognitive Psychotherapy. 1993;21:347–356. [Google Scholar]
- Bullers S, Ennis M. Effects of blood-alcohol concentration (BAC) feedback on BAC estimates over time. Journal of Alcohol and Drug Education. 2006;50:66–87. [Google Scholar]
- Carey KB, Hustad JTP. Are retrospectively reconstructed blood alcohol concentrations accurate? Preliminary results from a field study. Journal of Studies on Alcohol. 2002;3:162–166. doi: 10.15288/jsa.2002.63.762. [DOI] [PubMed] [Google Scholar]
- Clapp J, Min J, Shillington A, Reed M, Lange J, Holmes M. Environmental and individual predictors of error in field estimates of blood alcohol concentration: A multilevel analysis. Journal of Studies on Alcohol. 2006;67:620–627. doi: 10.15288/jsa.2006.67.620. [DOI] [PubMed] [Google Scholar]
- Collins S, Carey K, Sliwinski M. Mailed personalized normative feedback as a brief interention for at-risk college drinkers. Journal of Studies on Alcohol. 2002;63:559–567. doi: 10.15288/jsa.2002.63.559. [DOI] [PubMed] [Google Scholar]
- Cox DJ, Quillian WC, Gressard CF, Westerman PS, Gonder-Frederick LA, Canterbury RJ. The effects of blood alcohol levels on driving variables in a high-risk population: Objective and subjective measures. Journal of Alcohol and Drug Education. 1995;40:84–98. [Google Scholar]
- Dimeff L, Baer J, Kivlahan D, Marlatt G. Brief alcohol screening and intervention for college students (BASICS): A harm reduction approach. New York, NY: Guilford Press; 1999. [Google Scholar]
- Dubowski KM. National Institute on Alcohol Abuse and Alcoholism. The technology of breath-alcohol analysis. Washington, DC: US Department of Health and Human Services; 1991. [Google Scholar]
- Hansson H, Rundberg J, Zetterlind U, Johnsson K, Berglund M. An intervention program for university students who have parents with alcohol problems: A randomized controlled trial. Alcohol and Alcoholism. 2006;41:655–663. doi: 10.1093/alcalc/agl057. [DOI] [PubMed] [Google Scholar]
- Hingson RW, Zha W, Weitzman ER. Magnitude of and trends in alcohol-related mortality and morbidity among U.S. college students ages 18-24, 1998-2005. Journal of Studies on Alcohol and Drugs. 2009;(Suppl 16):12–20. doi: 10.15288/jsads.2009.s16.12. [DOI] [PMC free article] [PubMed] [Google Scholar]
- Hustad J, Barnett N, Borsari B, Jackson K. Web-based alcohol prevention for incoming college students: A randomized controlled trial. Addictive Behaviors. 2010;35:183–189. doi: 10.1016/j.addbeh.2009.10.012. [DOI] [PMC free article] [PubMed] [Google Scholar]
- Hustad J, Carey K. Using calculations to estimate blood alcohol concentrations for naturally occurring drinking episodes: A validity study. Journal of Studies on Alcohol. 2005;66:130–138. doi: 10.15288/jsa.2005.66.130. [DOI] [PubMed] [Google Scholar]
- LaBrie JW. Heads UP, a harm reduction approach to problematic drinking prevention and intervention: A manualized treatment program. Charleston, SC: BookSurge Publishing; 2010. [Google Scholar]
- LaBrie J, Cail J, Hummer J, Lac A, Neighbors C. What men want: The role of reflective opposite-sex normative preferences in alcohol use among college women. Psychology of Addictive Behaviors. 2009;23:157–162. doi: 10.1037/a0013993. [DOI] [PMC free article] [PubMed] [Google Scholar]
- LaBrie J, Pedersen E. Prepartying promotes heightened risk in the college environment: An event-level report. Addictive Behaviors. 2008;33:955–959. doi: 10.1016/j.addbeh.2008.02.011. [DOI] [PMC free article] [PubMed] [Google Scholar]
- LaBrie J, Thompson A, Huchting K, Lac A, Buckley K. A group motivational interviewing intervention reduces drinking and alcohol-related negative consequences in adjudicated college women. Addictive Behaviors. 2007;32:2549–2562. doi: 10.1016/j.addbeh.2007.05.014. [DOI] [PMC free article] [PubMed] [Google Scholar]
- Larimer M, Lee C, Kilmer J, Fabiano P, Stark C, Geisner I, et al. Personalized mailed feedback for college drinking prevention: A randomized clinical trial. Journal of Consulting and Clinical Psychology. 2007;75:285–293. doi: 10.1037/0022-006X.75.2.285. [DOI] [PMC free article] [PubMed] [Google Scholar]
- Larimer M, Turner A, Anderson B, Fader J, Kilmer J, Palmer R, et al. Evaluating a brief alcohol intervention with fraternities. Journal of Studies on Alcohol. 2001;62:370–380. doi: 10.15288/jsa.2001.62.370. [DOI] [PubMed] [Google Scholar]
- Lange J, Voas R. Defining binge drinking quantities through resulting blood alcohol concentrations. Psychology of Addictive Behaviors. 2001;15:310–316. doi: 10.1037//0893-164x.15.4.310. [DOI] [PubMed] [Google Scholar]
- National Center on Addiction and Substance Abuse at Columbia University. Wasting the best and the brightest: Substance abuse at America’s colleges and universities. New York, NY: CASA; 2007. [Google Scholar]
- National Highway Traffic Safety Administration. Computing a BAC estimate. Washington, DC: Department of Transportation; 1994. [Google Scholar]
- National Highway Traffic Safety Administration. Alcohol and highway safety 2001: A review of the state of knowledge (DOT HS 809 383) Washington, DC: Department of Transportation; 2001. [Google Scholar]
- National Highway Traffic Safety Administration. Traffic safety facts 2003: Alcohol (DOT 809 761) Washington, DC: Department of Transportation; 2004. [Google Scholar]
- National Institute of Alcohol Abuse and Alcoholism. Helping patients who drink too much: A clinician’s guide. Washington, DC: US Department of Health and Human Services; 2005. [Google Scholar]
- Neighbors C, Walker D, Larimer M. Expectancies and evaluations of alcohol effects among college students: Self-determination as a moderator. Journal of Studies on Alcohol. 2003;64:292–299. doi: 10.15288/jsa.2003.64.292. [DOI] [PubMed] [Google Scholar]
- O’Malley P, Johnston L. Epidemiology of alcohol and other drug use among American college students. Journal of Studies on Alcohol. 2002;(Suppl 14):23–39. doi: 10.15288/jsas.2002.s14.23. [DOI] [PubMed] [Google Scholar]
- Outside the Classroom. AlcoholEdu® for college. Needham, MA: Outside the Classroom; 2010. [Google Scholar]
- Perkins H, DeJong W, Linkenbach J. Estimated blood alcohol levels reached by ‘binge’ and ‘nonbinge’ drinkers: A survey of young adults in Montana. Psychology of Addictive Behaviors. 2001;15:317–320. [PubMed] [Google Scholar]
- Sommers M, Dyehouse J, Howe S, Lemmink J, Volz T, Manharth M. Validity of self-reported alcohol consumption in nondependent drinkers with unintentional injuries. Alcoholism: Clinical and Experimental Research. 2000;24:1406–1413. [PubMed] [Google Scholar]
- Sommers M, Dyehouse J, Howe S, Wekselman K, Fleming M. ‘Nurse, I only had a couple of beers’: Validity of self-reporting drinking before serious vehicular injury. American Journal of Critical Care. 2002;11:106–114. [PubMed] [Google Scholar]
- Task Force of the National Advisory Council on Alcohol Abuse and Alcoholism. A call to action: Changing the culture of drinking at U S colleges (NIH Pub No 02-5010) Washington, DC: U.S Department of Health and Human Services, National Institutes of Health, Task Force of the National Advisory Council on Alcohol Abuse and Alcoholism; 2002. [Google Scholar]
- Thombs D, Dodd V, Pokorny S, Omli M, O’Mara R, Webb M, et al. Drink specials and the intoxication levels of patrons exiting college bars. American Journal of Health Behavior. 2008;32:411–419. doi: 10.5555/ajhb.2008.32.4.411. [DOI] [PubMed] [Google Scholar]
- Thombs D, Olds R, Snyder B. Field assessment of BAC data to study late-night college drinking. Journal of Studies on Alcohol. 2003;64:322–330. doi: 10.15288/jsa.2003.64.322. [DOI] [PubMed] [Google Scholar]
- Toomey TL, Wagenaar AC. Environmental policies to reduce college drinking: Options and research findings. Journal of Studies on Alcohol. 2002;(Supp 14):193–205. doi: 10.15288/jsas.2002.s14.193. [DOI] [PubMed] [Google Scholar]
- Turner J, Bauerle J, Shu J. Estimated blood alcohol concentration correlation with self-reported negative consequences among college students using alcohol. Journal of Studies on Alcohol. 2004;65:741–749. doi: 10.15288/jsa.2004.65.741. [DOI] [PubMed] [Google Scholar]
- Vaisman-Tzachor R, Lai J. The effects of college tenure, gender, and social involvement on alcohol drinking and alcoholism in college students. Annals of the American Psychotherapy Assn. 2008;11:18–24. [Google Scholar]
- Watson PE, Watson ID, Batt RD. Prediction of blood alcohol concentrations in human subjects: Updating the Widmark equation. Journal of Studies on Alcohol. 1981;42:547–556. doi: 10.15288/jsa.1981.42.547. [DOI] [PubMed] [Google Scholar]
- Wechsler H, Dowdall G, Davenport A, Castillo S. Correlates of college student binge drinking. American Journal of Public Health. 1995;85:921–926. doi: 10.2105/ajph.85.7.921. [DOI] [PMC free article] [PubMed] [Google Scholar]
- Wechsler H, Lee JE, Kuo M, Seibring M, Nelson TF, Lee H. Trends in college binge drinking during a period of increased prevention efforts: Findings from 4 Harvard School of Public Health College Alcohol Study surveys: 1993-2001. Journal of American College Health. 2002;50:203–217. doi: 10.1080/07448480209595713. [DOI] [PubMed] [Google Scholar]
- White A, Kraus C, Flom J, Kestenbaum L, Mitchell J, Shah K, et al. College students lack knowledge of standard drink volumes: Implications for definitions of risky drinking based on survey data. Alcoholism: Clinical and Experimental Research. 2005;29:631–638. doi: 10.1097/01.alc.0000158836.77407.e6. [DOI] [PubMed] [Google Scholar]
- White A, Kraus C, McCracken L, Swartzwelder H. Do college students drink more than they think? Use of a free-pour paradigm to determine how college students define standard drinks. Alcoholism: Clinical and Experimental Research. 2003;27:1750–1756. doi: 10.1097/01.ALC.0000095866.17973.AF. [DOI] [PubMed] [Google Scholar]
- Williams H, Rundell O. Effect of alcohol on recall and recognition as functions of processing levels. Journal of Studies on Alcohol. 1984;45:10–15. doi: 10.15288/jsa.1984.45.10. [DOI] [PubMed] [Google Scholar]
- Williams JG. Experience with alcohol and ability to discriminate legal intoxication status: A Held study. Addictive Behaviors. 1991;16:355–362. doi: 10.1016/0306-4603(91)90029-h. [DOI] [PubMed] [Google Scholar]