

Abstract
Mechanisms influencing the development of olfactory bulb glomeruli are poorly understood. While odor receptors (ORs) play an important role in olfactory sensory neuron (OSN) axon targeting/coalescence (Mombaerts et al., 1996; Wang et al., 1998; Feinstein and Mombaerts, 2004), recent work showed that G protein activation alone is sufficient to induce OSN axon coalescence (Imai et al., 2006; Chesler et al., 2007), suggesting an activity-dependent mechanism in glomerular development. Consistent with these data, OSN axon projections and convergence are perturbed in mice deficient for adenylyl cyclase III, which is downstream from the OR and catalyzes the conversion of ATP to cAMP. However, in cyclic nucleotide-gated (CNG) channel knock-out mice OSN axons are only transiently perturbed (Lin et al., 2000), suggesting that the CNG channel may not be the sole target of cAMP. This prompted us to investigate an alternative channel, the hyperpolarization-activated, cyclic nucleotide-gated cation channel (HCN), as a potential developmental target of cAMP in OSNs. Here, we demonstrate that HCN channels are developmentally precocious in OSNs and therefore are plausible candidates for affecting OSN axon development. Inhibition of HCN channels in dissociated OSNs significantly reduced neurite outgrowth. Moreover, in HCN1 knock-out mice the formation of glomeruli was delayed in parallel with perturbations of axon organization in the olfactory nerve. These data support the hypothesis that the outgrowth and coalescence of OSN axons is, at least in part, subject to activity-dependent mechanisms mediated via HCN channels.
Introduction
During development, newly generated olfactory sensory neurons (OSNs) extend axons toward the presumptive olfactory bulb (OB) where they form the olfactory nerve layer, segregate in an odorant receptor-specific manner, and coalesce into homogeneous glomeruli. The mechanisms underlying these processes remain poorly understood.
The role of functional activity in OSN axon coalescence and glomerular formation remains controversial (Lin et al., 2000; Zheng et al., 2000; for reviews see Zou et al., 2009; Sakano, 2010). Odorant binding to OSNs initiates a transduction cascade, each step of which could affect cellular activity and axon targeting. When odorants bind to an odorant receptor (OR), the coupled G protein α-subunit activates adenylyl cyclase III (ACIII), producing cAMP. The cAMP opens cyclic nucleotide-gated (CNG) channels, resulting in a depolarization. In the absence of the CNG α-subunit, most odorant-evoked responses are lost (Brunet et al., 1996). However, in mice lacking functional CNG channels the OB has comparatively normal morphology (Lin et al., 2000). In contrast, in ACIII knock-out mice glomerular formation is drastically perturbed (Zou et al., 2007), suggesting that cAMP production is important, but that CNG channels may not be the sole target.
Recently, attention shifted toward mechanisms upstream of the CNG channel and their role in axon guidance. Expression of a constitutively active G protein or protein kinase A in OSNs changed the location of OR-specific axon convergence, implicating G protein-mediated cAMP signals in axon convergence (Imai et al., 2006). Chesler et al. (2007) similarly showed that G protein activity was sufficient for axon coalescence, independent of OR expression, with downstream cAMP playing a key role in axonal sorting. Alterations in cAMP production may contribute to the regulation of adhesion molecules mediating axon:axon coalescence (Serizawa et al., 2006).
Alternative cAMP-dependent mechanisms may also be considered. In the hippocampus, the hyperpolarization-activated, cyclic nucleotide-modulated cation channel (HCN) is implicated in developmental mechanisms. HCN channels are heteromers (Chen et al., 2001; Zhou et al., 2004) and how the four HCN subunits combine alters cAMP sensitivity, which determines the dynamics of the hyperpolarization-activated current (Ih), contributing to neuronal excitability (Wainger et al., 2001; Ye and Nerbonne, 2009). In rat hippocampus, HCN subunits are differentially expressed during postnatal development (Brewster et al., 2007); during the first week Ih is extremely sensitive to cAMP, with as little as 10 nm having a significant effect on Ih voltage dependence (Surges et al., 2006). In contrast, in the adult OSN CNG channels are much less sensitive (EC50 of 4.0 μm), although measurements from immature OSNs have not been reported (Frings et al., 1992; Zagotta and Siegelbaum, 1996). Nevertheless, the differential expression of HCN subunits and their sensitivity to cAMP in the developing hippocampus compared to the adult suggests an alternative mechanism that may also regulate OSN activity during early development.
Here, we demonstrate precocious HCN subunit expression in developing OSNs, HCN regulation of neurite extension in vitro, and in HCN1 mutant mice a perturbation of OSN axonal organization in the OB nerve layer and dysregulation of glomerular formation. Our data support the hypothesis that HCN-mediated mechanisms are likely candidates in regulating early developmental events in olfactory system formation.
Materials and Methods
Animals.
HCN1−/− mice (Jackson Laboratories) were bred with C57BL/6 mice (Charles River Laboratories) to obtain heterozygous animals. Heterozygous mice were bred to obtain litters for analysis. HCN1−/− mice were crossed with M72-GFP C57BL/6J mice to obtain HCN1/M72-GFP heterozygotes (where GFP is green fluorescent protein). The heterozygotes were bred to obtain HCN1+/+/M72-GFP homozygotes and HCN1−/−/M72-GFP homozygotes for analysis. Tail tips were taken to confirm genotype with PCR. For embryonic mice, timed pregnant females (day of the vaginal plug = embryonic day 0) were killed using CO2, followed by cervical dislocation. Embryonic and postnatal pups were swiftly decapitated and placed in 4% paraformaldehyde (PFA) in 0.1 m PBS overnight. Mice older than postnatal day (P) 7 were anesthetized with pentobarbital and perfused transcardially with 0.1 m PBS with 1 U/ml heparin followed by 4% PFA and 2 h postfixation in 4% PFA, followed by 0.1 m PBS overnight. Mice required for RNA or protein (CD1; Charles River Laboratories) were asphyxiated with CO2 gas and decapitated. OB and olfactory epithelium (OE) were dissected out separately. Tissue for protein was frozen immediately. Tissue for reverse transcriptase (RT)-PCR was frozen in 1 ml of TRIzol per 100 mg of tissue. B6129SF2/J mice (Jackson Laboratories) were bred to obtain litters for primary tissue culture. Mice were housed in the Yale Animal Facility (New Haven, CT) and their care and use was approved by the Yale University Animal Care and Use Committee.
Electrophysiology.
OEs were isolated from 3- to 4-week-old C57BL/6 male and female mice using a modification of protocols described previously (Bozza and Kauer, 1998). Briefly, mice were deeply anesthetized with isoflurane and decapitated. The head was opened sagittally, and the septum was removed to expose the medial surface of the olfactory turbinates. The OE was dissected out and placed in an oxygenated, divalent-free Ringer solution containing the following (in mm): 145 NaCl, 5.6 KCl, 10 HEPES, 10 d-glucose, 4 EGTA, pH 7.4. The tissue was finely cut and incubated for 10–15 min at 37°C in 3 ml of divalent-free Ringer solution containing 10–20 U/ml papain and 4 mm l-cysteine (Sigma Aldrich). The tissue was then transferred to a normal Ringer solution containing the following (in mm): 138 NaCl, 5 KCl, 1 CaCl2, 1.5 MgCl2, 10 HEPES, 10 d-glucose, pH 7.4, containing 10 μg/ml leupeptin and gently dissociated using a fire-polished Pasteur pipette. Dissociated OSNs were directly plated onto the glass bottom of a perfusion chamber mounted directly on an upright Olympus BX51 microscope, and the cells were allowed to settle for 20 min.
Voltage-clamp experiments were conducted using a dual EPC10 amplifier (HEKA). For recording we used standard patch pipettes with resistance of 5–10 MΩ when filled with an internal solution of the following composition (in mm): 125 KF, 15 KCl, 11 EGTA, 3 MgCl2, 10 HEPES, 5 tetraethylammonium, 4 Na-ATP, adjusted to pH 7.3 with KOH. The osmolarity of the internal solutions was adjusted to 290–305 mOsm. ZD 7288 (Tocris Bioscience) was prepared from a stock solution and bath applied for at least 3 min. We recorded from cells that had the characteristic morphology of OSNs (i.e., dendrite and cilia) (see Fig. 1A). Only recordings from cells that exhibited inward and outward currents at depolarized potentials were included in the analysis. Data analysis was performed using the Patcher's Power Tools (PPT) written for the IGOR Pro software (WaveMetrics). Cells were held at −60 mV and the peak current was measured within the last 10 ms of the hyperpolarizing step. The normalized whole-cell conductance (G/Gmax) was fitted using the Boltzmann equation as described in the PPT macros.
Figure 1.

Hyperpolarization-activated inward currents in dissociated mouse OSNs. A, Whole-cell recording in an acutely dissociated OSN; the arrow points to protruding cilia from the dendritic knob. B, Cells exhibit characteristic fast inward (asterisk) and late outward currents elicited by depolarizing steps (20 mV increments). C, Hyperpolarization-activated currents were elicited by voltage steps in 10 mV increments from −160 mV; only every other step is shown. D, The normalized conductance (G/Gmax) was fitted to a Boltzmann equation; the value of V1/2 = 130 ± 10 mV. E, The inward current was larger when the extracellular concentration of K+ was increased. The inset shows currents obtained with a hyperpolarizing step to −160 mV (filled circles, 5 mm; empty circles, 25 mm extracellular K+). F, The inward current was reduced by ZD 7288 (30 μm) at all potentials tested in this cell. The inset shows currents obtained with a hyperpolarizing step to −200 mV (filled squares, control; empty squares, in ZD7288). The holding potential is −60 mV. The calibration bar is 20 ms and 100 pA for B, 200 ms and 100 pA for C, 100 ms and 100 pA for the inset in E, 100 ms and 20 pA for the inset in F.
RT-PCR.
OE from CD1 mice at embryonic day (E) 13, E15, E17, P0, and P4 was extracted using sterile technique, placed in 1 ml of TRIzol (Invitrogen) for each 100 mg of tissue, and homogenized. RNA was purified from the tissue following the TRIzol protocol. Contaminating DNA was removed using TURBO DNA-free (Ambion). Synthesis of cDNA was completed using the SuperScript III First Strand kit (Invitrogen). The DNA gene sequences published on National Center for Biotechnology Information (NCBI) for HCN1, HCN2, and HCN4 were analyzed using PerlPrimer free software to select primers that were verified in NCBI/BLAST (basic local alignment search tool) for sequence matches. A primer to β-actin was used as a control for RT-PCR and gel loading. Primers for each gene of interest were combined with mouse cDNA for PCR along with controls for each cDNA source made without the reverse transcriptase enzyme. The primers were as follows: HCN1 forward primer, 5′-GAAATGGTTAATGATTCCTGGG-3′; HCN1 reverse primer, 3′-CGAAAGGGAGTAAAGACGAC-5′; HCN2 forward primer, 5′-GACTTCAGGTTCTACTGGGAC-3′; HCN2 reverse primer, 3′-CATGTTGTTGATGGACACCC-5′; HCN4 forward primer, 5′-GCAAGATGTTTGATGAGGA-3′; HCN4 reverse primer, 3′-ATGTGGAAGGAGGATGAAGAC-5′; actin forward primer, 5′-GTGGGCCGCTCTAGGCACCAA-3′; actin reverse primer, 3′-CTCTTTGATGTCACGCACGATTTC-5′. Primers combined with cDNA and PlatinumBlue PCR Supermix (Invitrogen;) were annealed at 53°C, transcribed at 72°C and repeated 30 times for amplification. PCR product was run on agarose gels [2% agarose in 1× TAE (0.04 m Tris, 0.004 m acetate, 0.001 m EDTA)].
For genotyping HCN1 heterozygous litters, tails were digested in 50 mm NaOH for 1 h at 100°C. Digestion was stopped by adding Tris-HCl, and the DNA was combined with primer sequences obtained from The Jackson Laboratory.
Quantitative Western blots.
Freshly dissected OE was homogenized in lysis buffer [1× Complete protease inhibitor cocktail tablet (Roche, 1 mm EDTA, pH 8, 1% SDS, 10 mm Tris-Cl, pH 7.4), sonicated on ice for 10 min, ground with a pestle for 1 min, and incubated for 5 min at 100°C. Protein concentration was determined by Bradford assay using Coomassie Plus protein assay reagent (Thermo Scientific) measured in a Gene Quant Pro spectrophotometer (GE Healthcare). Equal quantities of each protein sample were boiled in Laemelli buffer (67.5 mm Tris-HCl pH 7.4, 2.3% SDS, 10% glycerol, 5% β-mercaptoethanol, 0.017% bromophenol blue), at 70°C for 10 min, resolved using 4–15% SDS-PAGE (Bio-Rad), and transferred to nitrocellulose membranes (Bio-Rad). Membranes were incubated at room temperature for 1 h in a blocking buffer containing 5% nonfat powdered milk, 2.5% BSA in TBS-T (100 mm Tris-Cl, pH 7.4, 150 mm sodium chloride, 0.3% Tween 20), followed by incubation with either rabbit anti-HCN1 (Millipore), guinea pig anti-HCN2 (generous gift from Dr. Ryuichi Shigemoto, National Institute for Physiological Sciences, Myodaiji, Japan), rat anti-HCN4 (Abcam), or mouse anti-β-actin (Abcam) in blocking buffer and kept at 4°C overnight. After washing with 5% nonfat powdered milk in TBS-T, the membranes were incubated with horseradish peroxidase-conjugated secondary antibody (Jackson ImmunoResearch) for 1 h at room temperature. Immunoreactive bands were detected by ECL Western blotting detection reagents (GE Healthcare). Molecular weights were determined using BenchMark prestained protein ladder (Invitrogen). Re-Blot Plus-Strong (Millipore) was used for stripping antibodies from a membrane. ImageJ gel analyzer tool (National Institutes of Health, Bethesda, MD; http://rsb.info.nih.gov/ij/) was used to integrate the signal measured from scanned images of the film to determine the ratio of HCN to β-actin in each lane.
Primary cell cultures.
Eight-well culture slides were coated with 50 μm poly-d-lysine for 1 h then rinsed with distilled H2O. P1-P2 pups were killed by decapitation; the OE was removed from the septum in HBSS (Invitrogen). Tissue was dissociated using the Worthington papain dissociation kit (Worthington Biochemical) for 1 h at 37°C in a 5% CO2 incubator. After trituration using a fire-polished glass pipette, dissociated cells were separated from fragments of OE using a gradient (Worthington papain kit), plated in Neurobasal media (Invitrogen), and grown for 24 h at 37°C in 5% CO2. Drugs (1–20 μm loperamide or 5–30 μm ZD7288) were added to the cells and allowed to incubate another 24 h, followed by fixation with 4% PFA in 4% sucrose twice for 15 min. Immunohistochemistry was performed as described below with primary antibody rat anti-neuronal cell adhesion molecule (NCAM) (1:500; Millipore), Alexa Fluor 488 phalloidin (Invitrogen), and the nuclear marker DRAQ5 (1:500; Biostatus). Cell measurements were obtained using HCA-Vision, V1.7.3 (CSIRO Biotech Imaging).
Immunohistochemistry.
Fixed tissue was cryoprotected in 30% sucrose in 0.1 m PBS overnight and then transferred to OCT, rapidly frozen in a slurry of dry ice and ethanol, and stored at −80°C until used. Serial sections (20 μm thick) of the OE and OB were collected on Superfrost Plus slides (VWR) and stored at −20°C until used. Slides were heated to 37°C for 10 min, blocked in wash buffer (0.1 m PBS, 2% BSA, 0.3% Triton X-100) for 30 min, and incubated in the following primary antibodies at 4°C overnight; chicken antibody: anti-MAP-2 at 1:1000 (Millipore); rabbit antibodies: ACIII at 1:250 (Santa Cruz Biotechnology), growth-associated protein 43 (GAP43) at 1:1000 (Novus), HCN1 at 1:250, peripherin at 1:2000 (Millipore), olfactory cell adhesion molecule (OCAM) 1:500 (generous gift from Dr. Yoshihiro Yoshihara, RIKEN Brain Science Institute, Wako, Japan), and vesicular glutamate transporter 2 (VGlut2) at 1:2000 (Synaptic Systems); rat antibodies: HCN4 at 1:500 (Abcam), HCN4 at 1:1000 (Alomone) and NCAM at 1:1000 (Millipore); goat antibodies: olfactory marker protein (OMP) at 1:1000 (Wako Pure Chemical Industries) and neuropilin 1 (Nrp1) at 1:750 (R&D Systems); guinea pig anti-HCN2 at 1:1000 (generous gift from Dr. Ryuichi Shigemoto); rabbit anti-HCN2 (HCN2β); and guinea pig anti-HCN4 (HCN4γ) (F.M.). After rinsing in wash buffer, slides were incubated with fluorescent secondary antibodies (donkey anti-rabbit Alexa Fluor 488 or Alexa Fluor 555; donkey anti-rat Alexa 594; donkey anti-goat Alexa Fluor 488 or Alexa Fluor 555; donkey anti-guinea pig Alexa 488; all used at 1:1000 and all from Invitrogen) and nuclear stain DRAQ5 at 1:1000 (Biostatus) for 1 h at room temperature, rinsed and coverslipped with BioMeda Gel-Mount (Electron Microscopy Sciences).
Imaging.
Cell culture images were captured on an Olympus BX51 fluorescent scope and camera. All other images were taken as single plane images on a Leica confocal microscope except for the images in Figure 10, which are z-stacks. Image brightness, contrast, or levels were adjusted using Photoshop CS (Adobe Systems) but not altered or manipulated. Image plates were constructed using CorelDRAW 12 (Corel) or Adobe Illustrator CS2 (Adobe Systems). For whole mount confocal imaging, fixed P10 brains from HCN1−/−/M72-GFP or HCN1+/+/M72-GFP mice were embedded in 2% agarose for stability without covering the dorsal OB surface. A 40× water-immersion objective in 0.1 m phosphate buffer was used to scan each M72+ glomerulus using 0.5 μm z-steps.
Figure 10.
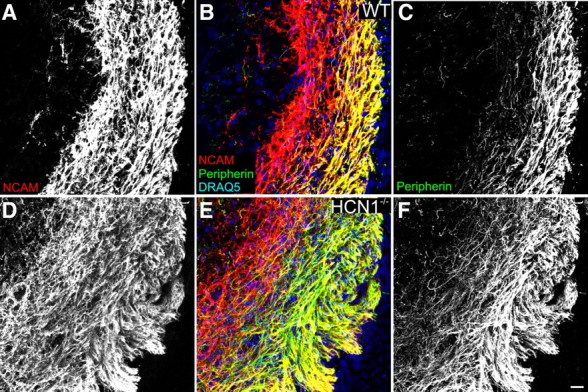
HCN1−/− peripherin-positive OSN axons are not confined to the outer nerve layer of the developing OB. A–C, OSN nerve layer from WT mice. NCAM (red) labels OSN axons of the inner and outer nerve layer, while peripherin (green) labeling is restricted to the outer nerve layer; nuclear marker DRAQ5 is in blue. D–F, In HCN1−/− mice peripherin-labeled axons crossed into the inner nerve layer. Scale bar for A–F (in F), 50 μm.
Olfactory bulb measurements.
Glomerular area was determined by outlining the glomeruli and using the Measure and Label Plugin in ImageJ. Glomeruli were outlined based on VGlut2 and NCAM labeling from matched rostral, intermediate, and caudal sections of the OBs from HCN1−/− and wild-type (WT) littermates. The number of glomeruli outlined was summed across sections. Regional distribution was determined by placing two lines crossing at 90° angles over the OB image. A linear aggregate index was compiled by placing 20° divisions centered over an OB image. The number of glomeruli crossed by each division line was counted. Images of OSN axons, labeled with NCAM and peripherin, were compared by placing 60° divisions centered over an OB image. Where the division line crossed the nerve layer, the intensity ratio of peripherin:NCAM were measured at 10% increments in a line perpendicular to the mitral cell layer using the ImageJ Plot Profile tool. The average of the means from the last two measurements (90, 100%) was compared to determine significance. For wholemount measurements, fixed P10 M72-GFP brains embedded in 2% agarose were imaged at 4× under an Olympus BX51 fluorescent scope and camera. Images were analyzed using the ImageJ Measure and Label plugin and the Analyze/Measure feature. First, a line was drawn between the OBs and the cortex. Next, a line perpendicular to the first line was drawn between the OBs. The point where the two lines crossed is referred to as the intersect point. Medial angles are defined as the angle from the intersect point to the medial glomerulus to the contralateral medial glomerulus. Lateral angles are defined as the angles from the ipsilateral medial glomerulus to the lateral glomerulus to the contralateral lateral glomerulus. Distances were measured by drawing a line between the ipsilateral lateral and medial glomeruli or medial to medial glomeruli.
To determine the distance from the beginning of the accessory olfactory bulb (AOB) to the M72-GFP glomerulus, consecutive 20 μm sections from P21 fixed, frozen OBs were stained with rat anti-NCAM (1:1000; Invitrogen). P14 WT or HCN1−/− mice were stained with NCAM and rabbit anti-MOR28 (generous gift from Dr. Richard Axel, Columbia University, New York). The number of sections between each of the four M72-GFP or MOR28 glomeruli to the first section showing AOB was counted to determine the distance (number of sections multiplied by 20 μm).
Results
Acutely dissociated mouse olfactory sensory neurons exhibited characteristic morphology, including an intact dendrite from which cilia extended (Fig. 1A). Depolarizing steps from −60 mV elicited a fast inward and a slow outward current (Fig. 1B). These currents were previously described in OSNs, correspond to Na+ and K+ currents, and need not be described further here (Lagostena and Menini, 2003). More importantly, hyperpolarizing steps (250–500 ms) induced a slowly activating inward current (Fig. 1C). The maximal current at −160 mV was −39.7 ± 5.8 pA (n = 10). The normalized conductance was maximal at membrane potentials more negative than −160 mV and could be fitted to a Boltzmann distribution with a V1/2 = −130 ± 10 mV and a slope factor of 16 ± 4 mV (n = 3) (Fig. 1D). The hyperpolarization-activated inward current was larger when the extracellular concentration of K+ was increased; in 25 mm K+ the inward current was −119 ± 3 pA (n = 3; −160 mV) (Fig. 1E). Furthermore, the selective HCN inhibitor ZD7288 (30 μm) significantly reduced the current by 45 ± 11% (−200 mV; p < 0.02; n = 4) (Fig. 1F). Together, these results are consistent with a hyperpolarization-activated current, Ih, in mouse OSNs. The properties of the mouse OSN Ih are similar to those described previously in rat OSNs and mouse vomeronasal sensory neurons (Lynch and Barry, 1991; Vargas and Lucero, 1999; Dibattista et al., 2008).
To determine the developmental pattern of HCN channels in mice, we first assessed mRNA expression at time points chosen for their significance within the developmental timeline of the olfactory system (Treloar et al., 2009). At embryonic day E13 OSN axons are sorting and contacting the presumptive OB. By E15 axons are growing into the dendritic zone of the OB, and by E17 protoglomeruli are emerging. At postnatal day P0 small discrete glomeruli can be seen. By P4 the glomeruli are larger in size and more mature. We focused our study on the HCN subunits reported to have increased kinetics or amplitude in the presence of cAMP: HCN1, HCN2, and HCN4 (Chen et al., 2001; Surges et al., 2006). At each time point, primers specific to each subunit demonstrated mRNA expression of HCN1, HCN2, and HCN4 in the OE (Fig. 2A).
Figure 2.
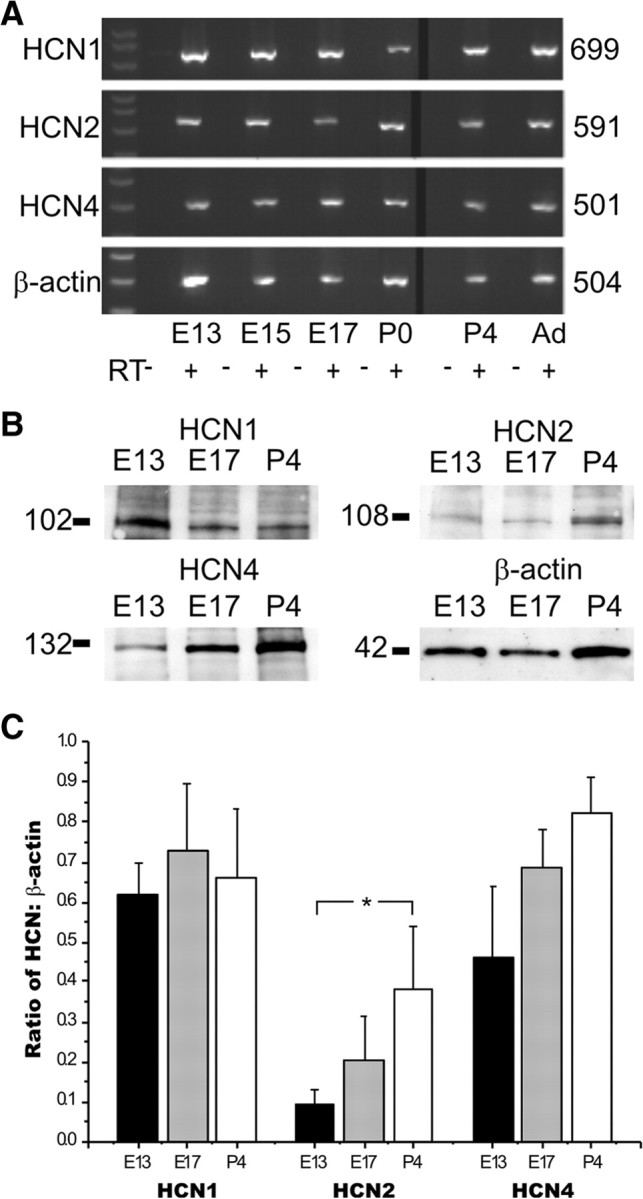
HCNs are present in the OE during the early development of the olfactory system. A, RT-PCR from mouse OE for HCN1, 2, and 4. Numbers to the right are nucleotide length. Ad, Adult. B, Western blots from mouse OE. Numbers to the left are molecular weights. C, Quantification of protein levels across embryonic development for each HCN subunit. Asterisk indicates p < 0.05. Error bars, SEM.
We confirmed that the HCN channel subunit proteins were present in the OE using immunoblots. HCN1, HCN2, and HCN4 are all expressed in the OE at E13, E17, and P4 (Fig. 2B). We identified the unglycosylated 102 kDa form of HCN1, the glycosylated 108 kDa form of HCN2, and the unglycosylated 132 kDa form of HCN4, as previously reported in retina (Müller et al., 2003). In the hippocampus, each HCN subunit has a unique developmental pattern of expression. For example, HCN4 is implicated in early developmental events, but was down regulated at later stages, reflecting kinetic properties of the neurons (Surges et al., 2006). Interestingly, in the OE, HCN2 levels increased significantly between E13 and P4 (Fig. 2C), suggesting that the kinetics of the OSN HCN channel may change during this timeframe, perhaps due to ongoing developmental events. Quantitative analysis showed that there were no significant developmental changes in HCN1 or HCN4 subunit expression (Fig. 2C).
The pseudostratified mature OE consists, from apical to basal, of a layer of sustentacular cells, mature OSNs, immature OSNs, and horizontal and basal cells. We used immunohistochemistry to identify which cell types in the OE expressed HCN channels throughout development. At E13 HCN1, HCN2, and HCN4 colocalize with GAP43, a marker of immature OSNs, throughout the OE (Fig. 3A–A″). By E15, colocalization of GAP43 and the HCN subunits was restricted to the basal (immature) half of the OE (data not shown). At E17, HCN subunit expression became more prominent in the apical (mature) layer of the OE and by P2 no longer showed robust colocalization with GAP43, except within the axons (Fig. 3B–B″; supplemental Figs. 1, 2, available at www.jneurosci.org as supplemental material). Double-labeling with OMP, a marker of mature OSNs, showed that at P2 HCN channel subunit expression was limited to mature OSNs (Fig. 3C–C″). There was no evidence of HCN expression in the sustentacular cells or basal cells. We did not find evidence of HCN subunit segregation in different cell populations within the OE. HCN channel subunit expression was homogeneous in mature OSNs across the OE (Fig. 4). Interestingly, beginning at E13 and at all ages examined, HCN channel subunits colocalized with ACIII. For example, even at E15 when very few cells express ACIII, all ACIII+ cells were HCN+, suggesting that HCN channels are expressed in cells that include functional members of the cAMP pathway (supplemental Fig. 3, available at www.jneurosci.org as supplemental material).
Figure 3.
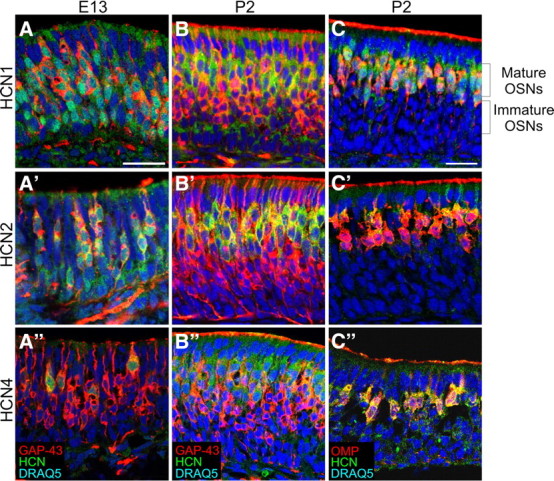
HCN subunits are present in immature, developing OSNs at E13 and colocalize with GAP43. At P2, some colocalization (yellow) with GAP43 persists with HCN2 and HCN1. However, primarily HCN and OMP are coexpressed in the mature OSNs (OMP+) which are located apically in the epithelium. A–A″, E13; GAP-43. B–B″, P2; GAP-43. C–C″, P2; OMP. A–C, HCN1. A′–C′, HCN2. A″–C″, HCN4. Scale bars, 25 μm; scale bar in A applies to A–B″; scale bar in C applies to C–C″.
Figure 4.

HCN subunits are coexpressed in OSNs at P2. A, HCN1 (green). B, HCN2 (blue). C, HCN4 (red). D, RGB image of A–C. Scale bar, 25 μm (in A).
Functional activity is repeatedly implicated as an important determinant in the extension and arborization of axons (Williams and Cohan, 1995; Zhao and Reed, 2001; Hanson and Landmesser, 2004; Yu et al., 2004; Singh and Miller, 2005; Zou et al., 2007). To determine whether Ih influences OSN neurite extension, as implied by its early expression in developing OSNs, we cultured primary dissociated OSNs from P1-P2 CD1 mice in the presence or absence of two different HCN channel inhibitors and measured the effect on neurite outgrowth and branching. Cultured OSNs were immunoreactive for the neuronal marker NCAM, the OSN markers OMP and ACIII (supplemental Fig. 4, available at www.jneurosci.org as supplemental material), and the HCN channel subunits (Fig. 5A–C). In the presence of either 5–30 μm ZD7288 or 1–20 μm loperamide, two HCN channel inhibitors (Gasparini and DiFrancesco, 1997; Vasilyev et al., 2007; Lee et al., 2008), we found a significant dose-dependent decrease in both total neurite outgrowth and branching (Fig. 5H–M). Control experiments with loperamide's diluent, methanol, did not affect neurite outgrowth or branching (data not shown).
Figure 5.

HCNs are present in cultured primary OSNs. Incubation with the HCN channel blocker loperamide or ZD7288 reduces neurite outgrowth and branching. A–C, Cultured primary OSNs labeled with HCN1 (A), HCN2 (B), and HCN4 (C). D–G, Primary cultured OSNs labeled with NCAM. D, OSNs cultured in control conditions. E, OSNs cultured with 20 μm loperamide. F–G, High magnification of boxed areas in D and E, respectively. H, Total neurite length (all neurite segments). I, Number of mean branch layers (1°, 2°, or 3° neurites). J, Number of branch points. K, Number of neurite roots. L, Number of extremities. M, Neurite field area. Scale bars: A–E, 10 μm; F, G, 2 μm. Error bars, SEM. *p < 0.05, statistically significant difference from controls.
The growth cone is a dynamic, actin-supported extension of the developing axon with a unique morphology characterized by filopodia and lamellipodia. As shown in Figure 5, D–G, growth cones in loperamide-treated cultures appeared collapsed while those in controls appeared broadly spread, suggesting an “active” profile. These data support the hypothesis that HCN channels are necessary for normal axon outgrowth and branching, as well as maintaining a mature growth cone.
To test in vivo the effects of HCN channels on OSN axon behavior and targeting to the OB, we acquired the HCN1-targeted mutant mice in which the exon encoding the p region and S6 transmembrane (pore-S6) domain was deleted using the loxP system. We hypothesized that in the absence of HCN1, the subunit with the fastest kinetics (Wainger et al., 2001; Surges et al., 2006), cAMP-dependent activity would be altered in the OSNs, resulting in developmental errors. We first repeated our in vitro assay of neurite outgrowth in primary cultures of OSNs from the HCN1 mutant mice (HCN1−/−) and their controls (B6129SF/2). As seen in Figure 6, total neurite length in the HCN1−/− mice relative to the B6129SF/2 controls is reduced. Loperamide (20 μm) or ZD7288 (30 μm) further reduced neurite outgrowth in the HCN1−/− mice (36% reduction) to levels similar to those of controls (46% reduction). The decreased neurite outgrowth in the HCN1−/− mice relative to controls and its mutual reduction in response to HCN channel blockers are consistent with the findings in the CD1 mice and support the hypothesis that HCN channels contribute to OSN neurite outgrowth.
Figure 6.

Cultured primary OSNs from control and HCN1−/− mice challenged with 20 μm loperamide or 30 μm ZD 7288. Cells from HCN1−/− mice have significantly reduced neurite length compared to cells from B6129SF/2 mice (Student's t test, p < 0.05) in control conditions. In control mice loperamide and ZD 7288 reduce neurite outgrowth 46% (ANOVA, p < 0.0001). In HCN1−/− mice the effect is only 36% (ANOVA, p < 0.01), suggesting that HCN channels are responsible for the inhibitor effect. Error bars, SEM.
Based on our data from in vitro dissociated OSNs derived from the HCN1−/− mice (Fig. 6), we predicted that there would be aberrations in the organization of OSN axons and their coalescence in vivo. To assess glomeruli we used double labeling for NCAM, which ubiquitously labels OSN axons, and VGlut2, which labels the OSN axon glomerular synapses. Indeed, glomerular formation in the HCN1−/− mice was developmentally retarded. At E17 the formation of protoglomeruli in the HCN1−/− was delayed relative to WT littermate controls (Fig. 7A,B). In the HCN1−/− mice, VGlut2-positive axons in the glomerular layer appeared reduced, and there were fewer defined protoglomeruli. As is evident in Figure 7, in controls the spherical protoglomeruli are easily distinguished from the overlying nerve layer. In the HCN1−/− mice, however, the VGlut2 staining is irregular and sparse, with little evidence of protoglomerular formations. By P4, well delineated and mature glomeruli were present in the WT mice (Fig. 7C,E). In the HCN1−/− mice glomeruli could be identified at P4 (Fig. 7D), but many appeared morphologically abnormal and not circumscribed (Fig. 7D,F). It is notable that mature glomeruli, those well delineated by axon fascicles from the overlying olfactory nerve layer, were absent in the HCN1−/− mice (compare Fig. 7, E vs F). Examination of VGlut2 staining in adult HCN1−/− mice showed that the delay in convergence was resolved, although intrinsic organization of the glomerular layer remained irregular and glomeruli are morphologically abnormal (Fig. 8).
Figure 7.
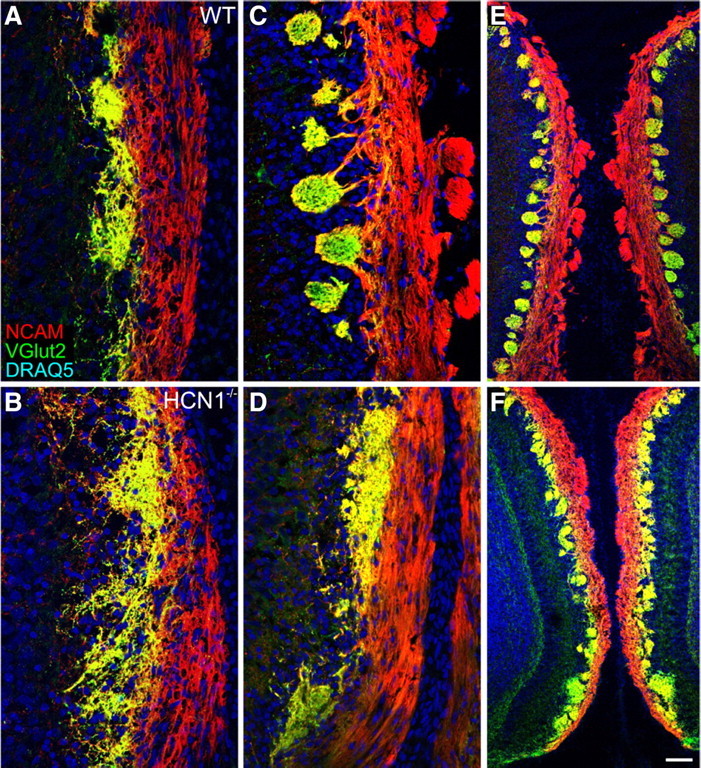
HCN1−/− mice have delayed glomerular formation. A, B, At E17 protoglomeruli normally seen in WT mice (A) have yet to form in HCN1−/− mice (B). C–F, At P4 glomeruli can be seen in WT and HCN1−/− mice. However, in the HCN1−/− mice glomeruli are poorly formed and lack discrete boundaries (D, F). Scale bar (in F), 100 μm in A–D; 200 μm in E and F.
Figure 8.
Glomerular layer abnormalities persist in adult HCN1−/− mice. A, WT mice have discrete, round glomeruli. B, HCN1−/− mice have irregularly shaped glomeruli that are not well circumscribed. Scale bar for A and B (in A), 25 μm.
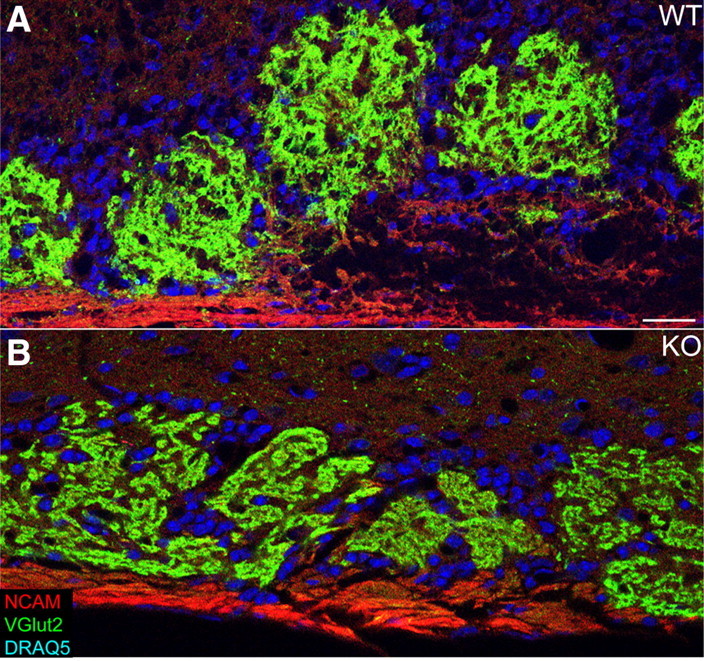
We quantified the glomerular layer with counts of VGlut2-labeled foci/glomeruli in matched sections from P4 WT and HCN1−/− littermate controls. Despite the aberrant appearance of the glomeruli in the HCN1−/− mice, we did not find a statistically significant difference in the overall number of glomerular-like structures or in their regional distribution. Next, we examined the variation in size and morphology of glomeruli in WT and HCN1−/− mice. We compared the area, perimeter, and circularity of the glomeruli and found that glomeruli from the dorsal OB of HCN1−/− [knock-out (KO)] mice were significantly larger than those in WT animals (area = 195.7 ± 8.8 μm2 WT, 220.7 ± 8.4 μm2 KO; p < 0.05) (Fig. 9A). No significant differences were observed in perimeter or circularity measurements. Next, we divided the OB into 20° segments and measured how many glomeruli each segment divider crossed in the glomerular layer. The number of glomeruli crossed at each division was significantly greater in HCN1−/− mice compared to the WT mice (0.83 ± 0.04 versus 0.72 ± 0.04, respectively; p < 0.05) (Fig. 9B), showing that in the HCN1−/− mice more glomeruli are radially stacked, contributing to atypical lamination of the glomerular layer.
Figure 9.
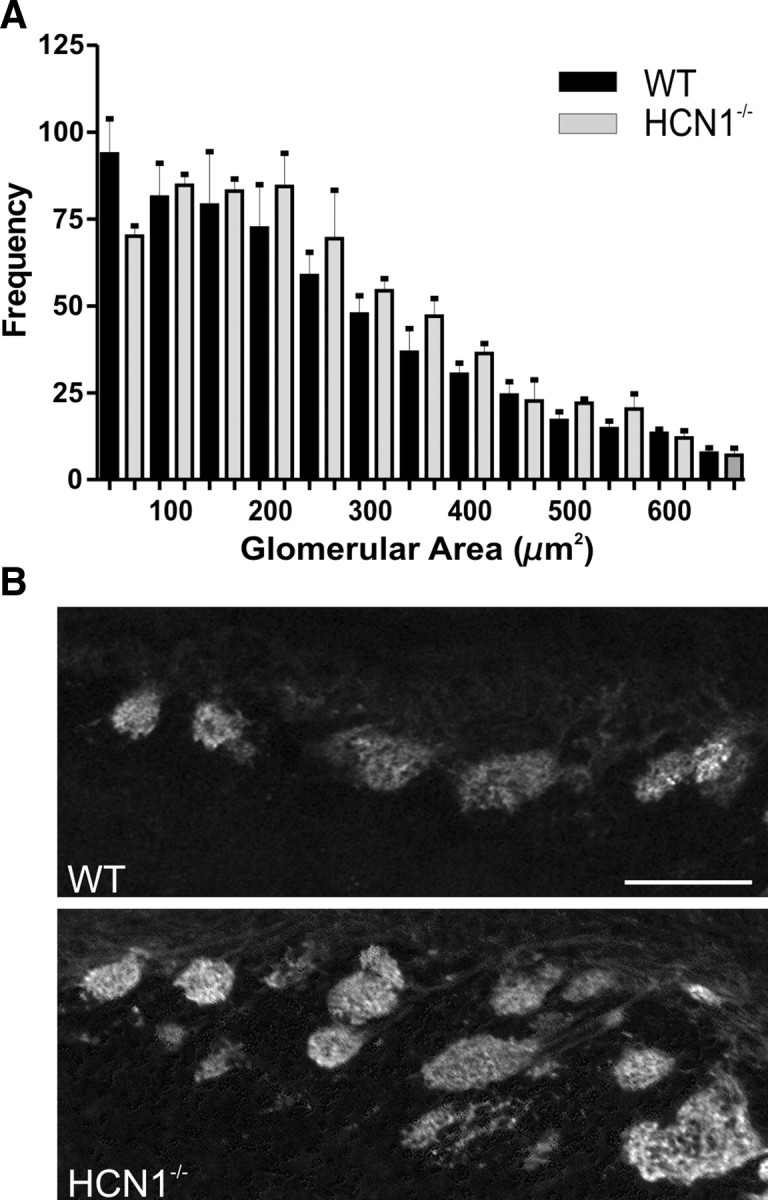
Glomerular size and distribution are perturbed in P4 HCN1−/− mice. A, Binned distribution shows the frequency of glomerular area (μm2) among dorsal glomeruli in WT and HCN1−/− mice. B, VGlut2-labeled sections from similar regions in WT and HCN1−/− mice; note the radial stacking of glomeruli in the HCN1−/− mice. Scale bar, 100 μm. Error bars, SEM.
The aberrant appearance of the glomeruli in the HCN1−/− mice and the in vitro analysis of OSN neurite extension suggested that organization within the nerve layer may contribute to the overall phenotype in the HCN1−/− mice. Although our in vitro analyses demonstrated decreased outgrowth of OSN axons in the HCN1−/− mice and following application of HCN channel blockers, at E13 in vivo OSN axons have reached the OB and have begun to form an olfactory nerve layer (supplemental Fig. 5, available at www.jneurosci.org as supplemental material). However, the organization of the nerve layer is abnormal in HCN1−/− mice, and the division of the inner and outer nerve layers of the OB is perturbed. Peripherin immunoreactivity, a marker of type III intermediate filament protein, is normally limited to the outer nerve layer, whereas NCAM labels both the inner and outer nerve layers (Fig. 10A–C). However, in HCN1−/− mice peripherin-labeled axons were broadly dispersed across both the outer and inner nerve layers at E17 (Fig. 10D–F). In WT mice there was a consistent decrease in the peripherin:NCAM ratio measured across the outer to inner nerve layer, while in HCN1−/− mice peripherin-labeled axons persisted deeply into the inner nerve layer. These were most pronounced in the dorsolateral rostral OB (240°; WT 0.61 ± 0.008; HCN1−/− 0.80 ± 0.04), the ventral caudal OB (0°; WT 0.35 ± 0.05; HCN1−/− 0.74 ± 0.07), and the dorsolateral caudal OB (240°) at E17 (WT 0.47 ± 0.14; HCN1−/− 0.76 ± 0.08) (supplemental Fig. 6, available at www.jneurosci.org as supplemental material). This phenotype persisted to P4; analyses of the ventral-lateral aspect (300°) of the nerve layer in the caudal OB showed a significant difference in the peripherin:NCAM ratio in HCN1−/− mice relative to WT mice (WT 0.67 ± 0.05; HCN1−/− 1.12 ± 0.05). These data support the hypothesis that a disruption of normal axon extension and coalescence in the nerve layer contributes to the perturbation in glomerular formation in the HCN1−/− mice.
OSN axon projections to the OB are regionally organized; molecular markers, some with known functional roles in axon guidance, have been used to map a broad topography from the OE to the OB (de Castro et al., 1999; Lipscomb et al., 2003; Suto et al., 2003; Gussing and Bohm, 2004; Schwarting et al., 2004; Walz et al., 2006; Cho et al., 2007). We used three markers, NQO1, OCAM, and Nrp-1 to test regional organization in the HCN1−/− mice but found no significant differences in staining patterns (supplemental Fig. 7, available at www.jneurosci.org as supplemental material). Thus, while glomerular formation is perturbed, regional topography between the OE and OB appears preserved in the HCN1−/− mice.
Finally, we asked whether the glomerulus for a single OR was affected by the deletion of HCN1. To determine whether the position of glomeruli shifted in the HCN1−/− mice we measured the distance of two ORs, MOR28 (P14) and M72 (P21), from the accessory olfactory bulb, a fixed structure located in the most dorsal-caudal OB. The dorsomedial MOR28 glomeruli had a significant change in location in HCN1−/− mice compared to WT mice (Fig. 11A). The four MOR28 glomeruli in WT mice were all found rostral to the first section containing AOB, while in HCN1−/− mice the MOR28 glomeruli were all caudal to the first AOB section. There was no significant change in the location of the four M72 glomeruli compared to WT littermates (supplemental Fig. 8, available at www.jneurosci.org as supplemental material), nor did we observe multiple glomeruli at any location or heterozygous glomeruli for either OR (not quantified). Next, we examined coalescence of MOR28+ axons at P0 in the glomerular layer by measuring pixel intensity from images taken from three consecutive sections. The MOR28+ axons in WT and HCN1−/− mice appeared to coalesce similarly, and pixel intensity values were not significantly different (p > 0.05) (Fig. 11B–E). Similarly, coalescence of M72+ axons was not significantly different between WT and HCN1−/− mice (data not shown). The MOR28 OR is among the first to appear in the developing OE, around E9, with robust protein expression by E13 (Rodriguez-Gil et al., 2010). Thus, OSNs express MOR28 when HCN channel expression is predominant among the immature growing axons. In contrast, the M72 OR has a late onset of E16, when HCN subunits are downregulating expression in immature OSNs (Potter et al., 2001). The temporal expression patterns of these two ORs may account for their differential susceptibility to perturbation in the HCN1−/− mice.
Figure 11.
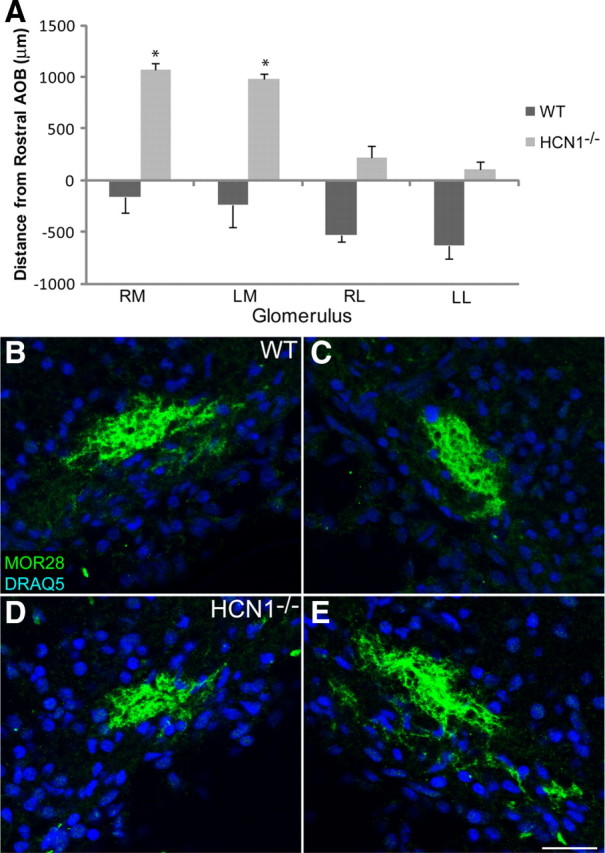
In HCN1−/− mice MOR28 glomeruli change their location but have normal coalescence. A, The histogram shows the change in position relative to the first section containing AOB in the WT compared to HCN1−/− mice. B–E, OB sections from P0 mice labeled with MOR28 and DRAQ5. B, C, Left and right medial WT glomeruli, respectively. D, E, Left and right medial HCN1−/− glomeruli, respectively. RM, Right medial; LM, left medial; RL, right lateral; LL, left lateral. Scale bar for B–E (in E), 50 μm. Error bars, SEM. *p < 0.05, statistically significant difference from controls.
Discussion
Here, we characterized HCN channel subunit expression in the developing OE, demonstrated its role in regulating mouse OSN excitability, and presented in vitro and in vivo evidence supporting the hypothesis that HCN channels play a significant role in OSN axon outgrowth and glomerular layer organization. Expression of all three HCN subunits was detected in the OE at the earliest age examined, E13, and we found developmental relevance in the upregulation of HCN2 and the switch in expression from immature to mature OSNs at E17. Blocking the channels in OSN cell cultures demonstrated a function for HCN channels in neurite outgrowth and branching. Colocalization in OSNs expressing ACIII suggests that HCN channel function may be cAMP sensitive. This is the first data showing that an alternative cation channel contributes to OSN axon extension and suggests that HCN channels are a probable target of cAMP during development.
The importance of HCN channels in developing OSNs may be inferred by the switch in expression from immature to mature OSNs at E17 and the significant increase in HCN2 expression from E13 through P4. HCN2 is one of the most sensitive subunits to cAMP modulation, with an EC50 of 10 nm in immature hippocampus that shifts activation to a less hyperpolarized potential (Wainger et al., 2001; Surges et al., 2006). Recently, Kusch et al. (2010) reported that ligand binding of cAMP and voltage activation in HCN2 channels are interdependent and that each increases the probability of the other. At E13, HCN subunits were present in immature OSNs. However, at E17 expression became more robust among the mature OMP-labeled cells, and less so in immature GAP43-labeled cells. Collectively, these data suggest that the role of Ih may be important in initial olfactory system development.
OB protoglomeruli begin to form at E17 (Treloar et al., 2002). In the HCN1−/− mice we found a significant delay in protoglomerular formation and perturbations in nerve layer organization beginning at E17. At P4 there were significant increases in glomerular area and changes to the sublaminar organization of nerve layer axons. The irregular morphology and stacking of glomeruli that we observed at P4 persisted into adulthood, suggesting that the loss of HCN1 affected the intrinsic organization of the glomerular layer. While it is possible that an upregulation of other HCN subunits in the HCN1−/− mice compensate for the loss of HCN1, this seems unlikely or deficient given the striking glomerular and olfactory nerve layer phenotype we describe.
OSN axons expressing only 1 of ∼1200 ORs navigate through the mesenchyme to the OB and subsequently coalesce with axons expressing the same OR to converge into a glomerulus within a topographically defined location. We had speculated that HCN subunit expression may exhibit some diversity across subpopulations of OSNs in the OE and contribute to regional axon targeting through diverse channel kinetics. However, at all ages we found that OSNs expressed all three subunits. While regional topography between the OE and the OB was not altered in the HCN1−/− mice, the MOR28 glomeruli had significant changes in location. Onset of MOR28 mRNA occurs at E9.5, while M72 mRNA expression begins at E16 (Potter et al., 2001; Rodriguez-Gil et al., 2010). HCNs are expressed in immature OSNs only before E17, which may explain their greater effect on MOR28 glomerular location than on M72 glomeruli.
While HCN channels are found in OB neurons (Moosmang et al., 1999; Holderith et al., 2003; Notomi and Shigemoto, 2004; Brewster et al., 2007), the phenotype we report in the HCN1−/− mice is not likely due to deficits in OB neurons. First, we have shown the localization of HCN subunits to OSNs and demonstrated that they are functionally active. Second, we showed in vitro that HCN channels regulate OSN axon extension. Third, we found that the organization within the olfactory nerve layer was perturbed in the HCN1−/− mice before the OSN axons interacted with OB neurons. Thus, the most parsimonious explanation for the perturbations in the nerve layer and glomerular layer in the HCN1−/− mice is the loss of HCN1 in the OSNs.
HCN channels contribute to the depolarization of the resting potential and therefore may be considered to increase excitability (Robinson and Siegelbaum, 2003). The presence of cAMP shifts the opening of HCN1 channels 5.8 ± 0.6 mV in the depolarizing direction and increases activation by 1.5-fold (Chen et al., 2009). Although the HCN1 subunit is less sensitive to cAMP modulation than HCN2 or HCN4, it activates 4- to 6-fold faster at ∼20 mV less negative potential (Wainger et al., 2001). Thus, the loss of HCN1 is expected to decrease excitability by decreased Ih amplitude and activation rate (Chen et al., 2009). The most plausible explanation of the phenotype in HCN1−/− mice is that decreased excitability affects normal OSN activity, leading to a perturbation of axon behavior. Alternatively, HCN channels may also affect synaptic transmission via direct interaction with the cytoskeleton, and we cannot rule out the possibility that such an effect may contribute to the glomerular phenotype reported here (Beaumont and Zucker, 2000).
Some progress has been made toward determining the requirements necessary for OSN axons to target and converge into a glomerulus within a predefined region of the OB. Among the first was the demonstration that the OR itself is a necessary, though not sufficient, determinant (Feinstein et al., 2004). More recently, Imai et al. (2006) concluded that Gαs-mediated cAMP signals regulate transcription of adhesion-associated molecules, which in turn establish the position of a glomerulus along the rostral-caudal axis. In a complementary study, Chesler et al. (2007) showed that constitutively active G protein was sufficient to induce OSN axon convergence regardless of OR expression. Downstream of the G protein, the loss of ACIII profoundly affects axon projection and the convergence of axons into homogeneous glomeruli (Col et al., 2007; Zou et al., 2007). While ACIII production of cAMP activates the CNG channel during an odor response, we propose that during development cAMP targets HCN channels to increase excitability.
The developmental expression of CNG channels has not been determined in mice. However, in rats expression is first seen at E14 (equivalent to mouse E12.5) in basally located cells (Matsuzaki et al., 1999) but does not appear in neurons with a mature morphology until E16 (equivalent to mouse E14.5) and not uniformly across the OE until E18-E19 (equivalent to mouse E16.5-E17) (Margalit and Lancet, 1993; Shay et al., 2008). Interestingly, although the CNG channels have a developmental profile similar to that of the HCN channels, targeted mutations in the CNG α-subunit (CNG KO) result in only minor changes in axonal convergence into a glomerulus (Lin et al., 2000), in contrast to the more pronounced phenotype we report here in the HCN1−/−. Moreover, expression of genes related to axon extension were shown to be activity dependent in OSNs (Yu et al., 2004; Biju et al., 2008). Our data suggest that some of this activity may be accounted for by the HCN channels. From E17 to P4, glomerular layer development is delayed in HCN1−/− mice with persistent disorganization in adults, arguing that HCN1 is necessary for the initial formation of protoglomeruli and glomerular maturation. This finding is consistent with prior reports (Imai et al., 2006; Chesler et al., 2007) showing that increases in OSN axon extension/coalescence occur following elevation of cAMP, but are independent of CNG channels. Finally, with overexpression of Kir2.1, “giant glomerulus-like structures” are found in the dorsal OB (Yu et al., 2004). Although the Kir2.1 current is large (1 nA) (Rodríguez-Menchaca et al., 2008) compared to Ih, the changes in glomerular size are reminiscent of those found here following mutation of HCN1. Similarly, the dorsal OB glomeruli and glomerular layer in ACIII−/− mice is strikingly similar to our findings in HCN1−/− mice (Zou et al., 2007). Thus, both overexpression of Kir2.1 or the loss of ACIII, both of which decrease excitability in OSNs, produce phenotypes comparable to those seen in the HCN1−/− mice, supporting our conclusion that they may reflect a common mechanism.
While the subcellular site of action for Ih regulation of OSN axon behavior is not yet known, it is generally recognized that both calcium and cAMP regulate the behavior of growth cones (Ming et al., 1997; Zheng, 2000). Two recent reports showed that OR mRNA is transported to OSN axons/growth cones and that odors can induce cAMP-dependent calcium increases (Maritan et al., 2009; Dubacq et al., 2009). HCN channels are present in OSN axons, the presynaptic compartments of developing hippocampal neurons (Bender et al., 2007), and our in vitro data show protein expression in the neurites of developing OSNs. Future studies are being undertaken to determine the effect of cAMP on Ih in mouse OSNs, downstream effects of Ih, and HCN channel expression in the growth cone.
In summary, we established the developmental profile of HCN channels in mouse OSNs and demonstrated that Ih is a determinant of OSN axon extension and glomerular formation. Our data contribute to a growing body of work suggesting that embryonic activity is essential for the proper development of the olfactory system.
Footnotes
This work was funded by National Institutes of Health (NIH)-National Institute on Deafness and Other Communication Disorders and NIH-National Institute on Aging grants (C.A.G.). A.M.M. was supported by Medical Scientist Training Program Grant GM07205 and NIH Grant F30 DC010324. A.S.M. was supported by Neurobiology Training Grant NS 007224-24 and National Research Service Award F32 DC010098-01A1. We thank Drs. L. Rela and M.B. Richard for developing the whole-mount imaging technique in our lab. HCN antibodies were generously provided by Dr. R. Shigemoto, National Institute for Physiological Sciences, Japan.
References
- Beaumont V, Zucker RS. Enhancement of synaptic transmission by cyclic AMP modulation of presynaptic Ih channels. Nat Neurosci. 2000;3:133–141. doi: 10.1038/72072. [DOI] [PubMed] [Google Scholar]
- Bender RA, Kirschstein T, Kretz O, Brewster AL, Richichi C, Rüschenschmidt C, Shigemoto R, Beck H, Frotscher M, Baram TZ. Localization of HCN1 channels to presynaptic compartments: novel plasticity that may contribute to hippocampal maturation. J Neurosci. 2007;27:4697–4706. doi: 10.1523/JNEUROSCI.4699-06.2007. [DOI] [PMC free article] [PubMed] [Google Scholar]
- Biju KC, Marks DR, Mast TG, Fadool DA. Deletion of voltage-gated channel affects glomerular refinement and odorant receptor expression in the mouse olfactory system. J Comp Neurol. 2008;506:161–179. doi: 10.1002/cne.21540. [DOI] [PMC free article] [PubMed] [Google Scholar]
- Bozza TC, Kauer JS. Odorant response properties of convergent olfactory receptor neurons. J Neurosci. 1998;18:4560–4569. doi: 10.1523/JNEUROSCI.18-12-04560.1998. [DOI] [PMC free article] [PubMed] [Google Scholar]
- Brewster AL, Chen Y, Bender RA, Yeh A, Shigemoto R, Baram TZ. Quantitative analysis and subcellular distribution of mRNA and protein expression of the hyperpolarization-activated cyclic nucleotide-gated channels throughout development in rat hippocampus. Cereb Cortex. 2007;17:702–712. doi: 10.1093/cercor/bhk021. [DOI] [PMC free article] [PubMed] [Google Scholar]
- Brunet LJ, Gold GH, Ngai J. General anosmia caused by a targeted disruption of the mouse olfactory cyclic nucleotide-gated cation channel. Neuron. 1996;17:681–693. doi: 10.1016/s0896-6273(00)80200-7. [DOI] [PubMed] [Google Scholar]
- Chen S, Wang J, Siegelbaum SA. Properties of hyperpolarization-activated pacemaker current defined by coassembly of HCN1 and HCN2 subunits and basal modulation by cyclic nucleotide. J Gen Physiol. 2001;117:491–504. doi: 10.1085/jgp.117.5.491. [DOI] [PMC free article] [PubMed] [Google Scholar]
- Chen X, Shu S, Kennedy DP, Willcox SC, Bayliss DA. Subunit-specific effects of isoflurane on neuronal Ih in HCN1 knock-out mice. J Neurophysiol. 2009;101:129–140. doi: 10.1152/jn.01352.2007. [DOI] [PMC free article] [PubMed] [Google Scholar]
- Chesler AT, Zou DJ, Le Pichon CE, Peterlin ZA, Matthews GA, Pei X, Miller MC, Firestein S. A G protein/cAMP signal cascade is required for axonal convergence into olfactory glomeruli. Proc Natl Acad Sci U S A. 2007;104:1039–1044. doi: 10.1073/pnas.0609215104. [DOI] [PMC free article] [PubMed] [Google Scholar]
- Cho JH, Lépine M, Andrews W, Parnavelas J, Cloutier JF. Requirement for Slit-1 and Robo-2 in zonal segregation of olfactory sensory neuron axons in the main olfactory bulb. J Neurosci. 2007;27:9094–9104. doi: 10.1523/JNEUROSCI.2217-07.2007. [DOI] [PMC free article] [PubMed] [Google Scholar]
- Col JA, Matsuo T, Storm DR, Rodriguez I. Adenylyl cyclase-dependent axonal targeting in the olfactory system. Development. 2007;134:2481–2489. doi: 10.1242/dev.006346. [DOI] [PubMed] [Google Scholar]
- de Castro F, Hu L, Drabkin H, Sotelo C, Chédotal A. Chemoattraction and chemorepulsion of olfactory bulb axons by different secreted semaphorins. J Neurosci. 1999;19:4428–4436. doi: 10.1523/JNEUROSCI.19-11-04428.1999. [DOI] [PMC free article] [PubMed] [Google Scholar]
- Dibattista M, Mazzatenta A, Grassi F, Tirindelli R, Menini A. Hyperpolarization-activated cyclic nucleotide-gated channels in mouse vomeronasal sensory neurons. J Neurophysiol. 2008;100:576–586. doi: 10.1152/jn.90263.2008. [DOI] [PubMed] [Google Scholar]
- Dubacq C, Jamet S, Trembleau A. Evidence for developmentally regulated local translation of odorant receptor mRNAs in the axons of olfactory sensory neurons. J Neurosci. 2009;29:10184–10190. doi: 10.1523/JNEUROSCI.2443-09.2009. [DOI] [PMC free article] [PubMed] [Google Scholar]
- Feinstein P, Mombaerts P. A contextual model for axonal sorting into glomeruli in the mouse olfactory system. Cell. 2004;117:817–831. doi: 10.1016/j.cell.2004.05.011. [DOI] [PubMed] [Google Scholar]
- Feinstein P, Bozza T, Rodriguez I, Vassalli A, Mombaerts P. Axon guidance of mouse olfactory sensory neurons by odorant receptors and the beta2 adrenergic receptor. Cell. 2004;117:833–846. doi: 10.1016/j.cell.2004.05.013. [DOI] [PubMed] [Google Scholar]
- Frings S, Lynch JW, Lindemann B. Properties of cyclic nucleotide-gated channels mediating olfactory transduction: activation, selectivity, and blockage. J Gen Physiol. 1992;100:45–67. doi: 10.1085/jgp.100.1.45. [DOI] [PMC free article] [PubMed] [Google Scholar]
- Gasparini S, DiFrancesco D. Action of the hyperpolarization-activated current (Ih) blocker ZD 7288 in hippocampal CA1 neurons. Pflugers Arch. 1997;435:99–106. doi: 10.1007/s004240050488. [DOI] [PubMed] [Google Scholar]
- Gussing F, Bohm S. NQO1 activity in the main and the accessory olfactory systems correlates with the zonal topography of projection maps. Eur J Neurosci. 2004;19:2511–2518. doi: 10.1111/j.0953-816X.2004.03331.x. [DOI] [PubMed] [Google Scholar]
- Hanson MG, Landmesser LT. Normal patterns of spontaneous activity are required for correct motor axon guidance and the expression of specific guidance molecules. Neuron. 2004;43:687–701. doi: 10.1016/j.neuron.2004.08.018. [DOI] [PubMed] [Google Scholar]
- Holderith NB, Shigemoto R, Nusser Z. Cell type-dependent expression of HCN1 in the main olfactory bulb. Eur J Neurosci. 2003;18:344–354. doi: 10.1046/j.1460-9568.2003.02756.x. [DOI] [PubMed] [Google Scholar]
- Imai T, Suzuki M, Sakano H. Odorant receptor-derived cAMP signals direct axonal targeting. Science. 2006;314:657–661. doi: 10.1126/science.1131794. [DOI] [PubMed] [Google Scholar]
- Kusch J, Biskup C, Thon S, Schulz E, Nache V, Zimmer T, Schwede F, Benndorf K. Interdependence of receptor activation and ligand binding in HCN2 pacemaker channels. Neuron. 2010;67:75–85. doi: 10.1016/j.neuron.2010.05.022. [DOI] [PubMed] [Google Scholar]
- Lagostena L, Menini A. Whole-cell recordings and photolysis of caged compounds in olfactory sensory neurons isolated from the mouse. Chem Senses. 2003;28:705–716. doi: 10.1093/chemse/bjg063. [DOI] [PubMed] [Google Scholar]
- Lee YT, Vasilyev DV, Shan QJ, Dunlop J, Mayer S, Bowlby MR. Novel pharmacological activity of loperamide and CP-339,818 on human HCN channels characterized with an automated electrophysiology assay. Eur J Pharmacol. 2008;581:97–104. doi: 10.1016/j.ejphar.2007.11.058. [DOI] [PubMed] [Google Scholar]
- Lin DM, Wang F, Lowe G, Gold GH, Axel R, Ngai J, Brunet L. Formation of precise connections in the olfactory bulb occurs in the absence of odorant-evoked neuronal activity. Neuron. 2000;26:69–80. doi: 10.1016/s0896-6273(00)81139-3. [DOI] [PubMed] [Google Scholar]
- Lipscomb BW, Treloar HB, Klenoff J, Greer CA. Cell surface carbohydrates and glomerular targeting of olfactory sensory neuron axons in the mouse. J Comp Neurol. 2003;467:22–31. doi: 10.1002/cne.10910. [DOI] [PubMed] [Google Scholar]
- Lynch JW, Barry PH. Inward rectification in rat olfactory receptor neurons. Proc Biol Sci. 1991;243:149–153. doi: 10.1098/rspb.1991.0024. [DOI] [PubMed] [Google Scholar]
- Margalit T, Lancet D. Expression of olfactory receptor and transduction genes during rat development. Brain Res Dev Brain Res. 1993;73:7–16. doi: 10.1016/0165-3806(93)90040-h. [DOI] [PubMed] [Google Scholar]
- Maritan M, Monaco G, Zamparo I, Zaccolo M, Pozzan T, Lodovichi C. Odorant receptors at the growth cone are coupled to localized cAMP and Ca2+ increases. Proc Natl Acad Sci U S A. 2009;106:3537–3542. doi: 10.1073/pnas.0813224106. [DOI] [PMC free article] [PubMed] [Google Scholar]
- Matsuzaki O, Bakin RE, Cai X, Menco BP, Ronnett GV. Localization of the olfactory cyclic nucleotide-gated channel subunit 1 in normal, embryonic and regenerating olfactory epithelium. Neuroscience. 1999;94:131–140. doi: 10.1016/s0306-4522(99)00228-6. [DOI] [PubMed] [Google Scholar]
- Ming GL, Song HJ, Berninger B, Holt CE, Tessier-Lavigne M, Poo MM. cAMP-dependent growth cone guidance by netrin-1. Neuron. 1997;19:1225–1235. doi: 10.1016/s0896-6273(00)80414-6. [DOI] [PubMed] [Google Scholar]
- Mombaerts P, Wang F, Dulac C, Chao SK, Nemes A, Mendelsohn M, Edmondson J, Axel R. Visualizing an olfactory sensory map. Cell. 1996;87:675–686. doi: 10.1016/s0092-8674(00)81387-2. [DOI] [PubMed] [Google Scholar]
- Moosmang S, Biel M, Hofmann F, Ludwig A. Differential distribution of four hyperpolarization-activated cation channels in mouse brain. Biol Chem. 1999;380:975–980. doi: 10.1515/BC.1999.121. [DOI] [PubMed] [Google Scholar]
- Müller F, Scholten A, Ivanova E, Haverkamp S, Kremmer E, Kaupp UB. HCN channels are expressed differentially in retinal bipolar cells and concentrated at synaptic terminals. Eur J Neurosci. 2003;17:2084–2096. doi: 10.1046/j.1460-9568.2003.02634.x. [DOI] [PubMed] [Google Scholar]
- Notomi T, Shigemoto R. Immunohistochemical localization of Ih channel subunits, HCN1–4, in the rat brain. J Comp Neurol. 2004;471:241–276. doi: 10.1002/cne.11039. [DOI] [PubMed] [Google Scholar]
- Potter SM, Zheng C, Koos DS, Feinstein P, Fraser SE, Mombaerts P. Structure and emergence of specific olfactory glomeruli in the mouse. J Neurosci. 2001;21:9713–9723. doi: 10.1523/JNEUROSCI.21-24-09713.2001. [DOI] [PMC free article] [PubMed] [Google Scholar]
- Robinson RB, Siegelbaum SA. Hyperpolarization-activated cation currents: from molecules to physiological function. Annu Rev Physiol. 2003;65:453–480. doi: 10.1146/annurev.physiol.65.092101.142734. [DOI] [PubMed] [Google Scholar]
- Rodriguez-Gil DJ, Treloar HB, Zhang X, Miller AM, Two A, Iwema C, Firestein SJ, Greer CA. Chromosomal location-dependent nonstochastic onset of odor receptor expression. J Neurosci. 2010;30:10067–10075. doi: 10.1523/JNEUROSCI.1776-10.2010. [DOI] [PMC free article] [PubMed] [Google Scholar]
- Rodríguez-Menchaca AA, Navarro-Polanco RA, Ferrer-Villada T, Rupp J, Sachse FB, Tristani-Firouzi M, Sánchez-Chapula JA. The molecular basis of chloroquine block of the inward rectifier Kir2.1 channel. Proc Natl Acad Sci U S A. 2008;105:1364–1368. doi: 10.1073/pnas.0708153105. [DOI] [PMC free article] [PubMed] [Google Scholar]
- Sakano H. Neural map formation in the mouse olfactory system. Neuron. 2010;67:530–542. doi: 10.1016/j.neuron.2010.07.003. [DOI] [PubMed] [Google Scholar]
- Schwarting GA, Raitcheva D, Crandall JE, Burkhardt C, Püschel AW. Semaphorin 3A-mediated axon guidance regulates convergence and targeting of P2 odorant receptor axons. Eur J Neurosci. 2004;19:1800–1810. doi: 10.1111/j.1460-9568.2004.03304.x. [DOI] [PubMed] [Google Scholar]
- Serizawa S, Miyamichi K, Takeuchi H, Yamagishi Y, Suzuki M, Sakano H. A neuronal identity code for the odorant receptor-specific and activity-dependent axon sorting. Cell. 2006;127:1057–1069. doi: 10.1016/j.cell.2006.10.031. [DOI] [PubMed] [Google Scholar]
- Shay EL, Greer CA, Treloar HB. Dynamic expression patterns of ECM molecules in the developing mouse olfactory pathway. Dev Dyn. 2008;237:1837–1850. doi: 10.1002/dvdy.21595. [DOI] [PMC free article] [PubMed] [Google Scholar]
- Singh KK, Miller FD. Activity regulates positive and negative neurotrophin-derived signals to determine axon competition. Neuron. 2005;45:837–845. doi: 10.1016/j.neuron.2005.01.049. [DOI] [PubMed] [Google Scholar]
- Surges R, Brewster AL, Bender RA, Beck H, Feuerstein TJ, Baram TZ. Regulated expression of HCN channels and cAMP levels shape the properties of the h current in developing rat hippocampus. Eur J Neurosci. 2006;24:94–104. doi: 10.1111/j.1460-9568.2006.04880.x. [DOI] [PMC free article] [PubMed] [Google Scholar]
- Suto F, Murakami Y, Nakamura F, Goshima Y, Fujisawa H. Identification and characterization of a novel mouse plexin, plexin-A4. Mech Dev. 2003;120:385–396. doi: 10.1016/s0925-4773(02)00421-5. [DOI] [PubMed] [Google Scholar]
- Treloar HB, Feinstein P, Mombaerts P, Greer CA. Specificity of glomerular targeting by olfactory sensory axons. J Neurosci. 2002;22:2469–2477. doi: 10.1523/JNEUROSCI.22-07-02469.2002. [DOI] [PMC free article] [PubMed] [Google Scholar]
- Treloar HB, Miller AM, Ray A, Greer CA. Development of the olfactory system. In: Menini A, editor. The neurobiology of olfaction. Boca Raton, FL: CRC; 2009. pp. 131–156. [Google Scholar]
- Vargas G, Lucero MT. Dopamine modulates inwardly rectifying hyperpolarization-activated current (Ih) in cultured rat olfactory receptor neurons. J Neurophysiol. 1999;81:149–158. doi: 10.1152/jn.1999.81.1.149. [DOI] [PubMed] [Google Scholar]
- Vasilyev DV, Shan Q, Lee Y, Mayer SC, Bowlby MR, Strassle BW, Kaftan EJ, Rogers KE, Dunlop J. Direct inhibition of Ih by analgesic loperamide in rat DRG neurons. J Neurophysiol. 2007;97:3713–3721. doi: 10.1152/jn.00841.2006. [DOI] [PubMed] [Google Scholar]
- Wainger BJ, DeGennaro M, Santoro B, Siegelbaum SA, Tibbs GR. Molecular mechanism of cAMP modulation of HCN pacemaker channels. Nature. 2001;411:805–810. doi: 10.1038/35081088. [DOI] [PubMed] [Google Scholar]
- Walz A, Mombaerts P, Greer CA, Treloar HB. Disrupted compartmental organization of axons and dendrites within olfactory glomeruli of mice deficient in the olfactory cell adhesion molecule, OCAM. Mol Cell Neurosci. 2006;32:1–14. doi: 10.1016/j.mcn.2006.01.013. [DOI] [PubMed] [Google Scholar]
- Wang F, Nemes A, Mendelsohn M, Axel R. Odorant receptors govern the formation of a precise topographic map. Cell. 1998;93:47–60. doi: 10.1016/s0092-8674(00)81145-9. [DOI] [PubMed] [Google Scholar]
- Williams DK, Cohan CS. Calcium transients in growth cones and axons of cultured Helisoma neurons in response to conditioning factors. J Neurobiol. 1995;27:60–75. doi: 10.1002/neu.480270107. [DOI] [PubMed] [Google Scholar]
- Ye B, Nerbonne JM. Proteolytic processing of HCN2 and co-assembly with HCN4 in the generation of cardiac pacemaker channels. J Biol Chem. 2009;284:25553–25559. doi: 10.1074/jbc.M109.007583. [DOI] [PMC free article] [PubMed] [Google Scholar]
- Yu CR, Power J, Barnea G, O'Donnell S, Brown HE, Osborne J, Axel R, Gogos JA. Spontaneous neural activity is required for the establishment and maintenance of the olfactory sensory map. Neuron. 2004;42:553–566. doi: 10.1016/s0896-6273(04)00224-7. [DOI] [PubMed] [Google Scholar]
- Zagotta WN, Siegelbaum SA. Structure and function of cyclic nucleotide-gated channels. Annu Rev Neurosci. 1996;19:235–263. doi: 10.1146/annurev.ne.19.030196.001315. [DOI] [PubMed] [Google Scholar]
- Zhao H, Reed RR. X inactivation of the OCNC1 channel gene reveals a role for activity-dependent competition in the olfactory system. Cell. 2001;104:651–660. doi: 10.1016/s0092-8674(01)00262-8. [DOI] [PubMed] [Google Scholar]
- Zheng C, Feinstein P, Bozza T, Rodriguez I, Mombaerts P. Peripheral olfactory projections are differentially affected in mice deficient in a cyclic nucleotide-gated channel subunit. Neuron. 2000;26:81–91. doi: 10.1016/s0896-6273(00)81140-x. [DOI] [PubMed] [Google Scholar]
- Zheng JQ. Turning of nerve growth cones induced by localized increases in intracellular calcium ions. Nature. 2000;403:89–93. doi: 10.1038/47501. [DOI] [PubMed] [Google Scholar]
- Zhou L, Olivier NB, Yao H, Young EC, Siegelbaum SA. A conserved tripeptide in CNG and HCN channels regulates ligand gating by controlling C-terminal oligomerization. Neuron. 2004;44:823–834. doi: 10.1016/j.neuron.2004.11.012. [DOI] [PubMed] [Google Scholar]
- Zou DJ, Chesler AT, Le Pichon CE, Kuznetsov A, Pei X, Hwang EL, Firestein S. Absence of adenylyl cyclase 3 perturbs peripheral olfactory projections in mice. J Neurosci. 2007;27:6675–6683. doi: 10.1523/JNEUROSCI.0699-07.2007. [DOI] [PMC free article] [PubMed] [Google Scholar]
- Zou DJ, Chesler A, Firestein S. How the olfactory bulb got its glomeruli: a just so story. Nat Rev Neurosci. 2009;10:611–618. doi: 10.1038/nrn2666. [DOI] [PubMed] [Google Scholar]