

Abstract
Background
Determination of the profile of genes that are commonly methylated aberrantly in colorectal cancer (CRC) will have substantial value for diagnostic and therapeutic applications. However, there is limited knowledge of the DNA methylation pattern in CRC.
Materials and Methods
We analyzed the methylation profile of 27,578 CpG sites spanning more than 14,000 genes in CRC and in the adjacent normal mucosa using beadchip array-based technology.
Results
We identified 621 CpG sites located in promoter regions and CpG islands that were significantly hypermethylated in CRC compared to normal mucosa. The genes on chromosome 18 showed promoter hypermethylation most frequently. According to gene ontology analysis, the most common biologically relevant class of genes affected by methylation was the class associated with the cadherin signaling pathway. Compared to the genome-wide expression array, mRNA expression was more likely to be down-regulated in the genes demonstrating promoter hypermethylation, even though this was not statistically significant. We validated 10 CpG sites that were hypermethylated (ADHFE1, BOLL, SLC6A15, ADAMTS5, TFPI2, EYA4, NPY, TWIST1, LAMA1, GAS7) and 2 CpG sites showing hypomethylation (MAEL, SFT2D3) in CRC compared to the normal mucosa in the array studies using pyrosequencing. The methylation status measured by pyrosequencing was consistent with the methylation array data.
Conclusions
Methylation profiling based on beadchip arrays is an effective method for screening aberrantly methylated genes in CRC. In addition, we identified novel methylated genes that are candidate diagnostic or prognostic markers for CRC.
Colorectal cancer (CRC) is one of the most common cancers in the world. CRC arises as a consequence of the accumulation of genetic alterations and epigenetic alterations that transform colonic epithelial cells into adenocarcinoma cells 1. The aberrant methylation of CpG islands in the promoter or exon 1 regions of the genes is a recognized epigenetic event that silences the tumor suppressor genes in colorectal cancer 2–3. These aberrantly methylated genes are promising biomarkers for molecular diagnostics and early detection and are attractive predictive markers for targeted therapies 4.
Colorectal cancer can be prevented through a resection of colorectal adenoma and is treated most effectively when detected at an early stage. A regular colonoscopic examination is recommended, but the high cost and invasiveness of the procedure is an obstacle to its application as a screening test for CRC. Furthermore, although fecal occult blood testing is inexpensive and non-invasive, the sensitivity and specificity of this test are low5–7. Therefore, more accurate biomarkers and methods for the early detection of CRC, such as fecal DNA based tests, are needed 8–11. Fecal DNA tests that employ genetic mutations are complicated, generally expensive, and are inadequately sensitive to adenomas. Recent studies showed that the aberrant DNA methylation of several genes is present in even the earliest steps in the adenoma-carcinoma sequence, such as the aberrant crypt focus12–15. Moreover, many genes were silenced by aberrant methylation and might be associated with colorectal tumorigenesis 16–21. Therefore, the genes with aberrant methylation have the potential to be useful biomarkers for the early detection of colorectal tumors. The ability to detect aberrant DNA methylation from the DNA extracted from a range of samples, including blood, stool and paraffin-embedded formalin-fixed tissue, suggests that these assays are robust with excellent potential to be used clinically 22–24. In addition, the DNA methylation patterns can be applied to the molecular classification of neoplasms 25 as well as to the prediction of the therapeutic responsiveness 26–27 and prognosis of CRC 28–29. Finally, epigenetic therapy, such as 5-azacitidine, has been shown to be effective in treating hematologic malignancies and might be useful for treating CRC 30. As our understanding of the role of epigenetic alterations in the carcinogenesis of CRC increases, epigenetic therapy for CRC might be realized. In addition, identification of the signaling pathways deregulated by aberrant DNA methylation may provide a means of selecting CRCs that will be particularly sensitive to targeted therapies 31.
A comprehensive assessment of the aberrantly methylated genes in CRCs has the potential to not only improve our understanding of the molecular biology of CRC but also identify the methylated genes that will influence the clinical care of patients with CRC. Therefore, this study analyzed the methylation profile of 27,578 CpG sites spanning more than 14,000 genes in CRC tissue and the adjacent normal tissue using beadchip array-based technology 32–33.
MATERIALS AND METHODS
Subjects
Twenty-two pairs of colorectal cancer and adjacent normal mucosa were collected from patients treated at Samsung Medical Center (Seoul, Korea) for methylation profiling (Table 1). Another 35 pairs and 65 pairs were obtained to validate the candidate genes selected from methylation profiling using pyrosequencing analysis and genome-wide expression array, respectively (Table 1). The protocol of this study was approved by the Institutional Review Board of the institution. None of the patients had clinically apparent polyposis syndrome or Lynch syndrome. The DNA was extracted from snap-frozen sections from these tumors and normal mucosa using a DNeasy Tissue kit (Qiagen) according to the manufacturer’s protocol.
TABLE 1.
Characteristics of the subjects
| Methylation profiling group (n=22) |
Validation group (n=35) |
Expression array group (n=65) |
|
|---|---|---|---|
| Age (years)a | 63 (42–77) | 58 (43–77) | 59 (41–77) |
| Sex | |||
| Male | 16 | 23 | 41 |
| Female | 6 | 12 | 24 |
| Location | |||
| Right colon | 7 | 10 | 7 |
| Left colon | 9 | 18 | 19 |
| Rectum | 6 | 7 | 39 |
| Stage | |||
| I | 6 | 3 | 0 |
| II | 9 | 21 | 42 |
| III | 7 | 9 | 23 |
| IV | 0 | 2 | 0 |
Median (range)
Methylation profiling in CRC and normal mucosa
Human Methylation27 DNA Analysis BeadChip® (Illumina) was used to analyze the methylation profile of the CRCs. This beadchip array can provide methylation information at a single-base resolution for 27,578 CpG sites spanning more than 14,000 genes.
All the samples were bisulfite-converted using an EZ DNA methylation kit (Zymo Research) according to the manufacturer’s instructions. After whole-genome amplification with 200 ng of input bisulfite-converted DNA, the product was fragmented, purified and applied to the BeadChips using Illumia-supplied reagents and conditions. After extension, the array was stained fluorescently, scanned, and the intensities of the unmethylated and methylated bead types were measured.
Thirty five targets of the 27,578 targets with a detection p-value>0.05 were excluded and the remaining 27,543 target CpG sites were used in the final analysis. Each methylation data point is represented by the fluorescent signals from the M (methylated) and U (unmethylated) alleles. The background intensity calculated from a set of negative controls was subtracted from each analytical data point. The ratio of fluorescent signals was then computed from the two alleles β = (max(M, 0))/(|U| + |M| + 100). The β-value reflects the methylation level of each CpG site. A β-value of 0–1.0 indicates the percent methylation from 0% to 100%, respectively, of each CpG site. The difference in the mean β-value (Δβ) means (mean of β-value in CRC – mean of β-value in normal mucosa). Statistical significance of the methylation data was determined using a paired t-test based on the null hypothesis that no difference exists between the means of CRC and normal mucosa in the methylation data. The false discovery rate (FDR) was controlled by adjusting the p value using the Benjamini-Hochberg algorithm.
Hierarchical clustering was performed using complete linkage with a Euclidian metric. Gene ontology analysis for the genes with hypermethylated promoters in CpG islands was performed using the PANTHER Classification System (http://www.pantherdb.org/panther/ontologies.jsp), using the text files containing the Gene ID list and accession number of Illumina probe ID.
Genome-wide expression array in CRC
The total RNA was extracted using the RNeasy Mini Kit (Qiagen) according to the manufacturer’s protocol. The RNA samples were labeled according to the chip manufacturer’s recommended protocols. Briefly, 0.5 µg of the total RNA from each sample was labeled using the Illumina Total Prep RNA Amplification Kit (Ambion) in a process of cDNA synthesis and in vitro transcription. Single-stranded RNA (cRNA) was generated and labeled by incorporating biotin-NTP (Ambion). A total of 1.5 µg of biotin-labeled cRNA was hybridized at 58°C for 16 hours to the Illumina’s Sentrix Human-6 v2 Expression BeadChip (Illumina). The hybridized biotinylated cRNA was detected with streptavidin-Cy3 and quantitated using Illumina’s BeadArray Reader Sanner (Illumina) according to the manufacturer’s instructions. The array data was processed and analyzed using Illumina BeadStudio version 3.0 software (Illumina). Data normalization was performed using quantile normalization, and the fold changes and statistical significance were determined using the Avadis Prophetic version 3.3 (Strand Genomics).
Validation of methylation status with pyrosequencing analysis
The promoter region of the 12 genes (alcohol dehydrogenase, iron containing, 1 (ADHFE1), bol, boule-like (Drosophila) (BOLL), solute carrier family 6 (neutral amino acid transporter), member 15 (SLC6A15), a disintegrin-like and metallopeptidase (reprolysin type) with thrombospondin type 1 motif, 5 (ADAMTS5), tissue factor pathway inhibitor 2 (TFPI2), eyes absent homolog 4 (Drosophila) (EYA4), neuropeptide Y (NPY), twist homolog 1 (Drosophila) (TWIST1), laminin, alpha 1 (LAMA1), growth arrest specific 7 (GAS7), SFT2 domain containing 3 (SFT2D3), maelstrom homolog (Drosophila) (MAEL)) were amplified using the forward primer and biotinylated reverse primer, which were designed by PSQ Assay Design (Biotage AB). The bisulfite-modified DNA was amplified in a 25-µL reaction with the primer set and f-Taq polymerase (Solgent). The samples were heated to 95°C for 2 min and amplified for 50 cycles of the following: 95°C for 30 seconds, 58~63°C for 30 seconds, and 72°C for 30 seconds, followed by a final extension step at 72°C for 5 minutes. Pyrosequencing reactions were carried out with a sequencing primer on the PSQ HS 96A System (Biotage AB) according to the manufacturer’s specifications. Supplementary table 1 lists the primer sequences.
RESULTS
Methylation profiling in CRC
The methylation status of the 27,578 CpG sites in 22 pairs of CRC tissue and adjacent normal mucosa were measured to identify the genes that are commonly methylated aberrantly in CRC. We selected 3,622 CpG sites with an adjusted P<0.001 and a minimum Δβ of 0.15. The CpG sites in CpG islands were more likely to be hypermethylated compared to the CpG site outside CpG islands (Supplementary table 2). Six hundred and twenty one (6.3%) of the 9,792 CpG sites located in promoter regions and CpG islands were found to be significantly hypermethylated in CRC compared to the normal mucosa. Table 2 lists the twenty top-ranking genes with hypermethylated or hypomethylated promoters in CpG islands. Hierarchical clustering with the differentially methylated CpG sites showed clear demarcation between CRC and normal mucosa. Genes with hypermethylated or hypomethylated promoters in CpG islands were generally found on all chromosomes (Fig. 1). However, there were differences between chromosomes. Chromosomes 18 and 5 carried hypermethylated genes most frequently and chromosomes 22, 17 and 15 carried the highest frequency of hypomethylated genes.
TABLE 2.
Twenty top-ranking genes with hypermethylated or hypomethylated promoters
| Hypermethylationa | Hypomethylationb | ||
|---|---|---|---|
| ADHFE1 | FLJ30834 | SFT2D3 | FLJ36046 |
| GPR75 | SLC18A3 | MAEL | LAMB1 |
| BOLL | WDR78 | EDG6 | SLC6A6 |
| SLC6A15 | KCNQ5 | LILRA4 | GPSM1 |
| ADAMTS5 | PRKAR1B | HIST1H2BO | MGC11257 |
| VGCNL1 | GABBR2 | GPR109A | INT1 |
| TFPI2 | PCDHGC4 | CARD14 | SLC6A18 |
| CUTL2 | ADCY1 | FLJ36116 | FLJ27365 |
| UNC5C | FIGN | GRAP | NUP50 |
| SPG20 | GALR2 | NRXN1 | ABHD7 |
twenty top-ranking genes hypermethylated in colorectal cancer tissue compared to normal colorectal mucosa, which were selected based on statistical significance
twenty top-ranking genes hypomethylated in colorectal cancer tissue compared to normal colorectal mucosa, which were selected based on statistical significance
FIG. 1.

Chromosomal distribution of hypermethylated or hypomethylated promoters in CpG islands. The percent means (the number of hypermethylated or hypomethylated CpG sites X 100)/(the number of total CpG sites located in promoter regions and CpG islands on individual chromosome). This shows that genes on chromosome 18 are hypermethylated most frequently.
Validation of methylation status by pyrosequencing analysis
Ten CpG sites showing hypermethylation and 2 CpG sites showing hypomethylation in CRC compared to the normal mucosa were validated by pyrosequencing to confirm the methylation state of the genes identified to be aberrantly methylated in CRC by the array studies. Among the 10 hypermethylated CpG sites, 4 CpG sites (ADHFE1, BOLL, SLC6A15, ADAMTS5) were selected because these genes were the most highly methylated in CRC compared to the normal mucosa, and 6 CpG sites (TFPI2, EYA4, NPY, TWIST1, LAMA1, GAS7) were selected based on our previous GoldenGate Methylation Solution (Illumina) results (unpublished) or genome-wide expression array data. The two hypomethylated CpG sites (MAEL, SFT2D3) were selected because these genes showed the lowest methylation level in tumor tissue compared to the normal mucosa. The methylation status measured by pyrosequencing showed a good correlation with the methylation status measured by Human Methylation27 DNA Analysis BeadChip® (Fig. 2). This result showed that DNA methylation profiling using beadchip arrays is an accurate method for the genome-wide screening of methylated CpG sites.
FIG. 2.
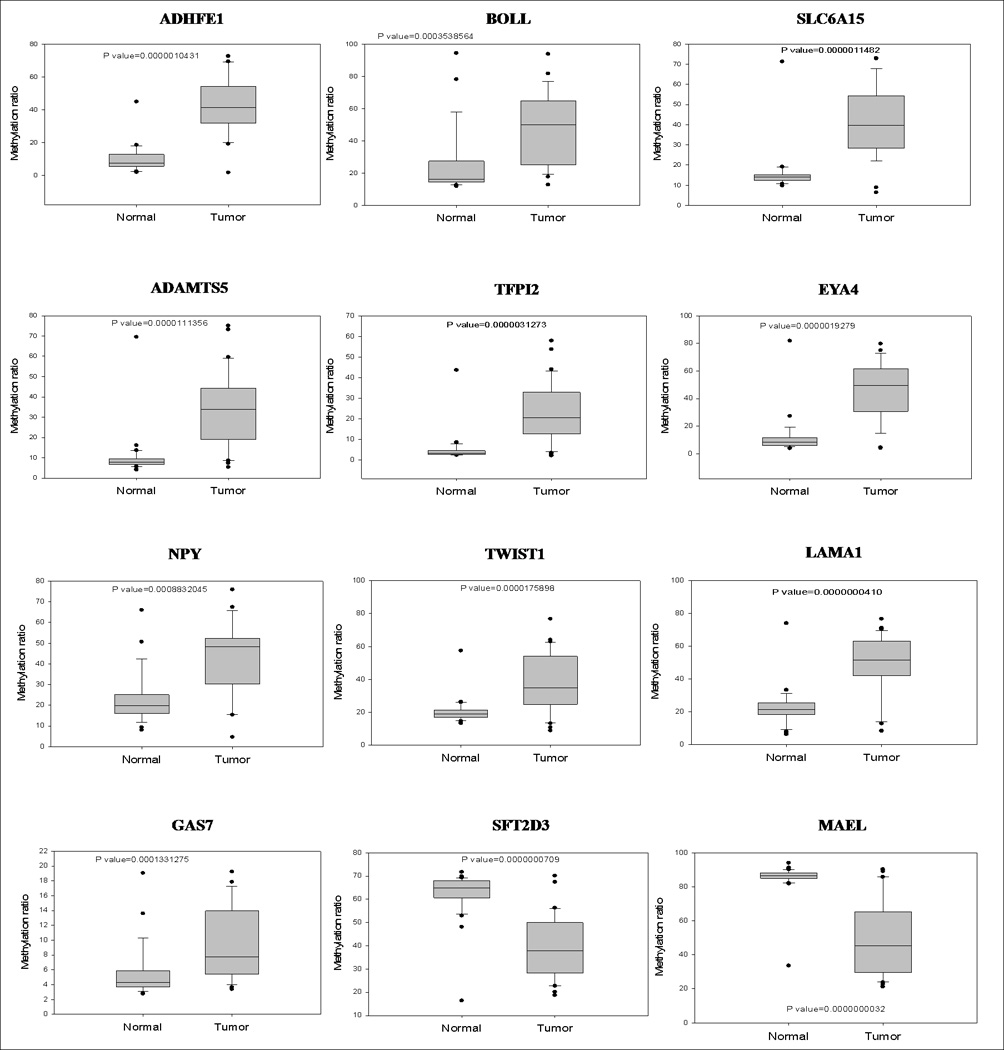
Pyrosequencing analysis. Methylation level of 10 hypermethylated genes (ADHFE1, BOLL, SLC6A15, ADAMTS5, TFPI2, EYA4, NPY, TWIST1, LAMA1, GAS7) and 2 hypomethylated genes (MAEL, SFT2D3) was confirmed by pyrosequencing analysis.
Gene ontology categories of hypermethylated or hypomethylated CpG sites
Gene ontology analysis of the hypermethylated or hypomethylated CpG sites located in promoter regions and CpG islands in CRC was performed. The aberrantly methylated CpG sites were distributed across various categories of biological processes, molecular functions or pathways. However, the promoters of the genes related to certain categories appeared to be more likely to be hypermethylated (Table 3). Interestingly, the genes in cadherin signaling pathway were mostly frequently hypermethylated.
TABLE 3.
Biological process, molecular function, and pathway categories with methylated genesa
| Total | Hypermethyl aton |
Hypermet hylaton (expected) |
p-value | |
|---|---|---|---|---|
| Biological process | ||||
| Signal transduction | 1560 | 188 | 99.8 | 1.29E-17 |
| Developmental processes | 1157 | 148 | 74.0 | 2.62E-15 |
| Neuronal activities | 299 | 64 | 19.1 | 2.91E-15 |
| Cell communication | 539 | 91 | 34.5 | 7.33E-15 |
| Cell surface receptor mediated signal transduction | 686 | 100 | 43.9 | 1.94E-12 |
| Ectoderm development | 390 | 70 | 25.0 | 2.61E-12 |
| Neurogenesis | 360 | 64 | 23.0 | 7.94E-11 |
| Cell adhesion | 257 | 49 | 16.4 | 8.06E-10 |
| mRNA transcription regulation | 841 | 104 | 53.8 | 1.41E-08 |
| Cell adhesion-mediated signaling | 152 | 35 | 9.7 | 3.36E-08 |
| G-protein mediated signaling | 307 | 52 | 19.6 | 7.79E-08 |
| Protein metabolism and modification | 1506 | 55 | 96.3 | 1.77E-05 |
| mRNA transcription | 1080 | 112 | 69.1 | 2.89E-05 |
| Biological process unclassified | 2877 | 133 | 184.0 | 5.50E-05 |
| Synaptic transmission | 147 | 26 | 9.4 | 7.18E-04 |
| Cell proliferation and differentiation | 586 | 62 | 37.5 | 2.66E-03 |
| Sensory perception | 139 | 21 | 8.9 | 1.03E-02 |
| Ion transport | 278 | 36 | 17.8 | 1.04E-02 |
| Electron transport | 120 | 0 | 7.7 | 1.37E-02 |
| Cation transport | 226 | 31 | 14.5 | 1.64E-02 |
| Other neuronal activity | 84 | 16 | 5.4 | 2.04E-02 |
| Other metabolism | 308 | 7 | 19.7 | 2.54E-02 |
| Mesoderm development | 293 | 36 | 18.7 | 2.84E-02 |
| Pre-mRNA processing | 166 | 1 | 10.6 | 3.80E-02 |
| Nerve-nerve synaptic transmission | 38 | 10 | 2.4 | 4.21E-02 |
| Action potential propagation | 9 | 5 | 0.6 | 4.68E-02 |
| Molecular function | ||||
| Receptor | 553 | 97 | 35.4 | 9.24E-18 |
| G-protein coupled receptor | 146 | 36 | 9.3 | 2.33E-09 |
| Cell adhesion molecule | 150 | 34 | 9.6 | 1.34E-08 |
| Homeobox transcription factor | 142 | 34 | 9.1 | 1.85E-08 |
| Transcription factor | 1118 | 124 | 71.5 | 2.03E-08 |
| Extracellular matrix | 144 | 32 | 9.2 | 7.00E-08 |
| Cadherin | 39 | 17 | 2.5 | 2.04E-07 |
| Ion channel | 164 | 31 | 10.5 | 4.44E-06 |
| HMG box transcription factor | 18 | 9 | 1.2 | 5.37E-04 |
| Molecular function unclassified | 2736 | 131 | 175.0 | 7.78E-04 |
| Ligase | 231 | 2 | 14.8 | 1.20E-03 |
| Voltage-gated ion channel | 76 | 16 | 4.9 | 7.27E-03 |
| Ligand-gated ion channel | 41 | 11 | 2.6 | 1.42E-02 |
| Basic helix-loop-helix transcription factor | 71 | 14 | 4.5 | 4.12E-02 |
| Pathway | ||||
| Cadherin signaling pathway | 88 | 20 | 5.6 | 2.86E-04 |
Gene ontology analysis was performed using the PANTHER Classification System.
Comparison of promoter hypermethylation to “CAN genes”
MLH1 can be inactivated genetically and epigenetically. A germline mutation of MLH1 causes Lynch syndrome and promoter hypermethylation of MLH1 causes microsatellite unstable sporadic CRC. Therefore, this study examined whether the promoter of CAN genes, described by Sjoblom et al 34, showed hypermethylation. Thirty-seven out of 69 CAN genes had promoter regions in the CpG islands and 6 of these 37 genes (cell adhesion molecule with homology to L1CAM (close homolog of L1) (CHL1), CUB and Sushi multiple domains 3 (CSMD3), EYA4, guanylate cyclase 1, soluble, alpha 2 (GUCY1A2), potassium voltage-gated channel, KQT-like subfamily, member 5 (KCNQ5), matrix metallopeptidase 2 (MMP2)) showed significant promoter hypermethylation (Table 4). These results are consistent with those reported by Schuebel et al 35.
TABLE 4.
Assessment of promoter hypermethylation in “CAN genes”a
| CAN gene | p-value | Δβ(mean) | β(mean)_normal | β(mean)_tumor |
|---|---|---|---|---|
| ABCA1 | 7.40E-01 | −0.001 | 0.023 | 0.024 |
| ACSL5 | 1.37E-07 | 0.265 | 0.854 | 0.589 |
| ADAMTS15 | 1.45E-01 | −0.005 | 0.031 | 0.036 |
| ADAMTS18 | 6.86E-01 | 0.014 | 0.252 | 0.238 |
| APC | 1.01E-01 | −0.042 | 0.037 | 0.080 |
| CD109 | 3.18E-02 | −0.040 | 0.045 | 0.085 |
| CHL1 | 5.74E-08 | −0.270 | 0.169 | 0.440 |
| CNTN4 | 4.61E-02 | −0.062 | 0.256 | 0.318 |
| CSMD3 | 2.21E-04 | −0.156 | 0.070 | 0.227 |
| EPHA3 | 1.25E-01 | −0.041 | 0.188 | 0.229 |
| EPHB6 | 1.14E-01 | −0.011 | 0.018 | 0.029 |
| ERCC6 | 3.06E-01 | −0.003 | 0.019 | 0.022 |
| EYA4 | 1.70E-11 | −0.510 | 0.035 | 0.545 |
| FBXW7 | 1.44E-01 | 0.006 | 0.084 | 0.078 |
| GALNS | 8.73E-01 | 0.000 | 0.029 | 0.029 |
| GNAS | 7.05E-01 | −0.012 | 0.526 | 0.538 |
| GUCY1A2 | 4.09E-04 | −0.218 | 0.123 | 0.341 |
| KCNQ5 | 8.24E-12 | −0.491 | 0.037 | 0.528 |
| KRAS | 1.83E-01 | −0.007 | 0.021 | 0.028 |
| LRP2 | 4.60E-03 | −0.098 | 0.082 | 0.180 |
| MAP2 | 1.23E-03 | −0.104 | 0.379 | 0.483 |
| MLL3 | 4.09E-02 | −0.028 | 0.073 | 0.101 |
| MMP2 | 1.61E-08 | −0.286 | 0.214 | 0.500 |
| NF1 | 2.57E-01 | 0.007 | 0.079 | 0.073 |
| PHIP | 3.39E-01 | −0.002 | 0.035 | 0.037 |
| PKNOX1 | 8.50E-01 | 0.000 | 0.048 | 0.047 |
| PRKD1 | 2.31E-01 | −0.063 | 0.300 | 0.364 |
| PTPRU | 8.11E-05 | 0.018 | 0.051 | 0.033 |
| RET | 1.39E-02 | −0.107 | 0.075 | 0.182 |
| SCN3B | 3.43E-01 | −0.031 | 0.094 | 0.126 |
| SFRS6 | 5.15E-02 | −0.004 | 0.028 | 0.031 |
| SLC29A1 | 2.49E-01 | 0.003 | 0.055 | 0.052 |
| SMAD4 | 5.40E-02 | −0.003 | 0.027 | 0.031 |
| TCF7L2 | 7.88E-01 | −0.001 | 0.053 | 0.054 |
| TGFBR2 | 2.84E-02 | −0.012 | 0.026 | 0.038 |
| UHRF2 | 1.46E-01 | −0.003 | 0.036 | 0.039 |
| UQCRC2 | 4.59E-02 | −0.007 | 0.031 | 0.038 |
“CAN genes” are candidate colorectal cancer genes described by Sjoblom et al34.
Comparison of promoter hypermethylation to genome-wide expression array data
Finally, genome-wide expression array analysis was performed comparing 6 normal colonic mucosa samples versus 65 CRC tissues to determine the relationship between the gene methylation status and mRNA expression of genes. This approach was used to obtain a preliminary assessment of the proportion of genes that were aberrantly methylated “passenger” genes vs. “driver” genes. The mean fold change was the log ratio of the mRNA expression level for the CRC tissue relative to 6 pooled normal mucosa. There was no statistically significant difference in the mRNA expression level between promoter hypermethylation group and hypomethylation group (Supplementary table 3). However, mRNA expression was more likely to be down-regulated in the promoter hypermethylation group, even though it was not statistically significant. The genes with promoter hypermethylation whose expression was downregulated more than 2 fold are listed as follows: ADHFEI, sodium channel, nonvoltage-gated 1, beta (SCNN1B), C2orf32, slit homolog 2 (Drosophila) (SLIT2), enoyl CoA hydratase domain containing 3 (ECHDC3), slit homolog 3 (Drosophila) (SLIT3), EGF-containing fibulin-like extracellular matrix protein 1 (EFEMP1), somatostatin (SST), forkhead box D2 (FOXD2), ST3 beta-galactoside alpha-2,3-sialyltransferase 4 (ST3GAL4), frizzled-related protein (FRZB), transcription elongation factor A (SII)-like 2 (TCEAL2), homeobox A5 (HOXA5), ubiquitin carboxyl-terminal esterase L1 (UCHL1), NDRG family member 2 (NDRG2), zinc finger homeobox protein 1b (ZFHX1B), NPY, zinc finger protein 447 (ZNF447), protein phosphatase 1, regulatory (inhibitor) subunit 3C (PPP1R3C). The genes with promoter hypomethylation whose expression was upregulated more than 2 fold are as follows: C19orf33, interleukin 10 receptor, alpha (IL10RA), enoyl CoA hydratase 1, peroxisomal (ECH1), myotubularin 1 (MTM1), 3-hydroxymethyl-3-methylglutaryl-CoA lyase (HMGCL).
DISCUSSION
A genome-wide assessment of the methylation state of CpG’s in CRC was assessed using Human Methylation27 DNA Analysis BeadChip® arrays. This array platform was found to be a promising method for identifying the genes with promoter hypermethylation in CRC. These results are consistent with the published genome-wide assessments of aberrantly methylated genes in CRC. Schuebel et al reported that epigenetic unmasking techniques using expression arrays identified the genes affected by promoter CpG island DNA hypermethylation 35. They confirmed the methylation status of several candidate genes in CRC and normal tissue using nested methylation specific PCR. The results of their validation studies identified the genes that were found in the present study to be methylated in CRCs. For example, BOLL, EFEMP1, and junctophilin 3 (JPH3) were significantly methylated in both studies. Estécio et al used the Methylated CpG Island Amplification (MCA) method to identify the methylated genes in the RKO colorectal cancer cell line 36. Sixty-three of the genes that Estécio found to be methylated using the MCA method were represented on the HumanMethylation27 arrays. Among these 63 genes, 6 genes (glial cell derived neurotrophic factor (GDNF), GDNF family receptor alpha 1 (GFRA1), heart and neural crest derivatives expressed 2 (HAND2), orthopedia homeobox (OTP), PR domain containing 14 (PRDM14), Wilms tumor 1 (WT1)) were significantly methylated in our studies. Furthermore, Mori et al employed epigenetic unmasking to identify 54 genes that showed CRC-specific promoter methylation 37. Among the candidate genes, the promoters of NEL-like 1 (chicken) (NELL1), A kinase (PRKA) anchor protein 12 (AKAP12), mal, T-cell differentiation protein (MAL), SST and tachykinin, precursor 1 (TAC1) were significantly methylated in our results. Finally, methylated DNA immunoprecipitation was used to identify aberrantly methylated genes in the CRC through its application to the colorectal cancer cell line. Among the genes identified as hypermethylated in SW48, we found that two genes, ADAM metallopeptidase domain 12 (ADAM12) and zinc finger protein 677 (ZNF677), were hypermethylated in the CRC tissue compared to normal tissue 38. To our knowledge, this study is the first report of methylation profiling using Human Methylation27 DNA Analysis BeadChip® in CRC. A comparison of our results demonstrated modest overlap in the genes found to be commonly methylated in CRCs compared to previously published studies. This may represent differences in the sensitivity of the assays, differences between the cell lines and primary tumors or differences in the epigenome of tumors that occur in Western populations vs. Asian populations.
We obtained a list of 621 genes with the hypermethylated promoter in CpG islands. It is postulated that the number of epigenetically altered genes is higher than genetically altered genes in tumor tissue 35. However, the expression of all the 621 hypermethylated genes was not down-regulated in the CRC tissue compared to normal mucosa. The correlation between promoter hypermethylation and the mRNA expression level was modest at best, even though mRNA expression tended to be down-regulated in the genes showing promoter hypermethylation. This likely reflects the fact that many epigenetic and genetic alterations in cancers are passenger events that are not important in the pathogenesis of cancer 39. Moreover, multiple mechanisms regulate gene expression in addition to methylation, and these mechanisms are altered in CRC, which confound our ability to identify a correlation between methylation and gene expression. Although the expression is not down-regulated, cancer-specific promoter hypermethylation can be valuable as a biomarker.
The following interesting patterns were identified through an analysis of the methylome of CRCs: 1) genes on chromosome 18 were most frequently methylated; 2) CAN genes can be affected by mutations and aberrant methylation; and 3) genes involved in cadherin function are often subject to aberrant DNA methylation. A previous study showed that the genes on chromosome 18 were most frequently down-regulated in rectal cancer 40. In addition, a loss of chromosome 18 occurs at early stages of colorectal carcinogenesis 41. This suggests that the aberrant methylation of genes appears to cooperate with the genetic alterations to drive the initiation and progression of CRC 42. In comparison of our result with Sjoblom’s CAN genes, we could get the methylation level of 37 CAN genes with the promoter in CpG islands and the promoters of 6 genes were hypermethylated. This proportion is meaningful considering that some of 37 genes can have oncogenic effect. Ontology analysis of the genes showed that promoter hypermethylation occurred at various biological processes and molecular functions. Among them, the cadherin signaling pathway attracted attention. The cadherin gene family (E-cadherin, N-cadherin, P-cadherin) encodes the proteins that mediate calcium-ion-dependent adhesion. Cadherin-catenin complex is the central part of this pathway. It has been suggested that they are involved in colorectal carcinogenesis.
This study identified new candidates of methylation markers for CRC. Ten genes with promoter hypermethylation were validated using pyrosequencing analysis. To our knowledge, 7 genes have not been reported to undergo DNA methylation in CRC. TFPI2 is a Kunitz-type serine proteinase inhibitor that protects the extracellular matrix of cancer cells from degradation and inhibits in vitro colony formation and proliferation 43. Promoter hypermethylation of TFPI2 was observed in various cancers including esophageal cancer, gastric cancer, pancreatic cancer, cervical cancer and malignant melanoma 44–50. Methylation of TFPI2 in stool DNA was recently reported to be a potential novel biomarker for the detection of CRC 43. EYA4 encodes a protein acing as a transcriptional activator through its protein phosphatase activity, which is important for eye development and for the continued function of the mature organ of Corti51. Aberrant methylation was observed in esophageal and colorectal cancer 52–53. BOLL belongs to the DAZ gene family that is required for germ cell development. One report showed that BOLL was hypermethylated in colon cancer cell lines 35.
Other genes were reported to be associated with carcinogenesis. For example, TWIST1 promoter methylation was reported to be significantly more prevalent in malignant breast tissue than in healthy tissue 54. NPY can reduce the invasive potential of colon cancer cells in vitro 55. Further study will be needed to confirm the usefulness of these promoter hypermethylation as biomarkers and clarify the functional role of these genes in colorectal carcinogenesis. In addition, it is important to validate the methylation status and clarify the functional role of the genes with promoter hypermethylation, in which expression was down-regulated in CRC.
In conclusion, we have shown that methylation profiling based on beadchip arrays is an effective method for screening the genes with promoter hypermethylation. In addition, we identified new potential candidates of methylation markers in CRC.
Supplementary Material
ACNOWLEDGEMENT
This study was supported by Samsung Biomedical Research Institute grant, #SBRI C-B0-216-2.
REFERENCES
- 1.Grady WM, Carethers JM. Genomic and epigenetic instability in colorectal cancer pathogenesis. Gastroenterology. 2008;135:1079–1099. doi: 10.1053/j.gastro.2008.07.076. [DOI] [PMC free article] [PubMed] [Google Scholar]
- 2.Kondo Y, Issa JP. Epigenetic changes in colorectal cancer. Cancer Metastasis Rev. 2004;23:29–39. doi: 10.1023/a:1025806911782. [DOI] [PubMed] [Google Scholar]
- 3.Kim YS, Deng G. Epigenetic changes (aberrant DNA methylation) in colorectal neoplasia. Gut Liver. 2007;1:1–11. doi: 10.5009/gnl.2007.1.1.1. [DOI] [PMC free article] [PubMed] [Google Scholar]
- 4.Laird PW. The power and the promise of DNA methylation markers. Nat Rev Cancer. 2003;3:253–266. doi: 10.1038/nrc1045. [DOI] [PubMed] [Google Scholar]
- 5.Ahlquist DA, Wieand HS, Moertel CG, et al. Accuracy of fecal occult blood screening for colorectal neoplasia. A prospective study using Hemoccult and HemoQuant tests. Jama. 1993;269:1262–1267. [PubMed] [Google Scholar]
- 6.Strul H, Arber N. Fecal occult blood test for colorectal cancer screening. Ann Oncol. 2002;13:51–56. doi: 10.1093/annonc/mdf076. [DOI] [PubMed] [Google Scholar]
- 7.Collins JF, Lieberman DA, Durbin TE, Weiss DG. Accuracy of screening for fecal occult blood on a single stool sample obtained by digital rectal examination: a comparison with recommended sampling practice. Ann Intern Med. 2005;142:81–85. doi: 10.7326/0003-4819-142-2-200501180-00006. [DOI] [PubMed] [Google Scholar]
- 8.Imperiale TF, Ransohoff DF, Itzkowitz SH, Turnbull BA, Ross ME. Fecal DNA versus fecal occult blood for colorectal-cancer screening in an average-risk population. N Engl J Med. 2004;351:2704–2714. doi: 10.1056/NEJMoa033403. [DOI] [PubMed] [Google Scholar]
- 9.Tagore KS, Levin TR, Lawson MJ. The evolution to stool DNA testing for colorectal cancer. Aliment Pharmacol Ther. 2004;19:1225–1233. doi: 10.1111/j.1365-2036.2004.02005.x. [DOI] [PubMed] [Google Scholar]
- 10.Song K, Fendrick AM, Ladabaum U. Fecal DNA testing compared with conventional colorectal cancer screening methods: a decision analysis. Gastroenterology. 2004;126:1270–1279. doi: 10.1053/j.gastro.2004.02.016. [DOI] [PubMed] [Google Scholar]
- 11.Smith-Ravin J, England J, Talbot IC, Bodmer W. Detection of c-Ki-ras mutations in faecal samples from sporadic colorectal cancer patients. Gut. 1995;36:81–86. doi: 10.1136/gut.36.1.81. [DOI] [PMC free article] [PubMed] [Google Scholar]
- 12.Luo L, Chen WD, Pretlow TP. CpG island methylation in aberrant crypt foci and cancers from the same patients. Int J Cancer. 2005;115:747–751. doi: 10.1002/ijc.20936. [DOI] [PubMed] [Google Scholar]
- 13.Li H, Myeroff L, Smiraglia D, et al. SLC5A8, a sodium transporter, is a tumor suppressor gene silenced by methylation in human colon aberrant crypt foci and cancers. Proc Natl Acad Sci U S A. 2003;100:8412–8417. doi: 10.1073/pnas.1430846100. [DOI] [PMC free article] [PubMed] [Google Scholar]
- 14.Chan AO, Broaddus RR, Houlihan PS, Issa JP, Hamilton SR, Rashid A. CpG island methylation in aberrant crypt foci of the colorectum. Am J Pathol. 2002;160:1823–1830. doi: 10.1016/S0002-9440(10)61128-5. [DOI] [PMC free article] [PubMed] [Google Scholar]
- 15.Kim YH, Petko Z, Dzieciatkowski S, et al. CpG island methylation of genes accumulates during the adenoma progression step of the multistep pathogenesis of colorectal cancer. Genes Chromosomes Cancer. 2006;45:781–789. doi: 10.1002/gcc.20341. [DOI] [PubMed] [Google Scholar]
- 16.Cunningham JM, Christensen ER, Tester DJ, Kim CY, Roche PC, Burgart LJ, Thibodeau SN. Hypermethylation of the hMLH1 promoter in colon cancer with microsatellite instability. Cancer Res. 1998;58:3455–3460. [PubMed] [Google Scholar]
- 17.Herman JG, Umar A, Polyak K, et al. Incidence and functional consequences of hMLH1 promoter hypermethylation in colorectal carcinoma. Proc Natl Acad Sci U S A. 1998;95:6870–6875. doi: 10.1073/pnas.95.12.6870. [DOI] [PMC free article] [PubMed] [Google Scholar]
- 18.Wheeler JM, Beck NE, Kim HC, Tomlinson IP, Mortensen NJ, Bodmer WF. Mechanisms of inactivation of mismatch repair genes in human colorectal cancer cell lines: the predominant role of hMLH1. Proc Natl Acad Sci U S A. 1999;96:10296–10301. doi: 10.1073/pnas.96.18.10296. [DOI] [PMC free article] [PubMed] [Google Scholar]
- 19.Kane MF, Loda M, Gaida GM, et al. Methylation of the hMLH1 promoter correlates with lack of expression of hMLH1 in sporadic colon tumors and mismatch repair-defective human tumor cell lines. Cancer Res. 1997;57:808–811. [PubMed] [Google Scholar]
- 20.Veigl ML, Kasturi L, Olechnowicz J, et al. Biallelic inactivation of hMLH1 by epigenetic gene silencing, a novel mechanism causing human MSI cancers. Proc Natl Acad Sci U S A. 1998;95:8698–8702. doi: 10.1073/pnas.95.15.8698. [DOI] [PMC free article] [PubMed] [Google Scholar]
- 21.Suzuki H, Watkins DN, Jair KW, et al. Epigenetic inactivation of SFRP genes allows constitutive WNT signaling in colorectal cancer. Nat Genet. 2004;36:417–422. doi: 10.1038/ng1330. [DOI] [PubMed] [Google Scholar]
- 22.Chen WD, Han ZJ, Skoletsky J, et al. Detection in fecal DNA of colon cancer-specific methylation of the nonexpressed vimentin gene. J Natl Cancer Inst. 2005;97:1124–1132. doi: 10.1093/jnci/dji204. [DOI] [PubMed] [Google Scholar]
- 23.Petko Z, Ghiassi M, Shuber A, et al. Aberrantly methylated CDKN2A, MGMT, and MLH1 in colon polyps and in fecal DNA from patients with colorectal polyps. Clin Cancer Res. 2005;11:1203–1209. [PubMed] [Google Scholar]
- 24.Grady WM, Rajput A, Lutterbaugh JD, Markowitz SD. Detection of aberrantly methylated hMLH1 promoter DNA in the serum of patients with microsatellite unstable colon cancer. Cancer Res. 2001;61:900–902. [PubMed] [Google Scholar]
- 25.Adorjan P, Distler J, Lipscher E, et al. Tumour class prediction and discovery by microarray-based DNA methylation analysis. Nucleic Acids Res. 2002;30:e21. doi: 10.1093/nar/30.5.e21. [DOI] [PMC free article] [PubMed] [Google Scholar]
- 26.Teodoridis JM, Hall J, Marsh S, et al. CpG island methylation of DNA damage response genes in advanced ovarian cancer. Cancer Res. 2005;65:8961–8967. doi: 10.1158/0008-5472.CAN-05-1187. [DOI] [PubMed] [Google Scholar]
- 27.Toyota M, Suzuki H, Yamashita T, Hirata K, Imai K, Tokino T, Shinomura Y. Cancer epigenomics: implications of DNA methylation in personalized cancer therapy. Cancer Sci. 2009;100:787–791. doi: 10.1111/j.1349-7006.2009.01095.x. [DOI] [PMC free article] [PubMed] [Google Scholar]
- 28.de Maat MF, van de Velde CJ, van der Werff MP, et al. Quantitative analysis of methylation of genomic loci in early-stage rectal cancer predicts distant recurrence. J Clin Oncol. 2008;26:2327–2335. doi: 10.1200/JCO.2007.14.0723. [DOI] [PubMed] [Google Scholar]
- 29.Ogino S, Nosho K, Kirkner GJ, et al. A cohort study of tumoral LINE-1 hypomethylation and prognosis in colon cancer. J Natl Cancer Inst. 2008;100:1734–1738. doi: 10.1093/jnci/djn359. [DOI] [PMC free article] [PubMed] [Google Scholar]
- 30.Griffiths EA, Gore SD. DNA methyltransferase and histone deacetylase inhibitors in the treatment of myelodysplastic syndromes. Semin Hematol. 2008;45:23–30. doi: 10.1053/j.seminhematol.2007.11.007. [DOI] [PMC free article] [PubMed] [Google Scholar]
- 31.Lopez J, Percharde M, Coley HM, Webb A, Crook T. The context and potential of epigenetics in oncology. Br J Cancer. 2009;100:571–577. doi: 10.1038/sj.bjc.6604930. [DOI] [PMC free article] [PubMed] [Google Scholar]
- 32.Bibikova M, Lin Z, Zhou L, et al. High-throughput DNA methylation profiling using universal bead arrays. Genome Res. 2006;16:383–393. doi: 10.1101/gr.4410706. [DOI] [PMC free article] [PubMed] [Google Scholar]
- 33.Bibikova M, Chudin E, Wu B, et al. Human embryonic stem cells have a unique epigenetic signature. Genome Res. 2006;16:1075–1083. doi: 10.1101/gr.5319906. [DOI] [PMC free article] [PubMed] [Google Scholar]
- 34.Sjoblom T, Jones S, Wood LD, et al. The consensus coding sequences of human breast and colorectal cancers. Science. 2006;314:268–274. doi: 10.1126/science.1133427. [DOI] [PubMed] [Google Scholar]
- 35.Schuebel KE, Chen W, Cope L, et al. Comparing the DNA hypermethylome with gene mutations in human colorectal cancer. PLoS Genet. 2007;3:1709–1723. doi: 10.1371/journal.pgen.0030157. [DOI] [PMC free article] [PubMed] [Google Scholar]
- 36.Estecio MR, Yan PS, Ibrahim AE, Tellez CS, Shen L, Huang TH, Issa JP. High-throughput methylation profiling by MCA coupled to CpG island microarray. Genome Res. 2007;17:1529–1536. doi: 10.1101/gr.6417007. [DOI] [PMC free article] [PubMed] [Google Scholar]
- 37.Mori Y, Cai K, Cheng Y, et al. A genome-wide search identifies epigenetic silencing of somatostatin, tachykinin-1, and 5 other genes in colon cancer. Gastroenterology. 2006;131:797–808. doi: 10.1053/j.gastro.2006.06.006. [DOI] [PubMed] [Google Scholar]
- 38.Weber M, Davies JJ, Wittig D, Oakeley EJ, Haase M, Lam WL, Schubeler D. Chromosome-wide and promoter-specific analyses identify sites of differential DNA methylation in normal and transformed human cells. Nat Genet. 2005;37:853–862. doi: 10.1038/ng1598. [DOI] [PubMed] [Google Scholar]
- 39.Maley CC, Galipeau PC, Li X, Sanchez CA, Paulson TG, Reid BJ. Selectively advantageous mutations and hitchhikers in neoplasms: p16 lesions are selected in Barrett's esophagus. Cancer Res. 2004;64:3414–3427. doi: 10.1158/0008-5472.CAN-03-3249. [DOI] [PubMed] [Google Scholar]
- 40.Lips EH, van Eijk R, de Graaf EJ, et al. Integrating chromosomal aberrations and gene expression profiles to dissect rectal tumorigenesis. BMC Cancer. 2008;8:314. doi: 10.1186/1471-2407-8-314. [DOI] [PMC free article] [PubMed] [Google Scholar]
- 41.Cardoso J, Boer J, Morreau H, Fodde R. Expression and genomic profiling of colorectal cancer. Biochim Biophys Acta. 2007;1775:103–137. doi: 10.1016/j.bbcan.2006.08.004. [DOI] [PubMed] [Google Scholar]
- 42.Grady WM. Epigenetic events in the colorectum and in colon cancer. Biochem Soc Trans. 2005;33:684–688. doi: 10.1042/BST0330684. [DOI] [PubMed] [Google Scholar]
- 43.Glockner SC, Dhir M, Yi JM, et al. Methylation of TFPI2 in Stool DNA: A Potential Novel Biomarker for the Detection of Colorectal Cancer. Cancer Res. 2009 doi: 10.1158/0008-5472.CAN-08-0142. [DOI] [PMC free article] [PubMed] [Google Scholar]
- 44.Tsunoda S, Smith E, De Young NJ, et al. Methylation of CLDN6, FBN2, RBP1, RBP4, TFPI2, and TMEFF2 in esophageal squamous cell carcinoma. Oncol Rep. 2009;21:1067–1073. doi: 10.3892/or_00000325. [DOI] [PubMed] [Google Scholar]
- 45.Tanemura A, Terando AM, Sim MS, van Hoesel AQ, de Maat MF, Morton DL, Hoon DS. CpG island methylator phenotype predicts progression of malignant melanoma. Clin Cancer Res. 2009;15:1801–1807. doi: 10.1158/1078-0432.CCR-08-1361. [DOI] [PMC free article] [PubMed] [Google Scholar]
- 46.Jee CD, Kim MA, Jung EJ, Kim J, Kim WH. Identification of genes epigenetically silenced by CpG methylation in human gastric carcinoma. Eur J Cancer. 2009;45:1282–1293. doi: 10.1016/j.ejca.2008.12.027. [DOI] [PubMed] [Google Scholar]
- 47.Parsi MA, Li A, Li CP, Goggins M. DNA methylation alterations in endoscopic retrograde cholangiopancreatography brush samples of patients with suspected pancreaticobiliary disease. Clin Gastroenterol Hepatol. 2008;6:1270–1278. doi: 10.1016/j.cgh.2008.07.007. [DOI] [PMC free article] [PubMed] [Google Scholar]
- 48.Hong SM, Kelly D, Griffith M, et al. Multiple genes are hypermethylated in intraductal papillary mucinous neoplasms of the pancreas. Mod Pathol. 2008;21:1499–1507. doi: 10.1038/modpathol.2008. [DOI] [PMC free article] [PubMed] [Google Scholar]
- 49.Liu S, Ren S, Howell P, Fodstad O, Riker AI. Identification of novel epigenetically modified genes in human melanoma via promoter methylation gene profiling. Pigment Cell Melanoma Res. 2008;21:545–558. doi: 10.1111/j.1755-148X.2008.00484.x. [DOI] [PubMed] [Google Scholar]
- 50.Sova P, Feng Q, Geiss G, et al. Discovery of novel methylation biomarkers in cervical carcinoma by global demethylation and microarray analysis. Cancer Epidemiol Biomarkers Prev. 2006;15:114–123. doi: 10.1158/1055-9965.EPI-05-0323. [DOI] [PubMed] [Google Scholar]
- 51.Tootle TL, Silver SJ, Davies EL, et al. The transcription factor Eyes absent is a protein tyrosine phosphatase. Nature. 2003;426:299–302. doi: 10.1038/nature02097. [DOI] [PubMed] [Google Scholar]
- 52.Zou H, Osborn NK, Harrington JJ, Klatt KK, Molina JR, Burgart LJ, Ahlquist DA. Frequent methylation of eyes absent 4 gene in Barrett's esophagus and esophageal adenocarcinoma. Cancer Epidemiol Biomarkers Prev. 2005;14:830–834. doi: 10.1158/1055-9965.EPI-04-0506. [DOI] [PubMed] [Google Scholar]
- 53.Osborn NK, Zou H, Molina JR, et al. Aberrant methylation of the eyes absent 4 gene in ulcerative colitis-associated dysplasia. Clin Gastroenterol Hepatol. 2006;4:212–218. doi: 10.1016/j.cgh.2005.11.009. [DOI] [PubMed] [Google Scholar]
- 54.Gort EH, Suijkerbuijk KP, Roothaan SM, Raman V, Vooijs M, van der Wall E, van Diest PJ. Methylation of the TWIST1 promoter, TWIST1 mRNA levels, and immunohistochemical expression of TWIST1 in breast cancer. Cancer Epidemiol Biomarkers Prev. 2008;17:3325–3330. doi: 10.1158/1055-9965.EPI-08-0472. [DOI] [PubMed] [Google Scholar]
- 55.Ogasawara M, Murata J, Ayukawa K, Saiki I. Differential effect of intestinal neuropeptides on invasion and migration of colon carcinoma cells in vitro. Cancer Lett. 1997;119:125–130. doi: 10.1016/s0304-3835(97)81762-4. [DOI] [PubMed] [Google Scholar]
Associated Data
This section collects any data citations, data availability statements, or supplementary materials included in this article.