

Abstract
Background
Oral clefts are common congenital anomalies and result from defects during embryogenesis. The complex etiology is evident by the number of genes and signaling pathways involved in craniofacial development. Matrix metalloproteinases (MMPs) and their inhibitors TIMPs are responsible for tissue remodeling during craniofacial development.
Methods
In this study, we investigated the association of polymorphisms in 14 biologically relevant MMP and TIMP genes in 494 individuals with oral clefts and 413 control individuals from Brazil. Genotypes were generated using Taqman chemistry. Analyses were performed using PLINK software.
Results
Polymorphisms in MMP3 (rs522616) and TIMP2 (rs8179096) showed significant association with all cleft types (all clefts, cleft lip/palate, and cleft palate) (P≤0.002). An additional family-based dataset (881 case-parent trios) from the US was used for confirmation of the association findings (P<0.05). Analysis of gene-gene interaction suggests that MMP3 and TIMP2 may interactively contribute to a cleft phenotype.
Conclusions
This study provides new evidence that variation in MMP3 may contribute to nonsyndromic oral clefts and further supports the involvement of TIMP2 as a cleft susceptibility gene. Although additional studies are still necessary to unveil the exact mechanism by which MMP3 and TIMP2 would contribute to a cleft phenotype, allelic polymorphisms in these genes and their interactions may partly explain the variance of individual susceptibility to oral clefts.
Keywords: MMP, TIMP, cleft lip, palate, polymorphism, promoter
INTRODUCTION
Nonsyndromic oral clefts account for approximately 65% of all craniofacial anomalies in humans and arise when the fronto-nasal and maxillary prominences of the embryonic face fail to unite. In addition to lifelong medical interventions, significant social and economic complications are imposed to affected individuals and their families (Marazita and Mooney, 2004). The prevalence of oral clefts ranges from 1 in 700 to 2000 births and varies considerably by ancestral origin, with the highest incidence in Asian populations followed by Caucasian and African populations (Mossey and Little, 2002). Oral clefts have a complex etiology and several genes have been suggested to play a role in the susceptibility to oral clefts (Vieira, 2008). By tradition, oral clefts have been referred to as cleft lip with or without cleft palate (CL/P) and cleft palate only (CPO), due to differences in embryology (Murray, 2002).
Matrix metalloproteinases (MMPs) are a family of zinc-dependent proteases responsible for tissue remodeling due to their role in extracellular matrix remodeling, degrading molecules from the extracellular matrix and basement membranes, and in promoting cell migration and proliferation. Together with their tissue inhibitors (TIMPs), MMPs have key roles during embryogenesis and homeostasis of adult tissues (Nagase et al., 2006). Remodeling of the extracellular matrix is a crucial event to accommodate specific interactions that ultimately result in proper tissue morphogenesis during craniofacial and palate development. Hence, disturbances that affect extracellular matrix remodeling may in turn lead to defects during palatogenesis (Iamaroon et al., 1996).
Expression of MMPs and TIMPs mRNA and protein has been detected in the developing mouse palate, in specific spatial and temporal distribution patterns in areas where their preferred substrates are located (Morris-Wiman et al., 2000; Blavier et al., 2001; Brown et al., 2002; de Oliveira Demarchi et al, 2010). Moreover, absence of MMP activity has been shown to result in failure of palatal shelf fusion in vitro and in vivo (Blavier et al., 2001; Brown et al., 2002). Although a single MMP gene knockout in mouse does not cause clefting, inactivating mutations of both Mmp14 and Mmp16 yielded severe structural and craniofacial defects including a severe dysfunction in palatal shelf formation leading to cleft palate in 80% of the mouse embryos (Shi et al., 2008).
We have previously reported the association of a polymorphism in the MMP3 gene (rs3025058) with cleft lip/palate in a population-based sample from Brazil (Letra et al., 2007). This polymorphism consists of a common adenine insertion/deletion polymorphism at position -1171 of the MMP3 gene promoter, where the 5A allele has been correlated with higher transcriptional activity (Ye et al., 1996). Variants in or nearby MMP25 and TIMP2 have also presented suggestive association with oral clefts (Blanton et al., 2004; Nikopensius et al., 2011).
Taken together, previous evidence from biological and human studies support a role for MMP and TIMP genes as likely candidate genes for the occurrence of oral clefts. In the present study, we investigated 14 biologically relevant MMP and TIMP genes for association with cleft phenotypes in a case-control dataset from Brazil. An additional family-based dataset from the US was used for confirmation of the association findings.
MATERIALS AND METHODS
Sample Population
This population has been described in part elsewhere (Letra et al., 2007). The case-control dataset consisted in 907 unrelated individuals recruited at the Hospital of Rehabilitation and Craniofacial Anomalies, Bauru Dental School, University of Sao Paulo, and at the Center for Treatment of Craniofacial Anomalies, Rio de Janeiro, Brazil. Of these, 494 individuals (aged 1–59, mean age 18) considered nonsyndromic according to geneticists’ assessments, presented an oral cleft: 10 with cleft lip (CL), 411 with cleft lip and palate (CLP), and 73 with cleft palate (CP). The controls were comprised of 413 unrelated individuals (aged 5–72, mean age 28) without clefts or family history of clefts. To control for possible population admixture effects in cases and controls, only individuals from the Southeastern region of Brazil, reporting Caucasian ascendants to the second generation were included in the study.
This study was approved by the Institutional Review Boards at each subject recruitment site, at the University of Pittsburgh, and the University of Texas Health Science Center at Houston. Participants signed an informed consent and provided a saliva sample as source of genomic DNA.
Selection of Candidate Genes and Single Nucleotide Polymorphisms (SNPs)
We selected ten MMP and four TIMP genes to be studied considering: 1) expression during craniofacial development; 2) location being in or near a cleft locus; 3) presence of substrate in the palatal matrix; 4) previous association with oral clefts. We excluded genes whose roles are not relevant for craniofacial development, or when available information was not sufficient to fit the selection criteria. Next, we selected 45 polymorphisms based on their likelihood to have functional consequences (i.e., located in the promoters, exons, or near exon/intron boundaries), or if considered tag-SNPs as surrogates for the linkage disequilibrium blocks surrounding the candidate gene. We used information from the NCBI dbSNP (http://www.ncbi.nlm.gov/SNP/) and the International HapMap Project (http://www.hapmap.org) databases (Table 1).
Table 1.
Details of the genes and single nucleotide polymorphisms investigated.
| Gene | dbSNP ID | Location (chromosome, base position) | SNP Function | Position in sequence (nucleotide change)a | Allelesb |
|---|---|---|---|---|---|
| MMP2 | rs243865 | chr.16, 54069297 | 5′ near gene - promoter | -1306 C/T | C/T |
| rs2285053 | chr.16, 54069878 | 5′ near gene - promoter | -735 C/T | C/T | |
| rs243847 | chr.16, 54081499 | Intron | T/C | ||
| rs2287074 | chr.16, 54084614 | Coding synonymous | Thr460Thr (exon 9) | G/A | |
| rs9923304 | chr.16, 54087802 | Intron | C/T | ||
| rs28730814 | chr.16, 54088365 | Intron | A/G | ||
| rs11639960 | chr.16, 54090771 | Intron | A/G | ||
|
| |||||
| MMP3 | rs639752 | chr.11, 102212549 | Intron | T/G | |
| rs650108 | chr.11, 102213997 | Intron | G/A | ||
| rs520540 | chr.11, 102214635 | Coding synonymous | Ala362Ala (exon 8) | G/A | |
| rs3025065 | chr.11, 102216192 | Coding synonymous | Gly264Gly | A/G | |
| rs11606831 | chr.11, 102218625 | Missense | His113Pro | G/T | |
| rs679620 | chr.11, 102218830 | Missense | Lys45Glu (exon 2) | G/A | |
| rs522616 | chr.11, 102220258 | 5′ near gene – promoter | -709 A/G | A/G | |
| rs3025058 | chr.11, 102221152 | 5′ near gene - promoter | -1171 5A/6A | 5A/6A | |
|
| |||||
| MMP7 | rs11568819 | chr.11, 101906843 | 5′ near gene – promoter | -153 C/T | C/T |
| rs11568818 | chr.11, 101906871 | 5′ near gene – promoter | -181 A/G | A/G | |
|
| |||||
| MMP9 | rs3918253 | chr.20, 44072918 | Intron | 49 5′ exon 4 | C/T |
| rs17576 | chr.20, 44073632 | Missense | Gln279Arg | A/G | |
| rs17577 | chr.20, 44076518 | Missense | Gln668Arg (exon 12) | G/A | |
|
| |||||
| MMP10 | rs17860973 | chr.11, 102152308 | Missense | Gly282Glu | G/A |
| rs17860971 | chr.11, 102152662 | Missense | Phe226Leu | T/G | |
| rs17293607 | chr.11, 102155599 | Missense | Gly65Arg (exon 2) | C/T | |
|
| |||||
| MMP13 | rs478927 | chr.11, 102330036 | Intron | A/G | |
| rs12295719 | chr.11, 102331288 | Missense | Asp89HIs | C/G | |
| rs2252070 | chr.11, 102331749 | 5′ near gene – promoter | -77 A/G | G/A | |
|
| |||||
| MMP14 | rs17123036 | chr.14, 22375133 | 5′ near gene – promoter | -165 GT | A/G |
| rs1042704 | chr.14, 22382434 | Missense | Asn273Asp | A/G | |
|
| |||||
| MMP16 | rs2616490 | chr.8, 89150846 | Missense | Ile415Val | A/G |
| rs7828497 | chr.8, 89408837 | 5′ near gene – promoter | T/G | ||
|
| |||||
| MMP25 | rs2360167 | chr.16, 3036160 | 5′ near gene - promoter | G/T | |
|
| |||||
| MMP27 | rs61995943 | chr.11, 102067834 | Nonsense | Ser472OPA | C/G |
| rs2509010 | chr.11, 102067910 | Missense | Asp447Asn | C/T | |
| rs12099177 | chr.11, 102081592 | Missense | Arg22Trp | G/A | |
| rs11225389 | chr.11, 102081678 | 5′ untranslated region | C/A | ||
|
| |||||
| TIMP1 | rs6520279 | chr.X, 47204350 | Intron | C/T | |
| rs5906435 | chr.X, 47204664 | Intron | C/T | ||
| rs1062849 | chr.X, 47330943 | Missense | Ser178Phe | C/T | |
|
| |||||
| TIMP2 | rs4789940 | chr.17, 74389266 | Intron | G/T | |
| rs8179096 | chr.17, 74433244 | 5′ near gene – promoter | -177 C/T | C/T | |
| rs9747145 | chr.17, 74434703 | 5′ near gene – promoter | G/T | ||
| rs9894526 | chr.17, 74438681 | 5′ near gene - promoter | C/T | ||
|
| |||||
| TIMP3 | rs34586282 | chr.22, 31526804 | Frameshift | Cys155V | -/G |
| rs34334473 | chr.22, 31585191 | 5′ untranslated region | A/G | ||
|
| |||||
| TIMP4 | rs3755724 | chr.3, 12175906 | 5′ near gene promoter | -55C/T | C/T |
According to NCBI Reference Assembly.
Ancestral allele listed first according to NCBI Reference Assembly.
Genotyping
Genomic DNA was extracted from saliva as described elsewhere (Trevillato and Line, 2000). DNA concentration was estimated by measuring the absorbance at 260nm in a Nanodrop spectrophotometer (Thermo Scientific, Wilmington, DE). Genotypes were generated using Taqman chemistry (Ranade et al., 2001)in an ABI 7900 instrument (Applied Biosystems, Foster City, CA). Reactions were carried out with the use of standard conditions as suggested by the manufacturer. For quality control purposes, negative control reactions were performed using no nucleic acid template; positive control reactions were performed using samples of known genotypes. Genotyping was performed blind to sample status.
Statistical Analyses
Markers were assessed for Hardy-Weinberg equilibrium in controls and affected individuals using a Pearson’s chi-square test. LD measures were calculated, and haplotype blocks were defined using the confidence interval method. Haplotype frequencies were estimated using Haploview 4.1 software (http://www.broadinstitute.org/haploview).
Differences in allele frequencies between individuals with oral clefts and controls were compared for each SNP using PLINK software version 1.05 (Purcell et al., 2007).Due to the small number of individuals in the CL group (n=11), these individuals were grouped with the CLP individuals, thus forming a cleft lip with or without cleft palate (CL/P) analysis group. Analyses were performed comparing all clefts with controls, and then comparing CL/P, and CP with controls. Allelic odds ratios (ORs) and 95% confidence intervals (CI) were also calculated. We corrected for multiple testing using the Bonferroni method considering the number of variables and tests performed, and P-values below 0.002 were considered significant. Logistic regression analyses were performed under an additive model to assess the significance of the minor allele copy number on the association. Haplotype analyses were performed using 2-, 3-, and 4-SNP sliding windows.
Prediction of SNP functionality
We performed in silico analyses of SNP function to search for potential transcription factor binding sites in the sequence of the associated variants. We used the following prediction programs: AliBaba2.1 (Grabe, 2002), TESS (Transcription Element Search System) (Schug, 2008) and FastSNP (Yuan et al., 2006).
Confirmation Dataset
We tested 5 SNPs of interest in MMP3 and 7 SNPs in TIMP2 in an independent dataset of 881 CL/P families ascertained in the US (545 non-Hispanic white and 336 Hispanic families from Texas). These included the SNPs associated in the case-control dataset. Details are available as Supplemental Material.
Analyses were performed stratified by population using Pedigree Disequilibrium test (PDT), Genotype-pedigree disequilibrium test (Geno-PDT), and Association in the Presence of Linkage (APL) as previously described (Chiquet et al., 2007). A P≤ 0.05 was considered statistically significant.
Gene-Gene Interaction
We looked for evidence of gene-gene interaction between MMP3 and TIMP2 by calculating the proportion of cleft cases presenting at least one copy of the associated alleles (A and C, respectively), and comparing to controls. Analysis was performed using Mantel-Haenszel statistics. A P-value ≤ 0.05 indicated statistical significance.
RESULTS
Eleven SNPs were not informative in our population (Table 2). Minor allele frequency was < 10% for MMP14 rs17123036, MMP27 rs12099177, and TIMP1 rs1062849. TIMP2 rs4789940 showed deviation from Hardy-Weinberg equilibrium. These markers were excluded from further analyses.
Table 2.
Results of association tests with MMP and TIMP gene polymorphisms and nonsyndromic oral clefts.
| SNP | Minor Allele | Minor allele frequency | All Clefts (n=494) | Cleft Lip/Palate (n=421) | Cleft Palate (n=73) | |||||||
|---|---|---|---|---|---|---|---|---|---|---|---|---|
|
| ||||||||||||
| Cases (n=494) | Controls (n=413) | P-value | Odds ratio | 95% CI | P-value | Odds ratio | 95% CI | P-value | Odds ratio | 95% CI | ||
| MMP2 | ||||||||||||
| rs243865 | T | 0.17 | 0.18 | 0.7534 | 0.96 | 0.75–1.23 | 0.9349 | 1.01 | 0.78–1.31 | 0.1115 | 0.66 | 0.40–1.10 |
| rs2285053 | T | 0.13 | 0.15 | 0.2534 | 0.85 | 0.65–1.12 | 0.2577 | 0.85 | 0.63–1.13 | 0.4920 | 0.83 | 0.50–1.40 |
| rs243847 | C | 0.36 | 0.37 | 0.8483 | 0.98 | 0.81–1.20 | 0.8652 | 1.02 | 0.83–1.25 | 0.3408 | 0.84 | 0.58–1.21 |
| rs2287074 | A | 0.38 | 0.39 | 0.6948 | 0.96 | 0.79–1.16 | 0.7184 | 0.96 | 0.79–1.18 | 0.8303 | 0.96 | 0.67–1.37 |
| rs9923304 | T | 0.37 | 0.37 | 0.8485 | 0.98 | 0.81–1.19 | 0.8040 | 0.97 | 0.79–1.20 | 0.9465 | 0.99 | 0.69–1.42 |
| rs11639960 | G | 0.32 | 0.32 | 0.8882 | 0.99 | 0.81–1.20 | 0.9595 | 1.01 | 0.81–1.24 | 0.6831 | 0.92 | 0.63–1.35 |
|
| ||||||||||||
| MMP3 | ||||||||||||
| rs639752 | G | 0.48 | 0.46 | 0.3896 | 1.09 | 0.90–1.31 | 0.9479 | 0.99 | 0.81–1.21 | 0.0102 | 1.58 | 1.11–2.25 |
| rs650108 | G | 0.32 | 0.33 | 0.7042 | 0.96 | 0.79–1.17 | 0.7256 | 1.04 | 0.84–1.28 | 0.0448 | 0.67 | 0.45–0.99 |
| rs520540 | A | 0.45 | 0.46 | 0.6774 | 0.96 | 0.80–1.16 | 0.2865 | 0.90 | 0.74–1.10 | 0.0924 | 1.35 | 0.95–1.91 |
| rs679620 | A | 0.45 | 0.44 | 0.7039 | 1.04 | 0.86–1.25 | 0.7826 | 0.97 | 0.79–1.19 | 0.0519 | 1.41 | 1.00–2.00 |
| rs522616 | G | 0.28 | 0.39 | 0.000003 | 0.62 | 0.51–0.76 | 0.0003 | 0.68 | 0.55–0.84 | 0.0022 | 0.55 | 0.37–0.81 |
| rs3025058 | 5A | 0.41 | 0.41 | 0.9395 | 0.99 | 0.82–1.20 | 0.5099 | 0.93 | 0.76–1.14 | 0.0821 | 1.36 | 0.96–1.93 |
| MMP7 | ||||||||||||
| rs11568818 | G | 0.42 | 0.42 | 0.7878 | 1.03 | 0.85–1.24 | 0.6497 | 1.05 | 0.86–1.28 | 0.7246 | 0.94 | 0.66–1.34 |
|
| ||||||||||||
| MMP9 | ||||||||||||
| rs3918253 | C | 0.51 | 0.47 | 0.1493 | 1.15 | 0.95–1.38 | 0.0266 | 0.80 | 0.66–0.97 | 0.2550 | 0.82 | 0.57–1.16 |
| rs17576 | G | 0.31 | 0.32 | 0.7042 | 0.96 | 0.78–1.17 | 0.8695 | 0.98 | 0.79–1.22 | 0.6280 | 0.91 | 0.62–1.33 |
| rs17577 | G | 0.11 | 0.12 | 0.8298 | 0.97 | 0.72–1.29 | 0.6063 | 0.92 | 0.68–1.26 | 0.8139 | 1.07 | 0.63–1.80 |
|
| ||||||||||||
| MMP10 | ||||||||||||
| rs17293607 | T | 0.15 | 0.18 | 0.0602 | 0.78 | 0.60–1.01 | 0.0711 | 0.78 | 0.59–1.02 | 0.6971 | 0.91 | 0.57–1.45 |
|
| ||||||||||||
| MMP13 | ||||||||||||
| rs478927 | G | 0.37 | 0.34 | 0.1400 | 1.19 | 0.94–1.48 | 0.0905 | 1.23 | 0.97–1.57 | 0.3157 | 0.78 | 0.49–1.26 |
| rs2252070 | G | 0.34 | 0.33 | 0.7859 | 1.03 | 0.84–1.25 | 0.6330 | 1.05 | 0.85–1.29 | 0.1854 | 0.77 | 0.53–1.13 |
|
| ||||||||||||
| MMP14 | ||||||||||||
| rs1042704 | A | 0.14 | 0.13 | 0.7171 | 1.05 | 0.80–1.38 | 0.9188 | 0.98 | 0.73–1.32 | 0.0551 | 1.55 | 0.99–2.44 |
|
| ||||||||||||
| MMP16 | ||||||||||||
| rs7828497 | G | 0.32 | 0.26 | 0.0125 | 1.30 | 1.05–1.60 | 0.0182 | 1.30 | 1.05–1.61 | 0.3107 | 1.22 | 0.83–1.78 |
| rs2616490 | G | 0.39 | 0.37 | 0.3350 | 1.10 | 0.90–1.32 | 0.1529 | 1.16 | 0.95–1.42 | 0.2491 | 0.81 | 0.56–1.16 |
|
| ||||||||||||
| MMP25 | ||||||||||||
| rs2360167 | T | 0.24 | 0.22 | 0.6027 | 1.06 | 0.85–1.32 | 0.7500 | 1.04 | 0.82–1.32 | 0.4212 | 1.18 | 0.79–1.77 |
|
| ||||||||||||
| MMP27 | ||||||||||||
| rs2509010 | T | 0.23 | 0.23 | 0.9885 | 1.00 | 0.80–1.25 | 0.9578 | 1.01 | 0.80–1.27 | 0.7531 | 1.07 | 0.71–1.61 |
| rs11225389 | A | 0.17 | 0.19 | 0.1915 | 0.85 | 0.67–1.08 | 0.0977 | 0.80 | 0.62–1.04 | 0.1533 | 1.35 | 0.89–2.03 |
|
| ||||||||||||
| TIMP1 | ||||||||||||
| rs5906435 | T | 0.28 | 0.25 | 0.2301 | 1.16 | 0.91–1.48 | 0.7173 | 1.05 | 0.81–1.36 | 0.0446 | 1.54 | 1.01–2.36 |
| rs6520279 | C | 0.43 | 0.42 | 0.5119 | 1.16 | 0.91–1.48 | 0.8497 | 1.02 | 0.81–1.29 | 0.4273 | 1.17 | 0.79–1.74 |
|
| ||||||||||||
| TIMP2 | ||||||||||||
| rs8179096 | T | 0.08 | 0.13 | 0.0004 | 0.57 | 0.41–0.77 | 0.0018 | 0.59 | 0.42–0.82 | 0.0007 | 0.23 | 0.09–0.58 |
| rs9894526 | T | 0.47 | 0.45 | 0.3055 | 1.10 | 0.91–1.33 | 0.2676 | 1.12 | 0.92–1.36 | 0.9223 | 0.98 | 0.69–1.40 |
P≤ 0.002 indicates statistical significance under Bonferroni correction (in bold).
The following SNPs were non informative or presented minor allele frequency < 10% in the studied population and therefore excluded from the association analyses: rs28730814 (MMP2), rs3025065 and rs11606831 (MMP3), rs11568818 (MMP7), rs17860973 and rs17860971 (MMP10), rs12295719 (MMP13), rs17123036 (MMP14), rs61995943 and rs12099177 (MMP27), rs9747145 (TIMP2), rs34586282 and rs34334473 (TIMP3), and rs3755724 (TIMP4). TIMP2 rs4789940 showed deviation from Hardy-Weinberg equilibrium and was also excluded from further analyses.
Association analyses
The results of the association analyses are presented in Table 2. We found significant differences in allelic frequencies for SNPs in the promoter of MMP3 and TIMP2 genes between all cleft phenotypes and controls. The ancestral allele in MMP3 rs522616 was associated with increased risk of oral clefts (P=0.000003 for all clefts; P=0.0003 for cleft lip/palate; and P=0.002 for cleft palate). Similarly, the ancestral allele in TIMP2 rs8179096 also showed significant association with all clefts (P=0.0004), P=0.002 for cleft lip/palate; and P=0.0007 for cleft palate) (Table 2). Under a nominal threshold of 0.05, SNPs in MMP9, MMP16 and TIMP1 also showed association with cleft phenotypes. A nonsignificant trend for association of MMP3 rs3025058 (associated in the original report by Letra et al., 2007) was also observed in the CP group (p=0.08) (Table 2). Logistic regression supported the individual associations for MMP3 rs522616 (P=0.00002 for all clefts, P=0.0009 for cleft lip and palate, and P=0.006 for cleft palate) and TIMP2 rs8179096 (P=0.004 for all clefts; P=0.01 for cleft lip and palate, and P=0.02 for cleft palate) (data not shown).
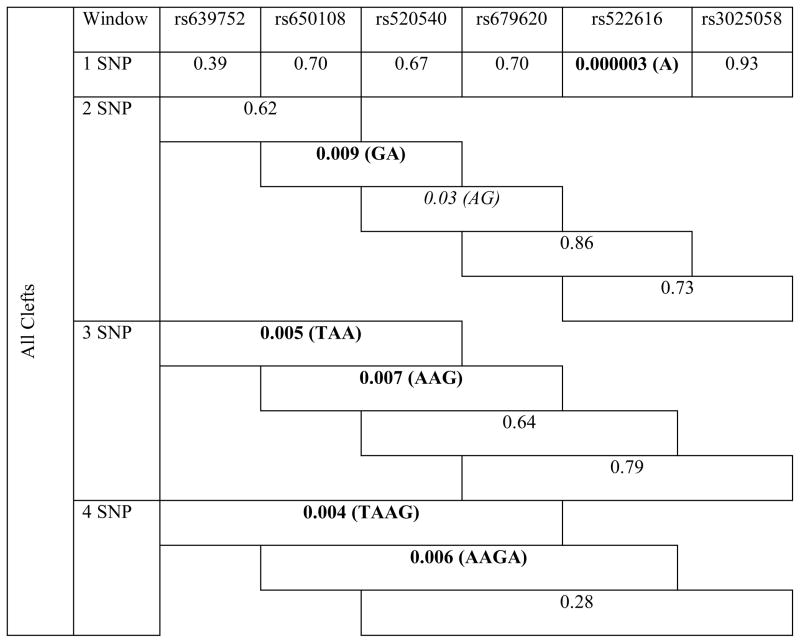
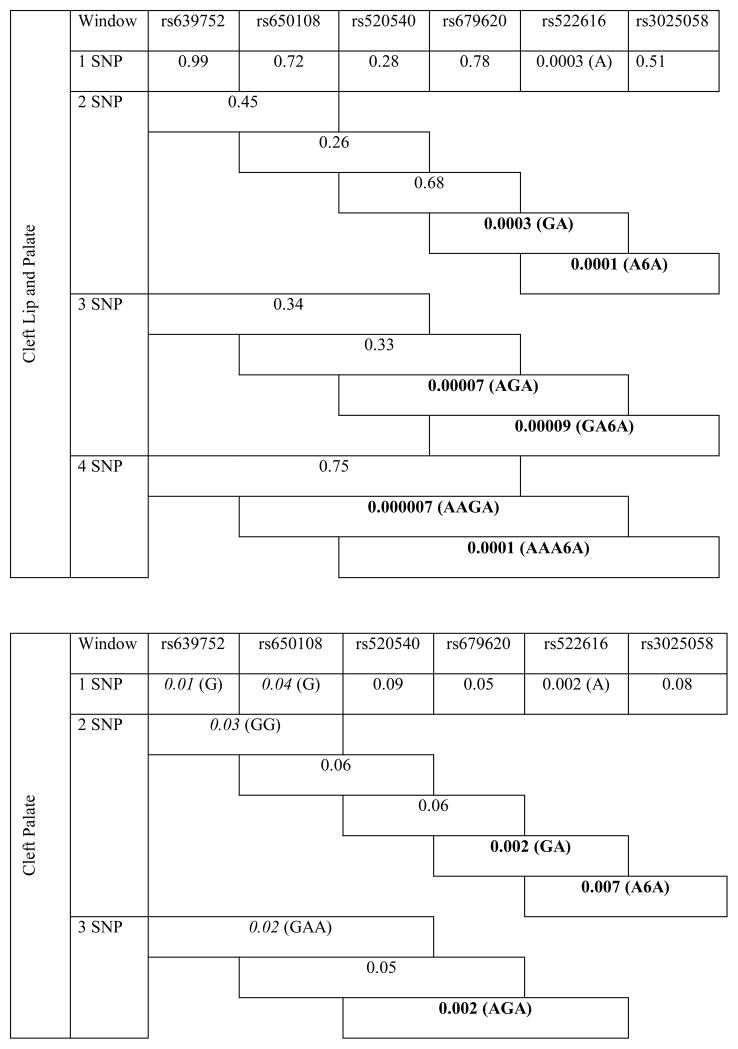
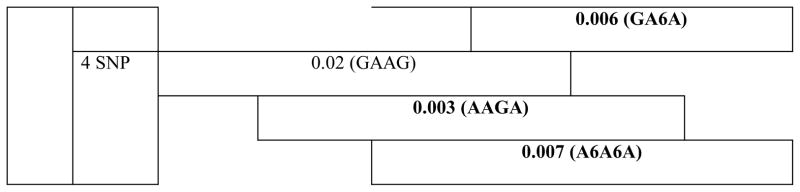
Haplotype analyses revealed the association of neighboring SNPs in MMP3 with all cleft types. Of note, haplotypes including SNPs rs522616 and rs3025058 were strongly associated with CL/P and CP phenotypes (P≤0.002) (Table 3).
Table 3.
Results of haplotype analysis for MMP3 variants in all clefts, cleft lip/palate and cleft palate groups.
|
|
|
MMP3-TIMP2 Interaction
Analysis of the MMP3 and TIMP2 genotypes in the case-control dataset showed association and suggestive evidence of genetic interaction in cleft individuals carrying at least one copy of the ancestral allele A from MMP3 rs5622616 and one or 2 copies of the ancestral allele C from TIMP2 rs8179096 (P=0.000001) (Supplementary Table 1).
Confirmation of association findings
Considering the individual SNP analysis for MMP3, the best association results were seen with rs522616 in Hispanic families with CL/P without family history of clefts (P=0.019) whereas two additional MMP3 SNPs, rs639752 and rs520540, showed association with CL/P in Caucasian families with positive cleft history (P=0.04, for both) (Supplementary Table 3). For TIMP2, the best findings were seen with SNP rs8179096 in Caucasian (p=0.03) and Hispanic (p=0.01) families; SNPs rs6501254 and rs9894295, also showed association values (p=0.04 and p=0.03, respectively) (Supplementary Table 4). In the families without history of clefts, we found association of rs8179096 and rs6501257 (p=0.01 and p<0.03, respectively) in Hispanics, whereas SNPs r6501254, rs9894295, rs4789860 and rs6501265 showed nominal association in Caucasians (0.02≤ p ≤0.05). In the presence of family history of clefts, the best results were seen with SNPs rs7212662 (p=0.01) and rs6501254 (p=0.02) in Caucasians, and SNP rs9894295 (p=0.03) in Hispanics (Supplementary Table 4).
Prediction of SNP functionality
In silico analysis of SNP function suggests that the associated allele A (ancestral) in MMP3 rs522616 creates a binding site for transcription factor CDX1 (caudal type homeobox 1), that is not present with the minor allele G, whereas allele G creates a binding site for transcription factor GR (glucocorticoid receptor) that is not present with the ancestral allele A. Both C and T alleles in TIMP2 rs8179096 are predicted to harbor binding sites for Sp1 and Nuclear Factor-kappaB (NFkB) (data not shown).
DISCUSSION
Considerable biological evidence implicates MMPs as key molecules during palatogenesis for their role in extracellular matrix remodeling (Morris-Wiman et al., 2000; Blavier et al., 2001; Brown et al., 2002; Brown and Nazarali, 2010; de Oliveira Demarchi et al, 2010). In this study, we investigated 45 polymorphisms in 14 MMP and TIMP genes relevant for craniofacial development as candidates for oral clefts in a large case-control dataset from Brazil. We found strong association of MMP3 and TIMP2 with all clefts, cleft lip/palate, and cleft palate phenotypes. Of note, while the association of MMP3 was stronger in the CL/P group, the association with TIMP2 appears more significant in the CP group. The associated variants, MMP3 (rs522616) and TIMP2 (rs8179096), are both located in the gene promoters and may have regulatory effects on gene transcription and function, although their exact functions have not yet been elucidated. Haplotypes containing the individually associated MMP3 rs522616 were also strongly associated with oral clefts, particularly with CL/P. We included an additional large family-based dataset from the US for confirmation of the association findings and observed the association of both MMP3 rs522616 and TIMP2 rs8179096 with CL/P in families of Caucasian and Hispanic descent, with and without family history of clefts. Additional SNPs also showed association with CL/P in these families. While MMP3 rs522616 showed association with CL/P in individuals of Hispanic background and no family history of clefts, two additional SNPs, rs520540 and rs639752, showed association in individuals of Caucasian background and positive family history of clefts. Similarly, the association of TIMP2 rs8179096 appears stronger in Hispanics with no family history of clefts. These findings suggest that variations in these genes may play a role in the susceptibility to oral clefts, as verified by the associations in Brazilian and US populations.
The enzyme MMP-3, also known as stromelysin-1, degrades a wide range of substrates, including type III, IV and V collagens, proteoglycans, fibronectin and laminin, all of which are abundantly present in the palatal matrix (Nagase et al., 2006). MMP-3 is also capable of activating other MMPs, making it likely a key player in ECM degradation and remodeling (Ye et al., 1996). During the process of palatogenesis in mice, expression of Mmp-3 has been detected in vivo subjacent to the medial edge epithelia following contact of the palatal shelves(Blavier et al., 2001) and at higher levels in fused palates than in palates that failed to fuse (Brown et al., 2002). Moreover, induction of Mmp-3 expression has been shown to result in cleavage of cadherin, loss of the epithelial phenotype and subsequent stable conversion of epithelia into mesenchyme (Lochter et al., 1997), a mechanism suggested to occur at the final stages of palatogenesis. Taken together, these findings imply that Mmp-3 induces epithelial breakdown at the medial epithelial edge of fusing palatal shelves if present in adequate amounts, and that insufficient or null expression may lead to failures in palatal fusion. Corroborating with these observations, a recent transcriptome analysis comparing dental pulp stem cells from cleft lip/palate patients and controls revealed 87 differentially expressed genes and downregulation of MMP3 in cleft patients when compared to controls (Bueno et al., 2011).
We have previously reported the association of a polymorphism in MMP3 (rs3025058) with nonsyndromic oral clefts in a smaller sample population (Letra et al., 2007). This polymorphism consists of a common adenine insertion/deletion polymorphism (5A/6A) at position -1171 of the MMP3 promoter region and modulates transcription and local expression of the MMP-3 protein. It has been demonstrated that the 6A allele expresses a roughly 2-fold lower amount of gene product as compared with the 5A allele (Ye et al., 1996). Additional studies have revealed binding of putative transcription factors to this region. The difference in promoter activity is probably due to the differential binding of the transcriptional repressor to the 6A allele (Mercapide et al., 2003). In the present study, we only observed a nonsignificant trend for the individual association of SNP rs3025058 and cleft palate, whereas haplotypes containing rs3025058 and rs522616 alleles were strongly associated with CL/P and CP phenotypes. Discrepancies between our previous and the present study include a larger sample size and investigation of numerous additional polymorphisms, which make direct comparisons rather difficult. Similarly to SNP rs3025058 though, the MMP3 SNP r522616 associated in the present study is also located in the gene promoter, at -709bp from the transcription start site, although no evidence is available on allele-specific functions. Functional polymorphisms derived from nucleotide substitutions have been reported to regulate MMP expression by altering the interaction between cis-elements in the promoter and transcription factors regarded as important for embryonic development (Ye, 2000).Our in silico analysis of SNP function did not predict any damaging effects for the associated MMP3 -709A/G variant although predicted binding sites for putative transcription factors were different for each allele. The presence of the ancestral allele A, associated with oral clefts in this study, is predicted to harbor a binding site for transcription factor CDX1 (caudal type homeobox 1). CDX1 is a member of the caudal-type homeobox family of genes required for anterior-posterior axial skeletal identity in mammals. During murine embryonic development, Cdx1 is expressed along the embryonic axis from day 7.5 postcoitum until day 12, and inactivation of this gene resulted in abnormalities in craniofacial and vertebral formation, however palatal bone development was not examined (Subramanian et al., 1995). Moreover, in the course of positional cloning of the gene involved in the pathogenesis of Treacher Collins syndrome (OMIM 154500), a disorder of craniofacial development characterized by coloboma of the lid, micrognathia, microtia, and cleft palate, it was determined that the CDX1 locus is situated within a region of approximately 900 kb proximal to the TCOF1 gene, etiologic for the syndrome. While these observations do not provide evidence for a direct relationship between MMP3, CDX1 and an increased risk of oral clefts, additional studies including sequencing of conserved and putative regulatory elements, followed by functional validation might provide insights into the potential role of MMP3 and downstream effectors in the pathogenesis of oral clefts.
A promoter variant in TIMP2 (rs8179096, -180C/T) was also strongly associated with oral clefts in the case-control dataset whereas several additional variants showed association in the family-based dataset. TIMP2 has been previously associated with nonsyndromic CL/P in Northeastern European populations, although the associated variants reflect intronic regions of unknown function (Nikopensius et al., 2011). These observations suggest that the associated markers may be in linkage disequilibrium with the true causal variant and indirectly contribute to a cleft phenotype. TIMPs are inhibitors of MMPs. In the extracellular matrix, they form non-covalent 1:1 stoichiometric complexes with MMPs and inhibit MMP activation or function and thereby restrict extracellular matrix breakdown (Woessner, 1999). During palatogenesis, Mmp and Timp expression is highly regulated to control tissue remodeling, and an imbalance in favor of Timp2 has been shown to increase the risk of a cleft (Blavier et al., 2001).
Several genes are likely to be jointly involved in the etiology of oral clefts (Schliekelman and Slatkin, 2002), and numerous gene variants have been individually implicated in increasing an individual’s susceptibility to develop an oral cleft. In general, the associated variant will show the minor allele frequency lower in the cases than in the controls, thus implying the functionality of the variant. In our study, the individual associations with MMP3 and TIMP2 were both with the ancestral alleles, which could suggest that the associated variants may be surrogates for true etiologic variants in the same linkage disequilibrium block. Further, our interaction analysis shows that the presence of one or two copies of the ancestral alleles for the respective MMP3 and TIMP2 variants is more frequently observed in cleft individuals. MMP3 and TIMP2 are located on different chromosomes (11q and 17q respectively), therefore interaction due to linkage disequilibrium is not expected. Rather, the interaction may reflect the overtransmission of these alleles more frequently in cleft individuals. TIMP2 has the ability to inhibit MMP3 (Woessner, 1999), and the observed allelic combinations may exert effects on MMP3 activity with consequences during palatogenesis. To date, significant association between SNPs in and around IRF6 (interferon regulatory factor-6) and CL/P was previously shown in multiple populations and independently replicated (Dixon et al., 2011). Similar to our results, the first associated SNP (rs2235371) that changes valine to isoleucine at amino acid position 274 (V274I) was found to be significantly associated with CL/P in Asian and Amerindian populations, and the associated G allele was the ancestral allele, with a very high (97%) frequency in European and African populations (Zucchero et al., 2004). This V274I mutation was later shown to be in linkage disequilibrium with an IRF6 enhancer variant (rs642961), which in turn has been implicated as the causal variant in CL/P (Rahimov et al., 2008).
In summary, this study provides new evidence that variation in MMP3 may contribute to nonsyndromic oral clefts and further supports the involvement of TIMP2 as a cleft susceptibility gene. Although additional studies are still necessary to unveil the exact mechanism by which MMP3 and TIMP2 would contribute to a cleft phenotype, allelic polymorphisms in these genes and their interactions may partly explain the variance of individual susceptibility to oral clefts.
Supplementary Material
Acknowledgments
We gratefully acknowledge the study individuals for their collaboration. Thanks to E. Kuchler, P. Tannure, L. Motta for help with sample collection; R. Rylands and K. Deeley for technical assistance. This work was supported by National Institutes of Health grants K99R00-DE018954 (to AL), K99R00-DE018913 (to RM), and UL1 RR024153. The content is solely the responsibility of the authors and does not necessarily represent the official views of the National Institute of Dental and Craniofacial Research, National Center for Research Resources, or the National Institutes of Health.
Grant information: This work was supported by National Institutes of Health grants K99R00-DE018954 (to AL), K99R00-DE018913 (to RM), and UL1 RR024153.
Footnotes
“Presented at the 12th International Congress of Human Genetics and 61st Annual Meeting of the American Society of Human Genetics, October 11–15, 2011, Montreal, CA”.
References
- Abbott BD, McNabb FM, Lau C. Glucocorticoid receptor expression during the development of the embryonic mouse secondary palate. J Craniofac Genet Dev Biol. 1994;14:87–96. [PubMed] [Google Scholar]
- Blanton SH, Bertin T, Serna ME, et al. Association of chromosomal regions 3p21.2, 10p13, and 16p13.3 with nonsyndromic cleft lip and palate. Am J Med Genet. 2004;125A:23–27. doi: 10.1002/ajmg.a.20426. [DOI] [PubMed] [Google Scholar]
- Blavier L, Lazaryev A, Groffen J, et al. TGF-beta3-induced palatogenesis requires matrix metalloproteinases. Mol Biol Cell. 2001;12:1457–1466. doi: 10.1091/mbc.12.5.1457. [DOI] [PMC free article] [PubMed] [Google Scholar]
- Brown GD, Nazarali AJ. Matrix metalloproteinase-25 has a functional role in mouse secondary palate development and is a downstream target of TGF-beta3. BMC Dev Biol. 2010;10:93. doi: 10.1186/1471-213X-10-93. [DOI] [PMC free article] [PubMed] [Google Scholar]
- Brown NL, Yarram SJ, Mansell JP, et al. Matrix metalloproteinases have a role in palatogenesis. J Dent Res. 2002;81:826–830. doi: 10.1177/154405910208101206. [DOI] [PubMed] [Google Scholar]
- Bueno DF, Sunaga DY, Kobayashi GS, et al. Human Stem Cell Cultures from Cleft Lip/Palate Patients Show Enrichment of Transcripts Involved in Extracellular Matrix Modeling By Comparison to Controls. Stem Cell Rev. 2011;7:446–457. doi: 10.1007/s12015-010-9197-3. [DOI] [PMC free article] [PubMed] [Google Scholar]
- Chiquet BT, Lidral AC, Stal S, et al. CRISPLD2: a novel NSCLP candidate gene. Hum Mol Genet. 2007;16:2241–2248. doi: 10.1093/hmg/ddm176. [DOI] [PMC free article] [PubMed] [Google Scholar]
- de Oliveira Demarchi AC, Zambuzzi WF, Paiva KB, et al. Development of secondary palate requires strict regulation of ECM remodeling: sequential distribution of RECK, MMP-2, MMP-3, and MMP-9. Cell Tissue Res. 2010;340:61–69. doi: 10.1007/s00441-010-0931-6. [DOI] [PubMed] [Google Scholar]
- Dixon MJ, Marazita ML, Beaty TH, Murray JC. Cleft lip and palate: understanding genetic and environmental influences. Nat Rev Genet. 2011;12:167–178. doi: 10.1038/nrg2933. [DOI] [PMC free article] [PubMed] [Google Scholar]
- Grabe N. AliBaba2: context specific identification of transcription factor binding sites. In Silico Biol. 2002;2:S1–S15. [PubMed] [Google Scholar]
- Iamaroon A, Wallon UM, Overall CM, et al. Expression of 72-kDa gelatinase (matrix metalloproteinase-2) in the developing mouse craniofacial complex. Arch Oral Biol. 1996;41:1109–1119. doi: 10.1016/s0003-9969(96)00097-0. [DOI] [PubMed] [Google Scholar]
- Letra A, Silva RA, Menezes R, et al. MMP gene polymorphisms as contributors for cleft lip/palate: association with MMP3 but not MMP1. Arch Oral Biol. 2007;52:954–960. doi: 10.1016/j.archoralbio.2007.04.005. [DOI] [PubMed] [Google Scholar]
- Lochter A, Srebrow A, Sympson CJ, et al. Misregulation of stromelysin-1 expression in mouse mammary tumor cells accompanies acquisition of stromelysin-1-dependent invasive properties. J Biol Chem. 1997;272:5007–5015. doi: 10.1074/jbc.272.8.5007. [DOI] [PubMed] [Google Scholar]
- Marazita ML, Mooney MP. Current concepts in the embryology and genetics of cleft lip and cleft palate. Clin Plast Surg. 2004;30:125–140. doi: 10.1016/S0094-1298(03)00138-X. [DOI] [PubMed] [Google Scholar]
- Mercapide J, Lopez De Cicco R, Castresana JS, Klein-Szanto AJ. Stromelysin-1/matrix metalloproteinase-3 expression account for invasive properties of human astrocytoma cell lines. Int J Cancer. 2003;106:676–682. doi: 10.1002/ijc.11286. [DOI] [PubMed] [Google Scholar]
- Morris-Wiman J, Burch H, Basco E. Temporospatial distribution of matrix metalloproteinase and tissue inhibitors of matrix metalloproteinases during murine secondary palate morphogenesis. Anat Embryol (Berl) 2000;202:129–141. doi: 10.1007/s004290000098. [DOI] [PubMed] [Google Scholar]
- Mossey PA, Little J. Epidemiology of oral clefts: an international perspective. In: Wyszynski DF, editor. Cleft lip and Palate from origin to treatment. New York: Oxford; 2002. pp. 127–158. [Google Scholar]
- Murray JC. Gene/environment causes of cleft lip and/or palate. Clin Genet. 2002;61:248–256. doi: 10.1034/j.1399-0004.2002.610402.x. [DOI] [PubMed] [Google Scholar]
- Nagase H, Visse R, Murphy G. Structure and function of matrix metalloproteinases and TIMPs. Cardiovasc Res. 2006;69:562–573. doi: 10.1016/j.cardiores.2005.12.002. [DOI] [PubMed] [Google Scholar]
- Nikopensius T, Kempa I, Ambrozaityte L, et al. Variation in FGF1, FOXE1, and TIMP2 genes is associated with nonsyndromic cleft lip with or without cleft palate. Birth Defects Res A Clin Mol Teratol. 2011;91:218–225. doi: 10.1002/bdra.20791. [DOI] [PubMed] [Google Scholar]
- Purcell S, Neale B, Todd-Brown K, et al. PLINK: a tool set for whole-genome association and population-based linkage analyses. Am J Hum Genet. 2007;81:559–575. doi: 10.1086/519795. [DOI] [PMC free article] [PubMed] [Google Scholar]
- Rahimov F, Marazita ML, Visel A, et al. Disruption of an AP-2alpha binding site in an IRF6 enhancer is associated with cleft lip. Nat Genet. 2008;40:1341–1347. doi: 10.1038/ng.242. [DOI] [PMC free article] [PubMed] [Google Scholar]
- Ranade K, Chang MS, Ting CT, et al. High-throughput genotyping with single nucleotide polymorphisms. Genome Res. 2001;11:1262–1268. doi: 10.1101/gr.157801. [DOI] [PMC free article] [PubMed] [Google Scholar]
- Schliekelman P, Slatkin M. Multiplex relative risk and estimation of the number of loci underlying an inherited disease. Am J Hum Genet. 2002;71:1369–1385. doi: 10.1086/344779. [DOI] [PMC free article] [PubMed] [Google Scholar]
- Schug J. Using TESS to predict transcription factor binding sites in DNA sequence. Current protocols in bioinformatics. 2008;Chapter 2(Unit 26) doi: 10.1002/0471250953.bi0206s21. [DOI] [PubMed] [Google Scholar]
- Shi J, Son MY, Yamada S, et al. Membrane-type MMPs enable extracellular matrix permissiveness and mesenchymal cell proliferation during embryogenesis. Dev Biol. 2008;313:196–209. doi: 10.1016/j.ydbio.2007.10.017. [DOI] [PMC free article] [PubMed] [Google Scholar]
- Trevillato PC, Line SRP. Use of buccal epithelial cells for PCR amplification of large DNA fragments. J Forensic Odonto Stomatol. 2000;18:6–9. [PubMed] [Google Scholar]
- Vieira AR. Unraveling human cleft lip and palate research. J Dent Res. 2008;87:119–125. doi: 10.1177/154405910808700202. [DOI] [PubMed] [Google Scholar]
- Woessner JF., Jr Matrix metalloproteinase inhibition. From the Jurassic to the third millennium. Ann NY Acad Sci. 1999;878:388–403. doi: 10.1111/j.1749-6632.1999.tb07697.x. [DOI] [PubMed] [Google Scholar]
- Ye S. Polymorphism in matrix metalloproteinase gene promoters: implication in regulation of gene expression and susceptibility of various diseases. Matrix Biol. 2000;19:623–629. doi: 10.1016/s0945-053x(00)00102-5. [DOI] [PubMed] [Google Scholar]
- Ye S, Eriksson P, Hamsten A, et al. Progression of coronary atherosclerosis is associated with a common genetic variant of the human stromelysin-1 promoter which results in reduced gene expression. J Biol Chem. 1996;271:13055–13060. doi: 10.1074/jbc.271.22.13055. [DOI] [PubMed] [Google Scholar]
- Yuan HY, Chiou JJ, Tseng WH, et al. FASTSNP: an always up-to-date and extendable service for SNP function analysis and prioritization. Nucleic Acids Res. 2006;34:635–641. doi: 10.1093/nar/gkl236. [DOI] [PMC free article] [PubMed] [Google Scholar]
Associated Data
This section collects any data citations, data availability statements, or supplementary materials included in this article.