

Abstract
Background
Pre-clinical and clinical studies have implicated changes in cytokine and innate immune gene-expression in both the development of and end-organ damage resulting from alcohol dependence. However, these changes have not been systematically assessed on the basis of alcohol consumption in human subjects.
Methods
Illumina Sentrix Beadchip (Human-6v2) microarrays were used to measure levels of gene-expression in peripheral blood in 3 groups of subjects: those with alcohol dependence (AD, n=12), heavy drinkers (HD, defined as regular alcohol use over the past year of at least 8 standard drinks/week for women and at least 15 standard drinks/week for men, n=13), and moderate drinkers (MD, defined as up to 7 standard drinks/week for women and 14 standard drinks/week for men, n=17).
Results
436 genes were differentially expressed among the three groups of subjects (FDR corrected p-value < 0.05). 291 genes differed between AD and MD subjects, 240 differed between AD and HD subjects, but only 6 differed between HD and MD subjects. Pathway analysis using DAVID and GeneGO Metacore software showed that the most affected pathways were those related to T-cell receptor and JAK-Stat (Janus kinase-Signal transducer and activator of transcription) signaling.
Conclusions
These results suggest the transition from heavy alcohol use to dependence is accompanied by changes in the expression of genes involved in regulation of the innate immune response. Such changes may underlie some of the previously described changes in immune function associated with chronic alcohol abuse. Early detection of these changes may allow individuals at high risk for dependence to be identified.
Keywords: alcohol dependence, IL-15, IL-21, Janus kinase, Signal transducer and activator of transcription, microarray
Introduction
Alcohol dependence is a chronic disorder characterized by compulsive alcohol seeking, frequent relapses and continued alcohol use despite negative consequences. Worldwide, over 76 million people have alcohol-use disorders. Alcohol use is estimated to cause over 1.8 million deaths annually, and is responsible for approximately 4% of the overall global burden of disease, an amount comparable to that caused by smoking (Ezzati et al., 2002). Thus, there is an urgent need to better understand the factors that lead to and perpetuate alcohol dependence.
Evidence from a variety of sources including twin and adoption studies, as well as community based samples, demonstrates that there are both genetic and environmental factors related to the development of alcohol dependence (Mayfield et al., 2008). Environmental factors, including timing and extent of exposure to alcohol, are postulated to interact with genetic factors by altering patterns of gene-expression in the brain. However, the mechanisms mediating these interactions remain poorly understood. Microarray studies of alcohol-related changes in gene-expression include studies of changes in CNS gene-expression in rodents following acute exposure to ethanol, chronic intermittent alcohol exposure or ethanol withdrawal, as well as post-mortem studies comparing gene expression in specific brain regions between human alcoholics and controls (Mulligan et al., 2006; Rodd et al., 2007). The rate of replication has been low between studies at the level of single gene analysis; however, meta-analysis and functional convergent approaches have identified a number of pathways showing alterations in multiple studies including integrin signaling, inflammation, and apoptosis regulation. A recent RT-PCR study has demonstrated reduced expression of circadian clock genes in peripheral blood mononuclear cells (PBMCs) of male alcoholic patients undergoing alcohol-withdrawal treatment (Huang et al., 2010). However, to date there are no studies (to our knowledge) where microarray technology has been used to systematically compare gene-expression in peripheral blood to drinking levels in human subjects.
Pre-clinical and clinical studies have implicated alterations in the expression of cytokines and innate immune genes in both the development of (Crews et al., 2011) and end-organ damage resulting from (Miller et al., 2011; Wang et al., 2010) alcohol dependence. Chronic alcohol exposure increases the translocation of bacterial products including lipopolysaccharide (LPS) from the gut into the portal circulation, leading to the production of inflammatory cytokines such as tumor necrosis factor alpha (TNFα) and interleukin 1 (IL-1), as well as anti-inflammatory cytokines such as IL-6 and IL-10 (Wang et al., 2010). Alcohol also inhibits components of the innate immune system, including natural killer (NK) cells, which play key roles in anti-viral, anti-tumor, and anti-fibrotic defenses in the liver (Miller et al., 2011). Acute administration of alcohol has been reported to promote T-cell apoptosis (Kapasi et al., 2003), while chronic administration leads to T-cell activation (Cook et al., 2004). In addition to causing liver injury, induction of innate immune genes systemically has been proposed to contribute to neuroplastic adaptations in the brain and negative affective states that promote behavioral changes leading to addiction (Crews et al., 2011).
The development of alcohol dependence has been postulated to occur along a continuum from voluntary consumption motivated by rewarding or hedonic effects to habitual and ultimately compulsive use (Everitt and Robbins, 2005). Substantial epidemiological, laboratory and clinical evidence suggests that light to moderate levels of alcohol consumption may confer significant health benefits, while heavy or hazardous drinking levels are associated with adverse health outcomes (Dufour, 1999; Hingson et al., 2009).
The goal of this study was to identify gene-expression profiles associated with three distinct patterns of drinking behavior: alcohol dependence (AD), heavy drinking (HD defined as regular alcohol use over the past year of at least 8 standard drinks/week for women and at least 15 standard drinks/week for men), and moderate drinking (MD, defined as up to 7 standard drinks/week for women and 14 standard drinks/week for men). AD subjects met DSM-IV criteria for alcohol dependence in early partial remission, and had been abstinent for a period of 4 weeks at the time of assessment. This time period was chosen to capture changes that were associated with chronic effects of alcohol including changes in cytokines and innate immune genes that may be related to risk for relapse, and avoid confounds associated with either acute alcohol intoxication or withdrawal associated changes in these pathways.
Materials and Methods
Subjects
All procedures involving human subjects were approved by the Yale Human Investigation Committee and are in accordance with the Helsinki declaration of 1975. All subjects provided written informed consent at the time of enrollment in the study. AD subjects were admitted to the Clinical Neuroscience Research Unit (CNRU), a locked inpatient treatment research facility with no access to alcohol or drugs and limited access to visitors for a period of 4 weeks prior to collection of blood samples. The prolonged period of hospitalization was included to allow recovery from acute alcohol withdrawal, which could have confounded the results. Detailed descriptions of recruitment and assessment procedures have been previously published (Sinha et al., 2009). Inclusion criteria for AD subjects and healthy controls included: age between 18-50 years; able to read and write; AD subjects met DSM-IV criteria for alcohol dependence in early partial remission and reported using alcohol more than 25 drinks/week prior to current 4 week period of abstinence on the CNRU.
Healthy control/social drinkers (SDs) were between the ages of 21-50 years and were recruited from the same community through local advertisements. SD subjects were admitted for a 3-day hospital stay to the Yale Hospital Research Unit (HRU) at Yale-New Haven Hospital for participation in the laboratory study. During this period, they were required to stay on the unit, within a controlled environment similar to that experienced by the AD subjects. All SD subjects reported no lifetime or current history of any drug dependence (including alcohol dependence), did not meet criteria for any Axis I DSM-IV psychiatric diagnoses, and provided negative urine toxicology screens during initial appointments and at inpatient admission for laboratory sessions. To further define the relationship between gene-expression and drinking behavior, the SD group was divided into two subgroups: Heavy Drinkers (HD) and Moderate Drinkers (MD), as defined by the NIAAA (NIAAA, 2005). The MD group included subjects who reported regular alcohol use over past year not to exceed 7 standard drinks/week for women and 14 standard drinks/week for men, with no occasions of binge drinking (women: 4 or more drinks; men: 5 or more drinks). The HD group included subjects who reported regular alcohol use over the past year of at least 8 standard drinks/week for women and at least 15 standard drinks/week for men (binge drinking allowed). Subjects with current or prior history of alcohol abuse, but not dependence, could be included in the HD group.
Exclusion criteria included current dependence on another psychoactive substance, excluding nicotine; current use of opiates or past history of opiate abuse/dependence; current use of any psychoactive drugs, including anxiolytics, antidepressants, naltrexone or antabuse; any psychotic disorder or current psychiatric symptoms requiring specific attention, including need for psychiatric medications for current major depression and anxiety disorders; any significant current medical condition such as neurological, cardiovascular, endocrine, renal, liver, thyroid pathology; subjects on medications for any medical condition; women on oral contraceptives, peri- and postmenopausal women, and those with hysterectomies; and pregnant and lactating women.
Sample Preparation and Microarray Analysis
Blood samples were collected directly into PAXgene blood RNA tubes (QIAGEN, Valencia, CA) and stored frozen at −80° C. until processing to reduce variation due to differences in sample processing. The choice to use whole blood rather than PBMCs or some other cell fraction for analysis of gene expression is based on several factors. Primary among these is the desire to capture gene expression profiles that are as close as possible to those that exist in vivo. Collecting blood samples directly into PAXgene blood RNA tubes, which lyse the cells and prevents degradation of the RNA present, prevents changes in gene expression associated with differences in storage or handling of the samples prior to RNA extraction. Total RNA was isolated from 10 cc whole blood using the PAXgene Blood RNA Isolation kit (QIAGEN, Valencia, CA) per the manufacturer’s instructions, and depleted of globin mRNA message using GLOBINclear hybridization capture technology (Ambion, Austin, TX). Globin-reduced total RNA underwent cDNA synthesis and overnight in vitro transcription utilizing the Illumina TotalPrep RNA Amplification Kit (Ambion). Biotinylated cRNA (1.5 μg) was hybridized onto an Illumina Sentrix Beadchip (Human-6v2) then scanned on a BeadArray Reader.
Microarray hybridization and scanning were carried out at the NIH Neuroscience Microarray Center at Yale (http:/info.med.yale.edu/neuromicroarray). Per the policies of the NIH microarray consortium, all raw data, including project annotation, generated by the project will be made publicly available, and the complete project annotation in MAGE-ML, image files, as well as raw data files will be available for download. At the time of publication, all data will be deposited into the NCBI-GEO repository, while retaining links to the microarray consortium relational data warehouse.
Normalization and Data Analysis
Statistical analysis of microarray data was carried out at the Keck Foundation Biotechnology BiostatisticsResource (http://keck.med.yale.edu/biostats). Illumina BeadStudio software was used to generate probe and gene expression profiles of each sample. Quantile normalization was carried out using the package incorporated in the Illumina BeadStudio software package. Further statistical analysis was carried out on all genes with a detection p-value <0.01 as determined using the Illumina BeadStudio software (i.e. a 99% probability that expression was above background) in > 90% of samples. Gene-expression levels were compared between subjects with AD and control groups using multiple-analysis of co-variance (MANCOVA) using the statistical package R. Results were co-varied for the effects of age, race, sex, and batch. P-values were adjusted to control the group-wise false discovery rate (FDR) (Reiner et al., 2003) at <0.05. Network analysis was carried out using the DAVID Functional Classification tool (Huang et al., 2009) and GeneGO Metacore® software (GeneGO, Inc., Encinitas, CA, USA).
Results
A principal components analysis was carried out on all gene-expression profiles to identify outliers prior to performing any between group comparisons. Two subjects (both from the AD group) were identified as outliers based on this analysis, and were not included in between-group comparisons. Demographic and clinical information for the remaining 10 AD subjects and the two groups of control subjects (HD and MD) are summarized in Table 1. Compared to the AD group, the control groups had more male subjects (HD 77%, MD 76% vs. AD 60%), more Caucasian subjects (HD 85%, MD 82% vs. AD 50%), and were younger (HD 29.1 ± 7.6 years, MD 27.6 ± 7.6 years, vs. AD 36.0 ± 7.4 years). To ensure that differences in gene-expression between AD and control subjects were not biased by these factors, all three of these factors (sex, race, and age) were included as co-variates in the MANCOVA analysis of the microarray data.
Table 1. Subjects included in between group comparisons- Summary of demographic information.
| Alcohol Dependent | Heavy Drinkers | Moderate Drinkers | |
|---|---|---|---|
| Gender | N (%) | N (%) | N (%) |
| Male | 6 (60%) | 10 (77%) | 13 (76%) |
| Female | 4 (40%) | 3 (23%) | 4 (24%) |
| Ethnicity | |||
| Caucasian | 5 (50%) | 11 (85%) | 14 (82%) |
| Non-Caucasian | 5 (50%) | 2 (15%) | 3 (18%) |
| Mean ± SD | Mean ± SD | Mean ± SD | |
| Age | 36.0 ± 7.4 | 29.1 ± 7.6 | 27.6 ± 7.6 |
436 genes were differentially expressed among the three groups of subjects (FDR corrected p-value < 0.05 for three-group comparison, co-varied for age, race, sex, and batch effects). Of these, 310 genes differed by ≥ 1.3 fold with a nominal p-value < 0.05 between at least 2 of the 3 groups. By these criteria, 291 genes differed between AD and MD subjects, 240 between AD and HD subjects, but only 6 differed between HD and MD subjects. Figure 1 shows a Venn diagram depicting the overlapping sets of gene-expression differences observed among the 3 groups of subjects. As depicted in the figure, the majority of the differences between AD subjects and the 2 control groups were common to both the AD vs. HD and AD vs. MD comparisons, while very few differences were observed between the 2 control groups. A complete list of the fold-changes, raw and FDR corrected p-values for all of the genes showing differential expression between the 3 groups is provided in Supplemental Table 1.
Figure 1. Venn diagram of overlapping gene-expression differences observed among Alcohol dependent (AD), Heavy Drinker (HD) and Moderate Drinker (SD) subjects.
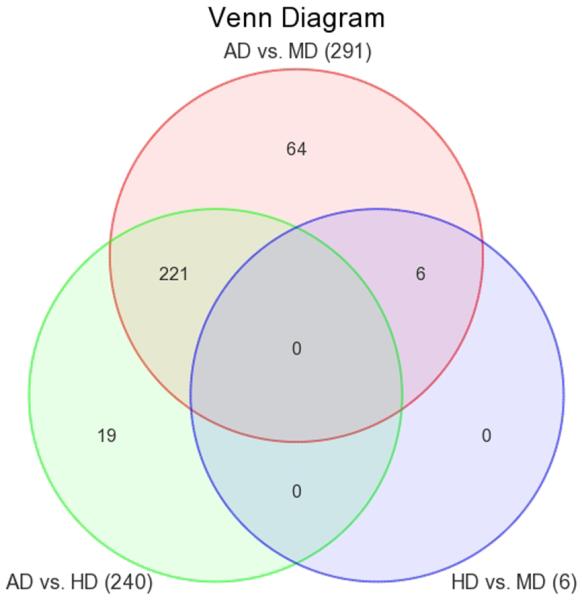
Changes included in the diagram met criteria for statistical significance in the 3-group comparison after adjustment for multiple testing (FDR adjusted p-value <0.05) and in addition differed significantly between the two groups listed (fold change ≥ 1.3, nominal p-value <0.05). The red circle depicts differences between AD and MD subjects (291 genes); the green circle, differences between AD and HD subjects (240 genes), and the blue circle, differences between HD and MD subjects (6 genes).
To identify functional relationships among the differentially expressed genes we carried out pathway analysis using DAVID (Huang et al., 2009) and GeneGO Metacore® software. The DAVID search tool was used to map genes onto the KEGG (Kyoto Encyclopedia of Genes and Genomes) pathway maps. When we entered the complete list of 436 genes that differed among the three groups into DAVID, only 3 KEGG pathways were significantly associated with our gene list: T-cell receptor signaling pathway genes, JAK-Stat (Janus kinase-Signal transducer and activator of transcription) signaling pathway genes, and Pentose Phosphate shunt pathway genes. Table 2 lists the p-value and fold-change for each of the pair-wise comparisons (AD vs. HD, AD vs. MD, and HD vs. MD) for each of the genes showing altered expression in these pathways. A similar analysis was conducted using the proprietary pathway maps incorporated into the GeneGO Metacore® software. Table 3 lists the top 10 pathways identified in this analysis. We also analyzed up- and down-regulated genes separately, however, the number of genes showing altered expression was not sufficient to meet criteria for statistical significance (no KEGG pathways were identified from the DAVID analysis), and therefore we have included both up- and down-regulated genes in the same pathway analysis.
Table 2. Differentially expressed genes (FDR corrected p-value < 0.05 for three-group comparison, co-varied for age, race, sex, and batch effects) associated with the top-3 KEGG pathways identified by the DAVID software package.
Genes are listed separately for each pathway.
| a) T-cell receptor pathway genes | ||||||||||
|---|---|---|---|---|---|---|---|---|---|---|
| GENE SYMBOL |
p-value (Group) |
FDR corrected p-value |
p-value (AD vs. HD) |
Fold- Change (AD vs. HD) |
p-value (AD vs. MD) |
Fold- Change (AD vs. MD) |
p-value HD vs. MD) |
Fold- Change (HD vs. MD) |
REFSEQ_ID | DEFINITION |
| NFKBIE | 8.41E- 04 |
4.22E-02 | 1.92E- 04 |
1.38 | 4.59E-03 | 1.27 | 1.07E-01 (NS) |
−1.09 | NM_004556.2 | Homo sapiens nuclear factor of kappa light polypeptide gene enhancer in B-cells inhibitor, epsilon (NFKBIE), mRNA. |
| RASGRP1 | 1.76E- 04 |
1.99E-02 | 5.22E- 03 |
1.37 | 4.69E-05 | 1.64 | 1.80E-02 | 1.20 | NM_005739.2 | Homo sapiens RAS guanyl releasing protein 1 (calcium and DAG-regulated) (RASGRP1), mRNA. |
| ARHGAP12 | 1.17E- 03 |
4.80E-02 | 1.81E- 03 |
1.36 | 2.87E-04 | 1.45 | 3.28E-01 (NS) |
1.06 | NM_018287.5 | Homo sapiens Rho GTPase activating protein 12 (ARHGAP12), mRNA. |
| MAPK14 | 7.32E- 04 |
3.94E-02 | 3.87E- 01 (NS) |
1.05 | 4.92E-02 | −1.13 | 1.83E-04 | −1.19 | NM_001315.1 | Homo sapiens mitogen- activated protein kinase 14 (MAPK14), transcript variant 1, mRNA. |
| PAK1 | 7.09E- 05 |
1.57E-02 | 1.07E- 02 |
−1.29 | 2.86E-05 | −1.59 | 3.45E-03 | −1.23 | NM_002576.3 | Homo sapiens p21/Cdc42/Rac1- activated kinase 1 (STE20 homolog, yeast) (PAK1), mRNA. |
| PIK3CG | 5.01E- 04 |
3.15E-02 | 8.24E- 04 |
−1.43 | 1.21E-04 | −1.53 | 3.17E-01 (NS) |
−1.07 | NM_002649.2 | Homo sapiens phosphoinositide- 3-kinase, catalytic, gamma polypeptide (PIK3CG), mRNA. |
| PTPN6 | 1.85E- 04 |
2.02E-02 | 1.20E- 04 |
−1.56 | 7.06E-05 | −1.59 | 7.67E-01 (NS) |
−1.02 | NM_080548.3 | Homo sapiens protein tyrosine phosphatase, non-receptor type 6 (PTPN6), transcript variant 2, mRNA. |
| b) JAK-STAT signaling pathway genes | ||||||||||
|---|---|---|---|---|---|---|---|---|---|---|
| GENE SYMBOL |
p-value (Group) |
FDR corrected p-value | p-value (AD vs. HD) |
Fold- Change (AD vs. HD) |
p-value (AD vs. MD) |
Fold- Change (AD vs. MD) |
p-value (HD vs. MD) |
Fold- Change (HD vs. MD) |
REFSEQ_ID | DEFINITION |
| BCL2 | 9.08E- 04 |
4.34E-02 | 2.90E- 03 |
1.36 | 2.04E-04 | 1.50 | 1.64E-01 (NS) |
1.10 | NM_000633.2 | Homo sapiens B-cell CLL/lymphoma 2 (BCL2), nuclear gene encoding mitochondrial protein, transcript variant alpha, mRNA. |
| IL15 | 1.05E- 03 |
4.66E-02 | 2.42E- 04 |
1.35 | 2.45E-03 | 1.27 | 2.42E-01 (NS) |
−1.06 | NM_000585.2 | Homo sapiens interleukin 15 (IL15), transcript variant 3, mRNA. |
| IL21R | 1.24E- 04 |
1.85E-02 | 3.80E- 04 |
1.13 | 2.67E-05 | 1.16 | 1.79E-01 (NS) |
1.03 | NM_181078.1 | Homo sapiens interleukin 21 receptor (IL21R), transcript variant 2, mRNA. |
| CSH1 | 4.96E- 04 |
3.15E-02 | 2.10E- 04 |
−1.16 | 2.64E-04 | −1.16 | 9.30E-01 (NS) |
1.00 | NM_022640.2 | Homo sapiens chorionic somatomammotropin hormone 1 (placental lactogen) (CSH1), transcript variant 2, mRNA. |
| IFNAR2 | 4.32E- 04 |
3.03E-02 | 1.78E- 02 |
−1.21 | 1.49E-04 | −1.39 | 1.30E-02 | −1.15 | NM_207585.1 | Homo sapiens interferon (alpha, beta and omega) receptor 2 (IFNAR2), transcript variant 1, mRNA. |
| PIAS1 | 8.78E- 05 |
1.66E-02 | 4.47E- 04 |
−1.26 | 1.79E-05 | −1.35 | 1.08E-01 (NS) |
−1.07 | NM_016166.1 | Homo sapiens protein inhibitor of activated STAT, 1 (PIAS1), mRNA. |
| MKNK1 | 5.19E- 04 |
3.17E-02 | 4.47E- 03 |
−1.35 | 1.20E-04 | −1.53 | 6.20E-02 (NS) |
−1.14 | NM_003684.3 | Homo sapiens MAP kinase interacting serine/threonine kinase 1 (MKNK1), transcript variant 1, mRNA. |
| STAT5A | 9.72E- 05 |
1.75E-02 | 2.22E- 04 |
−1.42 | 2.20E-05 | −1.52 | 2.41E-01 (NS) |
−1.07 | NM_003152.2 | Homo sapiens signal transducer and activator of transcription 5A (STAT5A), mRNA. |
| PIK3CG | 5.01E- 04 |
3.15E-02 | 8.24E- 04 |
−1.43 | 1.21E-04 | −1.53 | 3.17E-01 (NS) |
−1.07 | NM_002649.2 | Homo sapiens phosphoinositide- 3-kinase, catalytic, gamma polypeptide (PIK3CG), mRNA. |
| TNFRSF1A | 2.11E- 04 |
2.12E-02 | 1.05E- 03 |
−1.46 | 4.44E-05 | −1.65 | 1.09E-01 (NS) |
−1.13 | NM_001065.2 | Homo sapiens tumor necrosis factor receptor superfamily, member 1A (TNFRSF1A), mRNA. |
| PTPN6 | 1.85E- 04 |
2.02E-02 | 1.20E- 04 |
−1.56 | 7.06E-05 | −1.59 | 7.67E-01 (NS) |
−1.02 | NM_080548.3 | Homo sapiens protein tyrosine phosphatase, non-receptor type 6 (PTPN6), transcript variant 2, mRNA. |
| PLCB2 | 1.73E- 04 |
1.99E-02 | 2.84E- 04 |
−1.86 | 4.23E-05 | −2.06 | 3.28E-01 (NS) |
−1.11 | NM_004573.2 | Homo sapiens phospholipase C, beta 2 (PLCB2), mRNA. |
| c) Pentose Phosphate shunt pathway genes | ||||||||||
|---|---|---|---|---|---|---|---|---|---|---|
| GENE SYMBOL |
p-value (Group) |
FDR corrected p-value | p-value (AD vs. HD) |
Fold- Change (AD vs. HD) |
p-value (AD vs. MD) |
Fold- Change (AD vs. MD) |
p-value (HD vs. MD) |
Fold- Change (HD vs. MD) |
REFSEQ_ID | DEFINITION |
| PRPS2 | 5.68E- 05 |
1.57E-02 | 1.79E- 04 |
1.38 | 1.21E-05 | 1.49 | 1.76E-01 (NS) |
1.08 | NM_001039091.1 | Homo sapiens phosphoribosyl pyrophosphate synthetase 2 (PRPS2), transcript variant 1, mRNA. |
| DERA | 1.70E- 04 |
1.99E-02 | 4.88E- 05 |
1.26 | 1.80E-04 | 1.24 | 5.36E-01 (NS) |
−1.02 | NM_015954.2 | Homo sapiens 2-deoxyribose-5- phosphate aldolase homolog (DERA), mRNA. |
| TKT | 5.22E- 04 |
3.17E-02 | 6.69E- 04 |
−1.67 | 1.35E-04 | −1.81 | 4.02E-01 (NS) |
−1.08 | NM_001064.1 | Homo sapiens transketolase (Wernicke-Korsakoff syndrome) (TKT), mRNA. |
| PGLS | 1.13E- 05 |
9.66E-03 | 2.87E- 06 |
−1.68 | 1.97E-05 | −1.58 | 3.65E-01 (NS) |
1.06 | NM_012088.2 | Homo sapiens 6- phosphogluconolactonase (PGLS), mRNA. |
Table 3. Top 10 pathways associated with genes showing altered expression in AD subjects identified using GeneGO Metacore software.
| Pathway Rank |
Pathway Name | p-Value | Number of Differentially Expressed Genes |
Number of Genes in Pathway |
|---|---|---|---|---|
| 1 | Immune response_IL-15 signaling via JAK-STAT cascade | 1.639E-04 | 4 | 23 |
| 2 | Apoptosis and survival_Endoplasmic reticulum stress response pathway | 4.732E-04 | 5 | 53 |
| 3 | Development_Prolactin receptor signaling | 7.195E-04 | 5 | 58 |
| 4 | Development_EPO-induced Jak-STAT pathway | 8.648E-04 | 4 | 35 |
| 5 | Immune response_IL-15 signaling | 1.129E-03 | 5 | 64 |
| 6 | G-protein signaling_Regulation of p38 and JNK signaling mediated by G- proteins |
1.308E-03 | 4 | 39 |
| 7 | Apoptosis and survival_TNFR1 signaling pathway | 1.890E-03 | 4 | 43 |
| 8 | Development_Thrombopoetin signaling via JAK-STAT pathway | 2.394E-03 | 3 | 22 |
| 9 | Immune response_IL-2 activation and signaling pathway | 3.066E-03 | 4 | 49 |
| 10 | Development_GM-CSF signaling | 3.301E-03 | 4 | 50 |
Comparison of the pathways identified using the DAVID and GeneGO software packages showed that both analyses identified changes in a set of intersecting pathways related to regulation of immune response by cytokine signaling and the JAK-Stat pathway. Of note, interleukin-15 (IL-15) was up-regulated in AD subjects (1.35 fold vs. HD, 1.27 fold vs. MD), but did not differ between HD and MD subjects. The receptor for interleukin 21 (IL-21) was also modestly up-regulated in AD subjects (1.13 fold vs. HD, 1.16 fold vs. MD), while interferon receptor 2 (IFNAR2) was down-regulated (−1.21 fold vs. HD, −1.39 fold vs. MD), as was tumor necrosis factor receptor superfamily, member 1A (TNFRSF1A) (−1.46 fold vs. HD, −1.65 fold vs. MD). Down-stream changes included up-regulation of the anti-apoptotic gene B-cell CLL/lymphoma 2 (bcl-2) (1.36 fold AD vs. HD, 1.50 fold, AD vs. MD), and nuclear factor of kappa light polypeptide gene enhancer in B-cells inhibitor, epsilon (NFKBIE) (1.38 fold AD vs. HD, 1.27 fold, AD vs. MD). Figure 2 depicts some of the cytokine-related pathways showing altered gene-expression in AD subjects in this study. Specific changes in these pathways are discussed in more detail below.
Figure 2. Cytokine-Related Gene-Expression Changes in AD subjects.

The upper level of the diagram depicts signaling molecules at the cell surface, while the lower level depicts resulting changes in gene-transcription and apoptosis-related pathways. IL-15 signals through a receptor complex consisting of 3 subunits: the IL-15Rα, IL-2Rβ, and the common cytokine receptor γ chain, γc. IL-21 signals through a complex consisting of the IL-21 receptor (IL21R) and γc. IFNα and related proteins signal through the interferon receptor (IFNAR), which consists of 2 proteins, IFNAR1 and IFNAR2. TNFα signals through two cell surface receptors, TNFR-1 and TNFR-2. Interleukins, interferons, and TNFα can all signal to the nucleus by way of the JAK-Stat pathway depicted on the left hand-side of the figure. In addition, TNFα can activate both an anti-apoptotic pathway involving activation of the NF-kappaB (central part of figure) and a pro-apoptotic pathway leading to caspase activation (right hand side of figure). Proteins shown in green were up-regulated at the mRNA level in AD subjects compared to HD and MD subjects, while those shown in red were down-regulated. Additional information on each of these pathways is included in the text.
Discussion
In this study we used whole genome microarrays to identify genes that were differentially expressed in peripheral blood of subjects with AD compared to either HD or MD subjects. Analyses of the differentially expressed genes carried out using 2 different software packages, DAVID (Huang et al., 2009) and GeneGO Metacore® software, identified a common set of changes involving genes related to regulation of immune response by cytokines and the JAK-Stat signaling pathway. The DAVID software package also identified the Pentose Phosphate shunt pathway as being affected, although this pathway was not among the top 10 identified by GeneGO. Up-regulation of the pentose phosphate shunt pathway may be a marker of hypoxia and has recently been implicated in the transition from mild-cognitive impairment to Alzheimer’s disease (Macfadden et al., 2011). Further studies will be needed to determine if up-regulation of this pathway is also associated with cognitive impairments related to alcohol dependence.
Changes in cytokine-related gene-expression likely include both direct effects of alcohol or its metabolites on gene-expression as well as counter-regulatory processes evoked by repeated cycles of chronic intermittent alcohol exposure and withdrawal. In the present study, differences between AD subjects and controls often included opposing effects within the same pathway. While the fact that no KEGG pathways were identified as being significantly associated with up- or down-regulated genes in AD subjects when analyzed separately, might be interpreted as indicating that changes observed were of marginal significance, the fact that both statistical packages returned the same set of pathways increases our confidence that these represent real biological changes. While we did not start with the a priori hypothesis that cytokine signaling pathways would be the most significantly affected in AD subjects, our results are consistent with previous reports of alterations in these pathways. These pathways and the changes observed in the present study are discussed in more detail below.
The IL-15 pathway
IL-15 is a member of the type I four-α-helical-bundle family of cytokines that promotes survival, proliferation and activation of NK and CD8+ T cells (Budagian et al., 2006). In most lymphocytes (including T and B cells as well as NK cells) the receptor complex for IL-15 consists of 3 subunits: the IL-15Rα, IL-2Rβ, and the common cytokine receptor γ chain, γc, which is common to the receptors for all of the type I four-α-helical-bundle cytokines (IL-2, IL-7, IL-9, IL-15, and IL-21)(Spolski and Leonard, 2008). Activation of the IL-15 receptor activates a number of signal transduction pathways including the Jak1/Jak3, STAT3/STAT5 pathways, spleen tyrosine kinase (Syk) and phospholipase C, gamma (PLCγ), lymphocyte-specific protein tyrosine kinase (Lck kinase), and Src homology 2 domain containing transforming protein 1 (Shc), resulting in the activation of phosphoinositide-3-kinase (PI3K)/Akt and Ras/Raf/MAPK cascades, and the expression of bcl-2, c-myc and c-fos/jun genes and NF-kB activation (Budagian et al., 2006). The net effect of increased signaling through these pathways in increased proliferation and differentiation and protection from apoptosis in a variety of cell types including B-cells, mast cells, neutrophils, eosinophils, monocytes/macrophages and dendritic cells. Outside of the immune system IL-15 signaling has effects on a wide variety of cell types including adipocytes, endothelial cells, keratinocytes, hepatocytes, fibroblasts, muscle cells, epithelial cells, and neuronal cells (Budagian et al., 2006).
IL-15 protein levels have been reported to be increased in alcoholics 2-3 days post alcohol drinking (Gonzalez-Reimers et al., 2011). The magnitude of the increase observed in that study was much larger than observed here (levels of IL-15 were 8.6 fold higher in AD subjects than controls). This difference in magnitude may reflect differences in the timing of the blood draw (2-3 days vs. 4 weeks after cessation of drinking), post-transcriptional regulation of IL-15 protein levels, or greater medical co-morbidity in the AD subjects in that study (5/35 AD subjects died of liver failure during the 18-month follow-up in that study). Previous studies have shown that exogenous IL-15 in combination with IL-15R alpha can rescue NK cells from apoptosis induced by chronic alcohol consumption (Zhang and Meadows, 2009). Thus, the up-regulation of IL-15 and target genes such as Bcl-2 and NFKBIE in AD subjects after 4 weeks of sobriety would be expected to have a protective effect on the innate immune system.
JAK-Stat pathway signaling
The JAK-Stat pathway can be activated by a variety of different signaling molecules including interferon, interleukin, growth factors, and other chemical messengers. Binding of the ligand to the receptor triggers activation of JAK tyrosine kinase activity, and the subsequent phosphorylation of both the receptor and STAT proteins that bind to the phosphorylated receptor. The phosphorylated STAT proteins are then able to dimerize and translocate to the nucleus where they mediate the transcription of a variety of target genes (Aaronson and Horvath, 2002; Yamaoka et al., 2004).
Chronic exposure to low levels of ethanol results in decreased expression and activation of STAT5 in NK cells and decreased NK cell number in mice (Guo et al., 2002), and Stat5a/b knockout mice completely lack NK cells, and T-cells fail to respond to IL-2 proliferation signals (Moriggi, et al, 1999). These mice also show profound deficits in mast cell proliferation and survival (Shelburne et al., 2002). Thus, decreased expression of Stat5 is associated with severe deficits in both innate and adaptive immunity.
JAK-Stat signaling is regulated at multiple levels including de-phosphorylation of signaling intermediates by protein tyrosine phosphatase, non-receptor type 6 (PTPN6, also known as Src homology region 2 domain-containing phosphatase-1, SHP-1)(Valentino and Pierre, 2006), inhibition of DNA-binding and transcriptional activation of target genes by protein inhibitor of activated STAT (PIAS) proteins (Shuai, 2006), and by suppressors of cytokine signaling (SOCS) proteins, which inhibit STAT phosphorylation by binding and inhibiting JAKs or competing with STATs for phosphotyrosine binding sites on cytokine receptors (Krebs and Hilton, 2001).
In this study we observed down-regulation of both Stat5 and important negative regulators of Stat function, PIAS1 and PTPN6. Since chronic exposure to alcohol has been shown to decrease Stat5 expression (Guo et al., 2002), the decreased expression of Stat5a observed in AD subjects may represent a primary effect of chronic alcohol exposure, and the changes in PIAS1 and PTPN6, compensatory responses. However, additional data from other time-points and stages in the development of AD would be required to test this hypothesis.
The IL-21 pathway
IL-21 is a pro-inflammatory cytokine produced by natural killer T cells (NKT) and subsets of CD4 (+) T cells with pleiotropic effects on both innate and adaptive immune responses (Spolski and Leonard, 2008). A number of recent studies (reviewed in (Johnson and Jameson, 2009)) suggest a particular requirement for IL-21 signaling in maintaining the function of CD8(+) cytotoxic T cells during chronic viral infection. Overexpression of IL-21 and its receptor have been reported in autoimmune diseases including systemic lupus erythematosus (Dolff et al., 2011), multiple sclerosis (Tzartos et al., 2011), and inflammatory bowel disease (Tzartos et al., 2011). Increased expression of IL-21 in circulating lymphocytes could play a role in promoting translocation of bacterial products including lipopolysaccharide (LPS) from the gut into the portal circulation, which has been postulated to play a role in alcohol-related liver disease (Wang et al., 2010). To our knowledge this is the first report of increased expression of IL-21 expression in human subjects with AD.
Interferon alpha (IFNα) signaling
Interferon signaling plays an important role in both innate and adaptive immunity (Le Bon and Tough, 2008). The type I interferon receptor (IFNAR) consists of 2 proteins, IFNAR1 and IFNAR2. This receptor binds multiple ligands including at least 13 INFα subtypes, IFNβ, and a number of related molecules (de Weerd et al., 2007). Classical interferon signaling is mediated through the JAK-Stat pathway described above. IFNα also promotes adaptive immune responses by influencing the production or function of other cytokines including IL-15 (Hansen et al., 2011) and IL-21 (Strengell et al., 2004).
Expression of IFNα has been reported to be elevated in alcoholic liver disease (Nguyen and Gao, 2002). Acute ethanol administration has been reported to block IFNα-mediated activation of Stat1, which may contribute to the high rate of failure of interferon treatment of Hepatitis C in AD patients (Gao, 2005). In this study we observed down-regulation of IFNAR2. Decreased signaling through IFNAR would be expected to contribute to deficits in both innate and adaptive immunity.
TNFα Signaling
TNFα is an endogenous mediator of inflammatory and immune responses. Actions of TNFα are mediated through two cell surface receptors, TNFR-1 and TNFR-2, that signal through a variety of different second messenger systems and can elicit both pro-apoptotic and anti-apoptotic responses (Hoek and Pastorino, 2002). Non-apoptotic signaling involves signaling through a complex involving TNF receptor-associated factor 2 (TRAF2), receptor (TNFRSF)-interacting serine-threonine kinase 1 (RIPK1), and inhibitor of apoptosis protein 1 (c-IAP1), termed complex I (Micheau and Tschopp, 2003). Formation of this complex leads to phosphorylation of conserved helix-loop-helix ubiquitous kinase (CHUK, also known as inhibitor kappa B kinase alpha, IKKα) by mitogen-activated protein kinase kinase kinase 14 (MAP3K14, also known as nuclear factor-inducing kinase, NIK), and activation of the NF-kappa B signaling pathway. Failure of this complex to form results in the formation of a death-inducing signaling complex (DISC) involving TNFRSF1A-associated via death domain (TRADD), Fas (TNFRSF6)-associated via death domain, and results in the activation of Caspase 8, and downstream effector caspases (Caspases 3,6,7) (Ashkenazi, 2002). In addition, at least in B-cells, TNFα can signal through the JAK-Stat pathway described above, leading to activation of Stat3 and Stat5 and induction of apoptosis (Miscia et al., 2002). In this study we observed down-regulation of TNFRSF1A, and up-regulation of Caspase 6, which would be predicted to be pro-apoptotic. This would be consistent with reports that liver cells from ethanol-treated animals are more susceptible to the cytotoxic effects of TNFα (Hoek and Pastorino, 2002). However, we also observed up-regulation of Bcl-2 and NFKBIE, which would be expected to have anti-apoptotic effects. Thus, it is unclear if there is a net increase or decrease in sensitivity to apoptosis in the samples from the AD subjects.
Limitations
Limitations of this study include a relatively small sample-size and the fact that cytokine pathway genes were assayed at the level of gene-expression rather than protein or functional assays. Also, since these samples are derived from whole blood, there may be cell-type specific effects, such that particular gene pathways are enhanced in some cells, but not in others. Future experiments involving gene-expression profiling of specific cell-types or sub-populations of cells from AD subjects may help to resolve these questions. Also, the fact that AD subjects were “in patient” during the 4-weeks prior to the collection of blood, may itself be a stressor, and thus contribute to some of the observed changes in cytokine pathways in AD subjects. While HD and MD subjects were hospitalized in a controlled environment similar to that experienced by the AD subjects, the difference in the length of hospitalization may have contributed to some of the observed differences. As with all classification tools based on prior knowledge, both the DAVID and GeneGO Metacore classifications tool are biased towards previously characterized pathways. The advantage of such a bias is that it allows the current findings to be considered in the context of previous findings related to the same genes or pathways, and the fact that both classification tools identified the same set of pathways suggest that these pathways are altered in subjects with AD. However, this approach cannot be used to uncover novel pathways and mechanisms. Future studies examining dynamic changes in gene-expression in response to stress or other stimuli in AD and at-risk subjects may help to further address the relevance of these changes to stress and alcohol seeking behavior in both AD and HD subjects. In addition, it will be important to compare the findings observed here with those that may occur in other stress-related disorders (e.g. depression or addiction to other substances) to determine if these changes are part of a broader pattern of stress-related genomic dysregulation.
Conclusions
The current study extends previous reports demonstrating alterations in cytokines and innate immune gene expression associated with chronic alcohol abuse with data on abstinent AD subjects compared to two groups of healthy control subjects (HD and MD). Our finding that the vast majority of changes observed occurred between AD subjects and the two control groups, with very few observed differences between the control groups, suggests that the transition from heavy alcohol use to dependence is qualitatively different from the transition from moderate to heavy use. AD subjects showed persistent changes in a large number of genes related to innate and immune functions even after 4 weeks of abstinence. In particular, we observed up-regulation of the IL15 gene, and down-regulation of some of the negative regulators of IL15 signaling including PIAS1 and PTPN6. We also observed up-regulation of the receptor for IL21, which works synergistically with IL15 to promote inflammation in the GI tract and elsewhere (De Nitto et al., 2009). We also observed changes in the receptors for IFNα, and TFNα, which can cross-regulate signaling through a variety of different molecules including IL15 and IL21 (Hansen et al., 2011). These changes may underlie some of the previously described changes in immune function associated with chronic alcohol abuse. If validated, early detection of these changes could serve as biomarkers to allow individuals at high risk for dependence to be identified. In addition, better understanding of the mechanisms underlying immune dysfunction in AD subjects may lead to better treatments for subjects with AD and co-occurring health problems such as Hepatitis C.
Supplementary Material
Acknowledgments
This work was supported by the State of Connecticut, Department of Mental Health and Addiction Services, through its support for the Connecticut Mental Health Center and grants from the NIH: R21-AA018388 (Beech), R01-AA013892 (Sinha), Yale CTSA (UL1-RR024139) and the NIH Common Fund Support for Interdisciplinary Research via grants UL1-DE019586 (Sinha) and PL1-DA024859 (Sinha).
References
- Aaronson DS, Horvath CM. A road map for those who don’t know JAK-STAT. Science. 2002;296(5573):1653–5. doi: 10.1126/science.1071545. [DOI] [PubMed] [Google Scholar]
- Ashkenazi A. Targeting death and decoy receptors of the tumour-necrosis factor superfamily. Nat Rev Cancer. 2002;2(6):420–30. doi: 10.1038/nrc821. [DOI] [PubMed] [Google Scholar]
- Budagian V, Bulanova E, Paus R, Bulfone-Paus S. IL-15/IL-15 receptor biology: a guided tour through an expanding universe. Cytokine Growth Factor Rev. 2006;17(4):259–80. doi: 10.1016/j.cytogfr.2006.05.001. [DOI] [PubMed] [Google Scholar]
- Cook RT, Zhu X, Coleman RA, Ballas ZK, Waldschmidt TJ, Ray NB, LaBrecque DR, Cook BL. T-cell activation after chronic ethanol ingestion in mice. Alcohol. 2004;33(3):175–81. doi: 10.1016/j.alcohol.2004.06.007. [DOI] [PubMed] [Google Scholar]
- Crews FT, Zou J, Qin L. Induction of innate immune genes in brain create the neurobiology of addiction. Brain Behav Immun. 2011 doi: 10.1016/j.bbi.2011.03.003. [DOI] [PMC free article] [PubMed] [Google Scholar]
- De Nitto D, Monteleone I, Franze E, Pallone F, Monteleone G. Involvement of interleukin-15 and interleukin-21, two gamma-chain-related cytokines, in celiac disease. World J Gastroenterol. 2009;15(37):4609–14. doi: 10.3748/wjg.15.4609. [DOI] [PMC free article] [PubMed] [Google Scholar]
- de Weerd NA, Samarajiwa SA, Hertzog PJ. Type I interferon receptors: biochemistry and biological functions. J Biol Chem. 2007;282(28):20053–7. doi: 10.1074/jbc.R700006200. [DOI] [PubMed] [Google Scholar]
- Dolff S, Abdulahad WH, Westra J, Doornbos-van der Meer B, Limburg PC, Kallenberg CG, Bijl M. Increase in IL-21 producing T-cells in patients with systemic lupus erythematosus. Arthritis Res Ther. 2011;13(5):R157. doi: 10.1186/ar3474. [DOI] [PMC free article] [PubMed] [Google Scholar]
- Dufour MC. What is moderate drinking? Defining “drinks” and drinking levels. Alcohol Res Health. 1999;23(1):5–14. [PMC free article] [PubMed] [Google Scholar]
- Everitt BJ, Robbins TW. Neural systems of reinforcement for drug addiction: from actions to habits to compulsion. Nat Neurosci. 2005;8(11):1481–9. doi: 10.1038/nn1579. [DOI] [PubMed] [Google Scholar]
- Ezzati M, Lopez AD, Rodgers A, Vander Hoorn S, Murray CJ. Selected major risk factors and global and regional burden of disease. Lancet. 2002;360(9343):1347–60. doi: 10.1016/S0140-6736(02)11403-6. [DOI] [PubMed] [Google Scholar]
- Gao B. Cytokines, STATs and liver disease. Cell Mol Immunol. 2005;2(2):92–100. [PubMed] [Google Scholar]
- Gonzalez-Reimers E, Fernandez-Rodriguez CM, Santolaria-Fernandez F, de la Vega-Prieto MJ, Martin-Gonzalez C, Gomez-Rodriguez MA, Aleman-Valls MR, Rodriguez-Gaspar M. Interleukin-15 and other myokines in chronic alcoholics. Alcohol Alcohol. 2011;46(5):529–33. doi: 10.1093/alcalc/agr064. [DOI] [PubMed] [Google Scholar]
- Guo TL, Zhang LX, Chen JP, Nguyen VA, White KL, Jr., Gao B. Differential STAT5 activation and phenotypic marker expression by immune cells following low levels of ethanol consumption in mice. Immunopharmacol Immunotoxicol. 2002;24(1):121–38. doi: 10.1081/iph-120003408. [DOI] [PubMed] [Google Scholar]
- Hansen ML, Woetmann A, Krejsgaard T, Kopp KL, Sokilde R, Litman T, Straten PT, Geisler C, Wasik MA, Odum N, Eriksen KW. IFN-alpha primes T- and NK-cells for IL-15-mediated signaling and cytotoxicity. Mol Immunol. 2011;48(15-16):2087–93. doi: 10.1016/j.molimm.2011.07.008. [DOI] [PubMed] [Google Scholar]
- Hingson RW, Zha W, Weitzman ER. Magnitude of and trends in alcohol-related mortality and morbidity among U.S. college students ages 18-24, 1998-2005. J Stud Alcohol Drugs Suppl. 2009;(16):12–20. doi: 10.15288/jsads.2009.s16.12. [DOI] [PMC free article] [PubMed] [Google Scholar]
- Hoek JB, Pastorino JG. Ethanol, oxidative stress, and cytokine-induced liver cell injury. Alcohol. 2002;27(1):63–8. doi: 10.1016/s0741-8329(02)00215-x. [DOI] [PubMed] [Google Scholar]
- Huang DW, Sherman BT, Lempicki RA. Systematic and integrative analysis of large gene lists using DAVID bioinformatics resources. Nature Protoc. 2009;4(1):44–57. doi: 10.1038/nprot.2008.211. [DOI] [PubMed] [Google Scholar]
- Huang MC, Ho CW, Chen CH, Liu SC, Chen CC, Leu SJ. Reduced Expression of Circadian Clock Genes in Male Alcoholic Patients. Alcohol Clin Exp Res. 2010 doi: 10.1111/j.1530-0277.2010.01278.x. [DOI] [PubMed] [Google Scholar]
- Johnson LD, Jameson SC. Immunology. A chronic need for IL-21. Science. 2009;324(5934):1525–6. doi: 10.1126/science.1176487. [DOI] [PubMed] [Google Scholar]
- Kapasi AA, Patel G, Goenka A, Nahar N, Modi N, Bhaskaran M, Reddy K, Franki N, Patel J, Singhal PC. Ethanol promotes T cell apoptosis through the mitochondrial pathway. Immunology. 2003;108(3):313–20. doi: 10.1046/j.1365-2567.2003.01584.x. [DOI] [PMC free article] [PubMed] [Google Scholar]
- Krebs DL, Hilton DJ. SOCS proteins: negative regulators of cytokine signaling. Stem Cells. 2001;19(5):378–87. doi: 10.1634/stemcells.19-5-378. [DOI] [PubMed] [Google Scholar]
- Le Bon A, Tough DF. Type I interferon as a stimulus for cross-priming. Cytokine Growth Factor Rev. 2008;19(1):33–40. doi: 10.1016/j.cytogfr.2007.10.007. [DOI] [PubMed] [Google Scholar]
- Macfadden W, Adler CM, Turkoz I, Haskins JT, Turner N, Alphs L. Adjunctive long-acting risperidone in patients with bipolar disorder who relapse frequently and have active mood symptoms. BMC Psychiatry. 2011;11:171. doi: 10.1186/1471-244X-11-171. [DOI] [PMC free article] [PubMed] [Google Scholar]
- Mayfield RD, Harris RA, Schuckit MA. Genetic factors influencing alcohol dependence. Br J Pharmacol. 2008;154(2):275–87. doi: 10.1038/bjp.2008.88. [DOI] [PMC free article] [PubMed] [Google Scholar]
- Micheau O, Tschopp J. Induction of TNF receptor I-mediated apoptosis via two sequential signaling complexes. Cell. 2003;114(2):181–90. doi: 10.1016/s0092-8674(03)00521-x. [DOI] [PubMed] [Google Scholar]
- Miller AM, Horiguchi N, Jeong WI, Radaeva S, Gao B. Molecular Mechanisms of Alcoholic Liver Disease: Innate Immunity and Cytokines. Alcohol Clin Exp Res. 2011;35(5):787–793. doi: 10.1111/j.1530-0277.2010.01399.x. [DOI] [PMC free article] [PubMed] [Google Scholar]
- Miscia S, Marchisio M, Grilli A, Di Valerio V, Centurione L, Sabatino G, Garaci F, Zauli G, Bonvini E, Di Baldassarre A. Tumor necrosis factor alpha (TNF-alpha) activates Jak1/Stat3-Stat5B signaling through TNFR-1 in human B cells. Cell Growth Differ. 2002;13(1):13–8. [PubMed] [Google Scholar]
- Mulligan MK, Ponomarev I, Hitzemann RJ, Belknap JK, Tabakoff B, Harris RA, Crabbe JC, Blednov YA, Grahame NJ, Phillips TJ, Finn DA, Hoffman PL, Iyer VR, Koob GF, Bergeson SE. Toward understanding the genetics of alcohol drinking through transcriptome meta-analysis. Proc Natl Acad Sci U S A. 2006;103(16):6368–73. doi: 10.1073/pnas.0510188103. [DOI] [PMC free article] [PubMed] [Google Scholar]
- Nguyen VA, Gao B. Expression of interferon alfa signaling components in human alcoholic liver disease. Hepatology. 2002;35(2):425–32. doi: 10.1053/jhep.2002.31169. [DOI] [PubMed] [Google Scholar]
- NIAAA . Helping Patients Who Drink Too Much: A Clinician’s Guide. National Institute on Alcohol Abuse and Alcoholism; Rockvile, MD: 2005. NIH Publication No. 07-3769, ed^eds) Reprinted May 2007. [Google Scholar]
- Reiner A, Yekutieli D, Benjamini Y. Identifying differentially expressed genes using false discovery rate controlling procedures. Bioinformatics. 2003;19(3):368–75. doi: 10.1093/bioinformatics/btf877. [DOI] [PubMed] [Google Scholar]
- Rodd ZA, Bertsch BA, Strother WN, Le-Niculescu H, Balaraman Y, Hayden E, Jerome RE, Lumeng L, Nurnberger JI, Jr., Edenberg HJ, McBride WJ, Niculescu AB. Candidate genes, pathways and mechanisms for alcoholism: an expanded convergent functional genomics approach. Pharmacogenomics J. 2007;7(4):222–56. doi: 10.1038/sj.tpj.6500420. [DOI] [PubMed] [Google Scholar]
- Shelburne CP, McCoy ME, Piekorz R, Sexl VV, Gillespie SR, Bailey DP, Gharse A, Mirmonsef P, Mann MN, Kashyap M, Wright HV, Chong HJ, Bouton LA, Ramirez CD, Lantz CS, Ryan JJ. Stat5: an essential regulator of mast cell biology. Mol Immunol. 2002;38(16-18):1187–91. doi: 10.1016/s0161-5890(02)00061-5. [DOI] [PubMed] [Google Scholar]
- Shuai K. Regulation of cytokine signaling pathways by PIAS proteins. Cell Res. 2006;16(2):196–202. doi: 10.1038/sj.cr.7310027. [DOI] [PubMed] [Google Scholar]
- Sinha R, Fox HC, Hong KA, Bergquist K, Bhagwagar Z, Siedlarz KM. Enhanced Negative Emotion and Alcohol Craving, and Altered Physiological Responses Following Stress and Cue Exposure in Alcohol Dependent Individuals. Neuropsychopharmacology. 2009;34:1198–1208. doi: 10.1038/npp.2008.78. [DOI] [PMC free article] [PubMed] [Google Scholar]
- Spolski R, Leonard WJ. Interleukin-21: basic biology and implications for cancer and autoimmunity. Annu Rev Immunol. 2008;26:57–79. doi: 10.1146/annurev.immunol.26.021607.090316. [DOI] [PubMed] [Google Scholar]
- Strengell M, Julkunen I, Matikainen S. IFN-alpha regulates IL-21 and IL-21R expression in human NK and T cells. J Leukoc Biol. 2004;76(2):416–22. doi: 10.1189/jlb.1003488. [DOI] [PubMed] [Google Scholar]
- Tzartos JS, Craner MJ, Friese MA, Jakobsen KB, Newcombe J, Esiri MM, Fugger L. IL-21 and IL-21 receptor expression in lymphocytes and neurons in multiple sclerosis brain. Am J Pathol. 2011;178(2):794–802. doi: 10.1016/j.ajpath.2010.10.043. [DOI] [PMC free article] [PubMed] [Google Scholar]
- Valentino L, Pierre J. JAK/STAT signal transduction: regulators and implication in hematological malignancies. Biochem Pharmacol. 2006;71(6):713–21. doi: 10.1016/j.bcp.2005.12.017. [DOI] [PubMed] [Google Scholar]
- Wang HJ, Zakhari S, Jung MK. Alcohol, inflammation, and gut-liver-brain interactions in tissue damage and disease development. World J Gastroenterol. 2010;16(11):1304–13. doi: 10.3748/wjg.v16.i11.1304. [DOI] [PMC free article] [PubMed] [Google Scholar]
- Yamaoka K, Saharinen P, Pesu M, Holt VE, 3rd, Silvennoinen O, O’Shea JJ. The Janus kinases (Jaks) Genome Biol. 2004;5(12):253. doi: 10.1186/gb-2004-5-12-253. [DOI] [PMC free article] [PubMed] [Google Scholar]
- Zhang H, Meadows GG. Exogenous IL-15 in combination with IL-15R alpha rescues natural killer cells from apoptosis induced by chronic alcohol consumption. Alcohol Clin Exp Res. 2009;33(3):419–27. doi: 10.1111/j.1530-0277.2008.00852.x. [DOI] [PMC free article] [PubMed] [Google Scholar]
Associated Data
This section collects any data citations, data availability statements, or supplementary materials included in this article.