

The modalities and protocol for post-RFA imaging surveillance, the typical imaging features of the post-RFA ablation zone, and the imaging findings suggestive of partial ablation or tumor recurrence are discussed.
Abstract
Radiofrequency ablation (RFA) is used to treat pulmonary malignancies. Although preliminary results are suggestive of a survival benefit, local progression rates are appreciable. Because a patient can undergo repeat treatment if recurrence is detected early, reliable post-RFA imaging follow-up is critical. The purpose of this article is to describe (a) an algorithm for post-RFA imaging surveillance; (b) the computed tomographic (CT) appearance, size, enhancement, and positron emission tomographic (PET) metabolic activity of the ablation zone; and (c) CT, PET, and dual-modality imaging with PET and CT (PET/CT) features suggestive of partial ablation or tumor recurrence and progression. CT is routinely used for post-RFA follow-up. PET and PET/CT have emerged as auxiliary follow-up techniques. CT with nodule densitometry may be used to supplement standard CT. Post-RFA follow-up was divided into three phases: early (immediately after to 1 week after RFA), intermediate (>1 week to 2 months), and late (>2 months). CT and PET imaging features suggestive of residual or recurrent disease include (a) increasing contrast material uptake in the ablation zone (>180 seconds on dynamic images), nodular enhancement measuring more than 10 mm, any central enhancement greater than 15 HU, and enhancement greater than baseline anytime after ablation; (b) growth of the RFA zone after 3 months (compared with baseline) and definitely after 6 months, peripheral nodular growth and change from ground-glass opacity to solid opacity, regional or distant lymph node enlargement, and new intrathoracic or extrathoracic disease; and (c) increased metabolic activity beyond 2 months, residual activity centrally or at the ablated tumor, and development of nodular activity.
© RSNA, 2012
LEARNING OBJECTIVES FOR TEST 1
After completing this journal-based CME activity, participants will be able to:
Describe the appropriate post-RFA imaging protocols for the evaluation of residual or recurrent lung tumor.
Recognize characteristic post-RFA follow-up imaging features, contrast enhancement patterns, and size of the ablation zone.
Identify key imaging features, enhancement, and growth patterns suggestive of partial ablation or tumor recurrence.
Introduction
Lung cancer is currently the leading cause of cancer-related deaths in both men and women in the United States. According to the Surveillance Epidemiology and End Results (SEER) database, it is estimated that 221,130 men and women will be diagnosed with and 156,940 will die of lung cancer in 2011, more than the numbers for any other cancer (1). In addition, the lungs are the second most frequent site of metastasis, and metastases to the lung complicate the course of as many as 40% of other malignancies (2).
For patients with early-stage primary lung cancer, surgical resection offers the potential for cure and is currently the treatment of choice. However, 15.7% of all patients with early-stage lung cancer are not candidates for surgery because of locally advanced disease or comorbidities, and this percentage increases to 30.4% in the patients with early-stage lung cancer who are older than 75 years (3). With regard to those patients who have early-stage lung cancer and comorbid disease, several authors have found that lung cancer–specific survival is considerably improved with the use of local therapy, such as radiation therapy or the combination of radiation therapy and chemotherapy, compared to survival of such patients without therapy (4–6). Local therapy may also be appropriate in limited or low-volume metastatic disease. Surgical resection, or metastasectomy, appears to confer some survival benefits in carefully selected patients, with a 10-year survival rate of approximately 25% and with approximately 90% of 10-year survivors remaining free of disease (7,8). Because most patients develop recurrent disease after metastasectomy and because repeated resections may remove considerable amounts of functioning lung, this patient population is also suitable for minimally invasive lung-sparing therapies. Percutaneous image-guided thermal ablation with radiofrequency energy is a minimally invasive procedure that has emerged as a viable alternative or complementary treatment option for patients with primary and secondary pulmonary malignancies.
Radiofrequency ablation (RFA) destroys tissue with a thermal energy delivery system that emits a high-frequency alternating current through an electrode needle to destroy tumor cells. The alternating current results in ion agitation in the tissue surrounding the needle. The agitation is then converted by friction into heat. Once cytotoxic temperatures are achieved, intracellular proteins are denatured, lipid bilayers melt, and the tumor cells in the vicinity of the electrode undergo coagulation necrosis (9–13). To reduce the risk of incomplete ablation, a 1-cm margin of apparently healthy tissue at the periphery of the tumor, which is referred to as the “safety zone,” should also be ablated (14–16). Ablation of this zone accommodates any microscopic extension that is not recognized with conventional imaging. Giraud et al (17) found that 95% of the microscopic extension of tumors was confined within a safety zone of 8 mm for adenocarcinoma and 6 mm for squamous cell carcinoma. In our practice, we use a 10-mm safety zone to ensure the death of all cancer cells. Lung tumors are well suited to RFA because the surrounding air in adjacent normal lung parenchyma provides an insulating effect that may concentrate the radiofrequency energy (18,19).
The treatment of pulmonary malignancies is a relatively new application of RFA. Goldberg et al (18) first investigated the feasibility and safety of this technique for treating lung tumors in rabbits in 1995. In 2000, Dupuy et al (20) reported the first clinical application of this technique for the treatment of lung tumors in three patients. Since then, the findings from multiple case series have shown promising results with regard to the primary efficacy and safety (21), as well as the early (22–24), intermediate (25–28), and long-term results (29–31), of this technique for the treatment of lung neoplasms. The findings from these studies suggest that RFA offers a survival benefit for patients with lung tumors, with 3-year survival rates in the range of 46%–60%. In these studies, investigators have also reported appreciable rates of recurrence, varying from 7% to 55% between 1 and 3 years of follow-up.Preprocedural factors that have been associated with decreased local recurrence rates after RFA are tumor size less than 3–3.5 cm, tumor location more than 3–10 mm away from a vessel, and peripheral location of the tumor (16,26–34). Lower rates of local disease control have been shown to be associated with a decreased mean survival rate of 8.7 months, compared with 19.7 months in those with more complete local disease control (14).
A major challenge of RFA therapy has been reliable postprocedural assessment of the response to treatment. In contrast to surgical resection, in which a tumor is removed and submitted for histopathologic analysis of the completely resected specimen, during RFA the ablated tumor is left in situ, and thus direct histopathologic verification of complete tumor ablation or pathologic assessment of lymph node spread is not possible. Histologic assessment of the ablation zone margins by using fine-needle aspiration biopsy has also proved to be unreliable because it is frequently associated with (a) false-negative results caused by sampling error and (b) false-positive results that are due to the “ghost cell” phenomenon. This phenomenon, first described by Nolsoe et al (35), refers to the acute postablation histologic appearance of the ablation zone, in which the tissue architecture appears nearly intact and lacks the classic well-defined appearance of coagulation necrosis (36). Adequately ablated areas may thus appear to contain viable tissue cells, and specialized stains are often required to confirm cell death. Although core-needle biopsy may have increased diagnostic value, it is associated with increased risks and is still subject to false-negative results caused by sampling error.
Thus, postprocedural cross-sectional imaging must be relied on to assess the response to treatment. Computed tomography (CT), positron emission tomography (PET), and dual-modality imaging with combined PET and CT (PET/CT) are primarily used for this purpose. Cross-sectional imaging follow-up also allows detection of procedure-related complications, metachronous tumors, and metastatic disease. In contrast to direct histopathologic analysis, CT and PET cannot be used to detect microscopic foci of residual tumor or early recurrence. Consequently, as has been asserted by Goldberg et al (37), the findings from post-RFA CT imaging serve only as a rough indicator of the success of RFA. Long-term imaging follow-up is necessary to ensure treatment success.
An understanding of the anticipated and unexpected imaging features of the RFA zone is essential for accurate assessment of the response to treatment. Because a patient with recurrence may potentially undergo repeat treatment if the recurrence is detected early, the recognition of early signs of incomplete therapy or recurrence is also critical. Several groups of authors have reported their findings from investigation of the CT appearance, growth patterns, contrast enhancement, and metabolic activity of the ablation zone at post-RFA imaging and follow-up (14,16,22,38–49). The purpose of this article is to (a) present a potential algorithm for post-RFA imaging surveillance; (b) review the expected CT imaging appearance, size, contrast enhancement patterns, and PET metabolic activity of the ablation zone; and (c) discuss the CT, PET, and PET/CT imaging features suggestive of partial ablation or tumor recurrence and progression. Consideration of the potential procedure-related complications of RFA therapy and the protocol for detection of these complications is a separate topic deserving of its own dedicated discussion and will be discussed here only briefly. This article begins with a discussion of post-RFA surveillance with CT, PET, and PET/CT. Then the post-RFA imaging features of CT appearance, size, enhancement, and metabolic activity at PET and PET/CT are described for the early phase, the intermediate phase, and the late phase after RFA. Finally, patterns of recurrent disease are considered.
Post-RFA Surveillance: CT, PET, and PET/CT
No standard imaging protocol for post-RFA follow-up has yet been developed. Chest radiographs are routinely obtained in the period immediately after the procedure and at the 1-week interval after RFA to evaluate for procedure-related complications, including pneumothorax and pleural effusions. Conventional contrast material–enhanced CT is most commonly used for post-RFA surveillance because it is widely available and is the primary modality for most image-guided lung procedures. Contrast-enhanced CT with nodule densitometry may be used as a supplemental technique in patients with solitary tumors. PET and combined PET/CT imaging are used as auxiliary techniques to CT, and with the advent of thin-collimation whole-body PET/CT scanners, PET/CT may even be used as a substitute for standard CT. Magnetic resonance (MR) imaging is an investigational tool and currently is not widely used clinically.
Contrast-enhanced CT with nodule densitometry has shown promise as a supplemental technique to conventional CT for the evaluation of the treatment response to RFA. The technique involves the dynamic measurement of nodule enhancement after administration of contrast material and can be used to differentiate between benign and malignant lesions on the basis of differences in vascularity (Fig 1). In a multi-institutional study, Swensen et al (50) reported 98% sensitivity in the detection of malignant tumors when a threshold of 15 HU of enhancement above baseline was used. Suh et al (22) first used this technique for lung tumors after ablation and reported marked diminution of mean contrast material uptake at 1–2 months after ablation and marginally increased enhancement at 3 months, although still less than that of the original tumor. At our institution, we routinely perform CT with nodule densitometry before the ablation procedure to document the baseline characteristics of the tumor, including its enhancement profile. Dynamic contrast-enhanced images are obtained through the nodule at 45, 90, 180, and 300 seconds after intravenous injection of approximately 100 mL of nonionic contrast material at a rate of 2–3 mL/sec (Fig 1). Nodule enhancement is calculated by subtracting the precontrast nodule attenuation determined before contrast material administration from the maximum postcontrast nodule attenuation among all of the postcontrast time points studied. Because tumors are often heterogeneous in appearance, attenuation is measured by placing the marker for the region of interest on the most solid, reproducible area of the lesion (22). The use of multidetector CT allows for acquisition of a slab of images at each time interval and more accurate placement of the region of interest at the same location.
Figure 1a.

CT nodule densitometry at 3-month follow-up after ablation of a left lingular metastasis from colorectal carcinoma in a 62-year-old man. (a) CT images obtained at the level of ablation show that the nodule is close to the lingular bronchus and artery. Left to right: Preinjection unenhanced CT image (0 seconds) is followed by contrast-enhanced CT images obtained at 45, 90, 180, and 300 seconds after contrast material injection, which demonstrate enhancement of the residual tumor. Region of interest markers (circles) on the images are placed at the same location and should avoid partial inclusion of vessels or airway. (b) Graph of enhancement in relation to time after contrast material administration charts the enhancement pattern. Enhancement of more than 15 HU is considered evidence for recurrence.
Figure 1b.

CT nodule densitometry at 3-month follow-up after ablation of a left lingular metastasis from colorectal carcinoma in a 62-year-old man. (a) CT images obtained at the level of ablation show that the nodule is close to the lingular bronchus and artery. Left to right: Preinjection unenhanced CT image (0 seconds) is followed by contrast-enhanced CT images obtained at 45, 90, 180, and 300 seconds after contrast material injection, which demonstrate enhancement of the residual tumor. Region of interest markers (circles) on the images are placed at the same location and should avoid partial inclusion of vessels or airway. (b) Graph of enhancement in relation to time after contrast material administration charts the enhancement pattern. Enhancement of more than 15 HU is considered evidence for recurrence.
PET and PET/CT are considered the standard of care for staging, surveillance for metastatic and recurrent disease, and evaluation of the therapeutic response to chemotherapy or radiation therapy in lung cancer patients (51–53). To date, the investigators in multiple studies have reported on the use of PET and PET/CT to assess the response to treatment with RFA. PET/CT complements contrast-enhanced CT, especially when CT findings are unexpected and suggestive of tumor progression at the ablation zone or when new signs of local-regional spread are discovered during restaging. PET/CT also allows surveillance of extrathoracic tumor progression. In patients with contraindications to administration of contrast material, PET/CT provides higher sensitivity for detection of recurrence than CT alone does. Herrera et al (23) first reported that PET may be useful for confirming the presence of residual disease in lesions that show growth at CT. Akeboshi et al (44) compared PET to contrast-enhanced CT and found PET to be more sensitive for detecting early local tumor progression. Kang et al (42) also noted that PET may be superior to CT in the detection of residual disease in the early post-RFA period. Okuma et al (54) reported that persistent uptake of fluorine 18 fluorodeoxyglucose (FDG) or less than a 60% reduction of uptake at 2 months relative to baseline PET may be predictive of recurrence on CT images obtained at 6 months. Higaki et al (55) evaluated 60 post-RFA lung lesions for local tumor progression with PET/CT at 0–3-month, 3–6-month, and 6–9-month intervals and concluded that the appropriate initiation point for follow-up with PET/CT is at least 3 months after RFA, with a standardized uptake value (SUV) of more than 1.5 at 3–9 months after RFA showing 77.8% sensitivity and 85.7%–90.5% specificity in predicting recurrence (Fig 2).
Figure 2a.

Fused PET/CT images of a left suprahilar non–small cell lung carcinoma in a 68-year-old woman. (a) Preablation image demonstrates a mean SUV of 7.7 in the region of interest (circle). (b) Image obtained after ablation shows a drop in SUV centrally, but there is an area of high SUV measuring 1.6 at the medial periphery, a finding that is suggestive of residual tumor and inadequate ablation.
Figure 2b.

Fused PET/CT images of a left suprahilar non–small cell lung carcinoma in a 68-year-old woman. (a) Preablation image demonstrates a mean SUV of 7.7 in the region of interest (circle). (b) Image obtained after ablation shows a drop in SUV centrally, but there is an area of high SUV measuring 1.6 at the medial periphery, a finding that is suggestive of residual tumor and inadequate ablation.
Although the MR imaging appearance of the ablation zone has been described in both rabbit and porcine lung models (36,56), MR imaging remains an investigational tool and currently is not widely used clinically because of poor visualization of lung parenchyma, high costs, and limited availability. Recently, MR imaging techniques that use diffusion-weighted imaging and the apparent diffusion coefficient have shown promising results, with the group with no local progression demonstrating significantly higher values (P < .05) for the post-RFA apparent diffusion coefficient of the lesion than the group with local progression after RFA therapy (57). This finding is suggestive of a potential role for using the apparent diffusion coefficient to assess the adequacy of RFA therapy for lung tumors (57).
At our institution, bedside chest radiography is performed at 1 hour and 3 hours and occasionally, if the patient is admitted, on the morning after the procedure. An upright posteroanterior chest radiograph is then obtained at the 1-week follow-up. Initial CT densitometry is performed within 3 months (usually at 1–2 months) after RFA and is followed by PET/CT at 3 months, which thereafter is alternated with CT densitometry every 6 months for 2 years (Fig 3).
Figure 3.

Diagram showing PET/CT (black and white boxes together) incorporated into the follow-up imaging protocol after RFA (numbers = months after RFA). Initial PET/CT is required for staging. Thereafter, whole-body CT with CT nodule densitometry (white box alone) through the ablation zone is performed at 1–2 months. PET/CT is performed at 3 months and thereafter every 6 months (alternating with CT alone performed every 6 months) until 2 years after RFA.
Post-RFA Imaging Features
The post-RFA imaging features include the CT appearance, size, enhancement, and metabolic activity at PET and PET/CT imaging. For the purpose of this discussion, the post-RFA period is divided into an early phase (immediately after to 1 week after RFA), an intermediate phase (>1 week to 2 months after RFA), and a late phase (>2 months after RFA).
Early Phase (≤1 Week)
CT Appearance.—During the procedure, the ablation zone demonstrates (a) wrinkling of the edges and partial emptying that is due to vaporization of tissue and (b) retraction and thickening if the ablation zone is in proximity to the pleura (39). The track of the electrode typically shows increased attenuation, and a lightbulb-shaped opacity may be depicted around the ablated tumor and electrode (Fig 4a) (47).The most common post-RFA imaging findings include (a) cone-shaped sectorial hyperemia or rim of hyperemia characterized by ground-glass opacity, which may circumferentially or partially envelop the target lesion, and (b) intralesional bubbles (Fig 4b) (39). Goldberg et al (18) reported that similar opacities appearing in the rabbit lung after RFA corresponded histologically to coagulation necrosis of tumor; accordingly, the emergence of perilesional ground-glass opacities has been used as an end point for the procedure.
Figure 4a.

Metastatic ependymoma in a 58-year-old man undergoing RFA with a single probe. (a) CT image obtained at completion of the ablation cycle shows increased attenuation around the probe and the lesion, a finding referred to as the lightbulb sign (arrows). (b) CT image obtained immediately after ablation and removal of the probe shows an area of cone-shaped sectorial hyperemia (arrowheads), a finding that corresponds to the safety zone, the area of ablation beyond the margins of the tumor.
Figure 4b.

Metastatic ependymoma in a 58-year-old man undergoing RFA with a single probe. (a) CT image obtained at completion of the ablation cycle shows increased attenuation around the probe and the lesion, a finding referred to as the lightbulb sign (arrows). (b) CT image obtained immediately after ablation and removal of the probe shows an area of cone-shaped sectorial hyperemia (arrowheads), a finding that corresponds to the safety zone, the area of ablation beyond the margins of the tumor.
Investigators have cautioned against using the ground-glass opacities to define the ablation margins, arguing that the opacities may overestimate the area of coagulation necrosis. Belfiore et al (40) observed malignant cells in the fine-needle aspirates from ground-glass zones in 12 of 19 patients undergoing CT-guided fine-needle aspiration biopsy sampling at 6 months, even in five of 12 cases with reduced tumor size at CT. As a result of the previously noted ghost cell phenomenon, these positive findings may be misleading because the aspirated tumor cells may not be truly viable. However, Anderson et al (16) evaluated recurrence rates of 36 tumors in 22 patients, along with the margin of ground-glass opacity, after RFA and found that an absence of ground-glass opacity along the ablated margin was seen in 11 (85%) of 13 cases of recurrence and that the margin area of absent ground-glass opacity corresponded to the site of eventual recurrence. Increased rates of recurrence were noted with ground-glass opacity margins of 3 mm, but no recurrences were seen in cases in which the ground-glass opacity extended more than 5 mm beyond the tumor margins (16). Similarly, Lee et al (14) observed that none of the tumors in which the ground-glass opacity completely enveloped the tumor and extended more than 5 mm beyond the tumor margins recurred locally during a mean follow-up period of 22.2 months (Fig 5). An adequate ablation zone may not be achieved if the ablation zone is cooled below 60°C, either by ventilation through airways or, more commonly, by pulmonary vessels, which is referred to as the “heat sink effect” (Fig 5) (16). In another study, de Baère et al (25) found that achieving an ablation area at least four times larger than the original tumor was predictive of complete treatment.
Figure 5a.

Heat sink effect and inadequate ablation of a metastatic nodule from a renal cell carcinoma in the right lower lobe in a 57-year-old man. (a) CT image shows the solitary 19 × 18-mm metastatic nodule in the right lower lobe. (b) Coronal CT reconstruction after placement of a single RFA probe within the center of the nodule shows a relatively large pulmonary segmental artery (arrow) adjacent to the lateral margin of the tumor. (c) Coronal CT reconstruction after two cycles of complete ablation with final temperatures higher than 60°C shows an adequate ablation zone and ground-glass opacity extending beyond 5 mm from the margins of the nodule, with the exception of the lateral margin bordering the pulmonary artery branch (arrow), a finding that is due to the heat sink effect. (d) Contrast-enhanced CT image obtained at 3 months after RFA shows peripheral nodular enhancement (arrowhead) adjacent to the pulmonary artery branch. (e) CT image obtained at 9 months shows that the nodule has grown larger than baseline and larger than the 3-month postablation zone, a finding consistent with recurrence. (f) Axial PET image obtained at 9 months shows hypermetabolic activity, which is also consistent with recurrence.
Figure 5b.

Heat sink effect and inadequate ablation of a metastatic nodule from a renal cell carcinoma in the right lower lobe in a 57-year-old man. (a) CT image shows the solitary 19 × 18-mm metastatic nodule in the right lower lobe. (b) Coronal CT reconstruction after placement of a single RFA probe within the center of the nodule shows a relatively large pulmonary segmental artery (arrow) adjacent to the lateral margin of the tumor. (c) Coronal CT reconstruction after two cycles of complete ablation with final temperatures higher than 60°C shows an adequate ablation zone and ground-glass opacity extending beyond 5 mm from the margins of the nodule, with the exception of the lateral margin bordering the pulmonary artery branch (arrow), a finding that is due to the heat sink effect. (d) Contrast-enhanced CT image obtained at 3 months after RFA shows peripheral nodular enhancement (arrowhead) adjacent to the pulmonary artery branch. (e) CT image obtained at 9 months shows that the nodule has grown larger than baseline and larger than the 3-month postablation zone, a finding consistent with recurrence. (f) Axial PET image obtained at 9 months shows hypermetabolic activity, which is also consistent with recurrence.
Figure 5c.

Heat sink effect and inadequate ablation of a metastatic nodule from a renal cell carcinoma in the right lower lobe in a 57-year-old man. (a) CT image shows the solitary 19 × 18-mm metastatic nodule in the right lower lobe. (b) Coronal CT reconstruction after placement of a single RFA probe within the center of the nodule shows a relatively large pulmonary segmental artery (arrow) adjacent to the lateral margin of the tumor. (c) Coronal CT reconstruction after two cycles of complete ablation with final temperatures higher than 60°C shows an adequate ablation zone and ground-glass opacity extending beyond 5 mm from the margins of the nodule, with the exception of the lateral margin bordering the pulmonary artery branch (arrow), a finding that is due to the heat sink effect. (d) Contrast-enhanced CT image obtained at 3 months after RFA shows peripheral nodular enhancement (arrowhead) adjacent to the pulmonary artery branch. (e) CT image obtained at 9 months shows that the nodule has grown larger than baseline and larger than the 3-month postablation zone, a finding consistent with recurrence. (f) Axial PET image obtained at 9 months shows hypermetabolic activity, which is also consistent with recurrence.
Figure 5d.

Heat sink effect and inadequate ablation of a metastatic nodule from a renal cell carcinoma in the right lower lobe in a 57-year-old man. (a) CT image shows the solitary 19 × 18-mm metastatic nodule in the right lower lobe. (b) Coronal CT reconstruction after placement of a single RFA probe within the center of the nodule shows a relatively large pulmonary segmental artery (arrow) adjacent to the lateral margin of the tumor. (c) Coronal CT reconstruction after two cycles of complete ablation with final temperatures higher than 60°C shows an adequate ablation zone and ground-glass opacity extending beyond 5 mm from the margins of the nodule, with the exception of the lateral margin bordering the pulmonary artery branch (arrow), a finding that is due to the heat sink effect. (d) Contrast-enhanced CT image obtained at 3 months after RFA shows peripheral nodular enhancement (arrowhead) adjacent to the pulmonary artery branch. (e) CT image obtained at 9 months shows that the nodule has grown larger than baseline and larger than the 3-month postablation zone, a finding consistent with recurrence. (f) Axial PET image obtained at 9 months shows hypermetabolic activity, which is also consistent with recurrence.
Figure 5e.

Heat sink effect and inadequate ablation of a metastatic nodule from a renal cell carcinoma in the right lower lobe in a 57-year-old man. (a) CT image shows the solitary 19 × 18-mm metastatic nodule in the right lower lobe. (b) Coronal CT reconstruction after placement of a single RFA probe within the center of the nodule shows a relatively large pulmonary segmental artery (arrow) adjacent to the lateral margin of the tumor. (c) Coronal CT reconstruction after two cycles of complete ablation with final temperatures higher than 60°C shows an adequate ablation zone and ground-glass opacity extending beyond 5 mm from the margins of the nodule, with the exception of the lateral margin bordering the pulmonary artery branch (arrow), a finding that is due to the heat sink effect. (d) Contrast-enhanced CT image obtained at 3 months after RFA shows peripheral nodular enhancement (arrowhead) adjacent to the pulmonary artery branch. (e) CT image obtained at 9 months shows that the nodule has grown larger than baseline and larger than the 3-month postablation zone, a finding consistent with recurrence. (f) Axial PET image obtained at 9 months shows hypermetabolic activity, which is also consistent with recurrence.
Figure 5f.

Heat sink effect and inadequate ablation of a metastatic nodule from a renal cell carcinoma in the right lower lobe in a 57-year-old man. (a) CT image shows the solitary 19 × 18-mm metastatic nodule in the right lower lobe. (b) Coronal CT reconstruction after placement of a single RFA probe within the center of the nodule shows a relatively large pulmonary segmental artery (arrow) adjacent to the lateral margin of the tumor. (c) Coronal CT reconstruction after two cycles of complete ablation with final temperatures higher than 60°C shows an adequate ablation zone and ground-glass opacity extending beyond 5 mm from the margins of the nodule, with the exception of the lateral margin bordering the pulmonary artery branch (arrow), a finding that is due to the heat sink effect. (d) Contrast-enhanced CT image obtained at 3 months after RFA shows peripheral nodular enhancement (arrowhead) adjacent to the pulmonary artery branch. (e) CT image obtained at 9 months shows that the nodule has grown larger than baseline and larger than the 3-month postablation zone, a finding consistent with recurrence. (f) Axial PET image obtained at 9 months shows hypermetabolic activity, which is also consistent with recurrence.
By using a porcine model with ablation of a normal lung to provide histopathologic correlation of postablation CT findings, Yamamoto et el (15) demonstrated that these perilesional ground-glass opacities correspond to three distinct layers: (a) an inner layer of preserved architecture and acidophilic cytoplasm, (b) an intermediate layer of alveolar effusion, and (c) an outer layer of congested lung, with hemorrhage and neutrophil infiltration (Fig 6a) (15). Immunohistologic staining with nicotinamide adenine dinucleotide, reduced (NADH), demonstrated that only the inner and intermediate layers were necrotic and that the outermost layer contained viable lung parenchyma (Fig 6b). The average width of the outermost layer was 2.6 mm, with a maximum width of 4.1 mm. Yamamoto et el (15) concluded that because the outermost layer may contain viable tumor cells, the ground-glass opacities overestimate the area of necrosis. The findings from this study thus provide a histologic explanation for the observed increased rates of recurrence for tumors with ground-glass opacity margins of less than 5 mm (15).
Figure 6a.

Images from a porcine model of RFA. (a) Photomicrograph (original magnification, ×40; hematoxylin-eosin [H-E] stain) of a histologic section of an ablated lesion in a porcine lung shows normal lung tissue (N), congestion (C) in the outermost layer, and effusion (E) in the lumina of the pulmonary alveoli in the intermediate layer. (b) Photomicrograph (original magnification, ×20; NADH diaphorase stain) of the same section of tissue as in a shows that the intermediate layer (E) shown in a does not stain with NADH and conforms to the ablated lesion, which has undergone coagulation necrosis. However, the outermost layer (C) contains an admixture of stained and unstained cells (arrows). NL = normal lung tissue. (Reprinted, with permission, from reference 15.)
Figure 6b.

Images from a porcine model of RFA. (a) Photomicrograph (original magnification, ×40; hematoxylin-eosin [H-E] stain) of a histologic section of an ablated lesion in a porcine lung shows normal lung tissue (N), congestion (C) in the outermost layer, and effusion (E) in the lumina of the pulmonary alveoli in the intermediate layer. (b) Photomicrograph (original magnification, ×20; NADH diaphorase stain) of the same section of tissue as in a shows that the intermediate layer (E) shown in a does not stain with NADH and conforms to the ablated lesion, which has undergone coagulation necrosis. However, the outermost layer (C) contains an admixture of stained and unstained cells (arrows). NL = normal lung tissue. (Reprinted, with permission, from reference 15.)
At CT performed immediately after the RFA procedure, multiple concentric rings of varying attenuation may be seen surrounding the ablated lesion. These concentric rings, termed the cockade phenomenon (Fig 7), are believed to correspond to the five zones described by Miao et al (36) on MR images of RFA-treated lung neoplasms in rabbits (39). These zones demonstrate various histologic features according to the temperature gradients between the ablated lesion and the surrounding parenchyma: (a) zone A, a small vacuolated or charred area corresponding to the electrode needle track; (b) zone B, coagulated tumor; (c) zone C, coagulated pulmonary parenchyma; (d) zone D, coagulation necrosis mixed with hemorrhage; and (e) zone E, peripheral inflammatory reaction. The so-called ghost cell phenomenon is seen in zones B and C. This phenomenon is attributed to sudden tissue coagulation and destroyed microcirculation caused by cytotoxic temperatures, which prevents the release of enzymes from intracellular lysosomes and the infiltration of the tissue by inflammatory cells, thereby delaying cellular autolysis. Ghost cells demonstrate histologic features that are consistent with apoptosis. The occurrence of hyperthermia-induced apoptosis has been demonstrated in vitro and in vivo.
Figure 7.

Cockade phenomenon in a 65-year-old man after RFA. CT image of the post-RFA ablation zone demonstrates multiple concentric layers. Zones A and B are not distinguished separately and correspond to the enlarged primary lesion; these two zones histologically correspond to vacuolation and charred tissue (zone A) and coagulated tumor (zone B). Zone C is a rim of relatively low-attenuation ground-glass opacity immediately around the tumor (black arrows), which histologically corresponds to coagulated pulmonary parenchyma. Zone D is the higher-attenuation ground-glass opacity (arrowheads), which histologically corresponds to coagulation necrosis mixed with hemorrhage. Zone E is the variable ground-glass opacity (white arrows), which histologically represents peripheral inflammatory reaction.
Additional postprocedural findings include pulmonary complications, such as hemorrhage, as well as pleural changes, specifically pleural thickening, effusion, and pneumothorax. Pneumothorax is the most frequent complication, occurring in 30%–50% of patients. Steinke et al (41) reported that pneumothorax occurs more frequently in patients treated for multiple tumors during the same session and in patients with more centrally located tumors. Hiraki et al (38) identified the following risk factors for developing pneumothorax after RFA: male gender, no prior history of pulmonary surgery, greater number of tumors ablated, involvement of the middle or lower lobe, and increased length of aerated lung traversed by the electrode. Surprisingly, the occurrence of pneumothorax was not related to the presence of emphysema, the type of electrode used, the number of electrode passes through the target lesion, the age of the patient, or the position of the patient during the procedure (14,38). Hiraki et al (38) found that pleural effusions occurred relatively frequently after RFA, with effusions observed in 19% of ablated lesions. Of the 42 patients with postablation pleural effusions, three patients required chest tube drainage for massive accumulation. Risk factors included the use of a cluster electrode, decreased distance to the adjacent pleura, and decreased length of traversed aerated lung (38).
Size.—Immediately after RFA, the ablation zone appears larger than the original tumor because the zone consists of both tumor and the perilesional ground-glass opacity corresponding to the safety zone, or area of ablation beyond the tumor margins (Fig 8a). As the ablation zone evolves during the 1st week, it may appear substantially larger because of ensuing consolidation, inflammation, and hemorrhage (Fig 8b, 8c).
Figure 8a.

Metastatic pulmonary lesion from colon carcinoma in a 71-year-old man undergoing RFA with a single probe. (a) Contrast-enhanced CT image obtained immediately after ablation shows a cone-shaped sectorial hyperemia (arrowheads), which corresponds to the safety zone, the area of ablation beyond lesion margins. Hypoattenuating bubbles and pleural retraction are seen. (b, c) CT images obtained with lung (b) and soft-tissue (c) windows at 1 week show that the ablation zone has increased compared with the original due to a combination of consolidation, inflammation, and hemorrhage. Cavitation and hypoattenuating bubbles are common at this stage. (d) At 1 week, images of CT nodule densitometry obtained at 45, 90, 180, and 300 seconds after contrast material injection show a thin rim of enhancement (arrow) without central nodularity or contrast enhancement of more than 15 HU. (e, f) CT (e) and fused PET/CT (f) images obtained at 18 months show a residual scar without metabolic activity.
Figure 8b.

Metastatic pulmonary lesion from colon carcinoma in a 71-year-old man undergoing RFA with a single probe. (a) Contrast-enhanced CT image obtained immediately after ablation shows a cone-shaped sectorial hyperemia (arrowheads), which corresponds to the safety zone, the area of ablation beyond lesion margins. Hypoattenuating bubbles and pleural retraction are seen. (b, c) CT images obtained with lung (b) and soft-tissue (c) windows at 1 week show that the ablation zone has increased compared with the original due to a combination of consolidation, inflammation, and hemorrhage. Cavitation and hypoattenuating bubbles are common at this stage. (d) At 1 week, images of CT nodule densitometry obtained at 45, 90, 180, and 300 seconds after contrast material injection show a thin rim of enhancement (arrow) without central nodularity or contrast enhancement of more than 15 HU. (e, f) CT (e) and fused PET/CT (f) images obtained at 18 months show a residual scar without metabolic activity.
Figure 8c.

Metastatic pulmonary lesion from colon carcinoma in a 71-year-old man undergoing RFA with a single probe. (a) Contrast-enhanced CT image obtained immediately after ablation shows a cone-shaped sectorial hyperemia (arrowheads), which corresponds to the safety zone, the area of ablation beyond lesion margins. Hypoattenuating bubbles and pleural retraction are seen. (b, c) CT images obtained with lung (b) and soft-tissue (c) windows at 1 week show that the ablation zone has increased compared with the original due to a combination of consolidation, inflammation, and hemorrhage. Cavitation and hypoattenuating bubbles are common at this stage. (d) At 1 week, images of CT nodule densitometry obtained at 45, 90, 180, and 300 seconds after contrast material injection show a thin rim of enhancement (arrow) without central nodularity or contrast enhancement of more than 15 HU. (e, f) CT (e) and fused PET/CT (f) images obtained at 18 months show a residual scar without metabolic activity.
Figure 8d.

Metastatic pulmonary lesion from colon carcinoma in a 71-year-old man undergoing RFA with a single probe. (a) Contrast-enhanced CT image obtained immediately after ablation shows a cone-shaped sectorial hyperemia (arrowheads), which corresponds to the safety zone, the area of ablation beyond lesion margins. Hypoattenuating bubbles and pleural retraction are seen. (b, c) CT images obtained with lung (b) and soft-tissue (c) windows at 1 week show that the ablation zone has increased compared with the original due to a combination of consolidation, inflammation, and hemorrhage. Cavitation and hypoattenuating bubbles are common at this stage. (d) At 1 week, images of CT nodule densitometry obtained at 45, 90, 180, and 300 seconds after contrast material injection show a thin rim of enhancement (arrow) without central nodularity or contrast enhancement of more than 15 HU. (e, f) CT (e) and fused PET/CT (f) images obtained at 18 months show a residual scar without metabolic activity.
Figure 8e.

Metastatic pulmonary lesion from colon carcinoma in a 71-year-old man undergoing RFA with a single probe. (a) Contrast-enhanced CT image obtained immediately after ablation shows a cone-shaped sectorial hyperemia (arrowheads), which corresponds to the safety zone, the area of ablation beyond lesion margins. Hypoattenuating bubbles and pleural retraction are seen. (b, c) CT images obtained with lung (b) and soft-tissue (c) windows at 1 week show that the ablation zone has increased compared with the original due to a combination of consolidation, inflammation, and hemorrhage. Cavitation and hypoattenuating bubbles are common at this stage. (d) At 1 week, images of CT nodule densitometry obtained at 45, 90, 180, and 300 seconds after contrast material injection show a thin rim of enhancement (arrow) without central nodularity or contrast enhancement of more than 15 HU. (e, f) CT (e) and fused PET/CT (f) images obtained at 18 months show a residual scar without metabolic activity.
Figure 8f.

Metastatic pulmonary lesion from colon carcinoma in a 71-year-old man undergoing RFA with a single probe. (a) Contrast-enhanced CT image obtained immediately after ablation shows a cone-shaped sectorial hyperemia (arrowheads), which corresponds to the safety zone, the area of ablation beyond lesion margins. Hypoattenuating bubbles and pleural retraction are seen. (b, c) CT images obtained with lung (b) and soft-tissue (c) windows at 1 week show that the ablation zone has increased compared with the original due to a combination of consolidation, inflammation, and hemorrhage. Cavitation and hypoattenuating bubbles are common at this stage. (d) At 1 week, images of CT nodule densitometry obtained at 45, 90, 180, and 300 seconds after contrast material injection show a thin rim of enhancement (arrow) without central nodularity or contrast enhancement of more than 15 HU. (e, f) CT (e) and fused PET/CT (f) images obtained at 18 months show a residual scar without metabolic activity.
Enhancement.—Contrast-enhanced CT performed within 1 week after RFA typically shows a central hypoattenuating area with marked reduction in contrast material uptake, the result of RFA-induced damage to the microcirculation (Fig 8b–8d) (22). A thin rim of enhancement, referred to as benign periablational enhancement, may be seen peripheral to the ablation zone; this rim is generally less than 5 mm thick and has a concentric shape with smooth margins (Fig 8d). This enhancement is believed to represent physiologic response to thermal injury—initially, reactive hyperemia and, subsequently, fibrosis and giant cell reaction. CT nodule densitometry shows a peripheral thin rim of enhancement without central or nodular rim enhancement (Fig 8d). Benign periablational enhancement should be differentiated from “irregular peripheral enhancement,” which is more nodular and represents residual or incompletely ablated tumor (Fig 5d) (37).
PET.—Immediately after ablation, a peripheral ring-shaped area of hypermetabolic activity may be seen surrounding the ablated tumor. Postablation inflammation may obscure subcentimeter residual tissue, and so PET is usually delayed until 2 months after RFA.
Intermediate Phase (>1 Week–2 Months)
CT Appearance.—By 1 month, surrounding ground-glass opacities have involuted in most patients (47). Cavitation is a common finding, occurring in 24%–31% of ablated lesions (Fig 9a–9c) (47,48). The cavities may demonstrate a reparative hyperemic envelope that progressively decreases in thickness with time (39). Bojarski et al (48), in their review of post-RFA CT scans of 120 lesions, reported that tumors located close to a segmental bronchus were more likely to demonstrate cavitation. Steinke et al (47) reported that cavitation was observed more frequently when the size of the lesion at 1 week after treatment exceeded the size of the pretreatment tumor by 200% or more. This magnitude of size increase occurred regularly in lesions less than 2 cm in diameter (47). The presence of cavitation has been used as a marker of treatment efficacy (39). Hypoattenuating bubbles are frequently seen in ablation zones that do not demonstrate cavitation (Fig 9c) (48).
Figure 9a.

Renal cell carcinoma with metastasis to the left lower lobe in a 64-year-old man. (a) CT image shows the pulmonary metastatic lesion. (b) CT image obtained immediately after ablation shows postablation zones C (arrows) and D (arrowheads) around the tumor, corresponding to the safety zone, the area of ablation beyond the tumor margins. (c) CT image obtained at 1 month after ablation shows a larger ablation zone than the original tumor, but the surrounding ground-glass opacity and hemorrhage have involuted. Cavitation and hypoattenuating bubbles are common at this stage. Pleural thickening is depicted adjacent to the ablation zone and along the electrode track. (d) CT image obtained at 4 months after ablation shows that the ablation zone continues to demonstrate peripheral enhancement (arrows). Pleural effusion and atelectasis were also seen secondary to ablation of another nodule in the left upper lobe (not shown). (e) Axial fused PET/CT image shows peripheral FDG uptake (arrows) not exceeding that of the blood pool or the adjacent collapsed lung. (f–h) Follow-up CT images obtained at 6 months (f), 9 months (g), and 12 months (h) after ablation. The nodule continues to regress in size, measuring smaller than the original tumor, with eventual scarring and remodeling of lung parenchyma and resolution of the pleural thickening and effusion.
Figure 9b.

Renal cell carcinoma with metastasis to the left lower lobe in a 64-year-old man. (a) CT image shows the pulmonary metastatic lesion. (b) CT image obtained immediately after ablation shows postablation zones C (arrows) and D (arrowheads) around the tumor, corresponding to the safety zone, the area of ablation beyond the tumor margins. (c) CT image obtained at 1 month after ablation shows a larger ablation zone than the original tumor, but the surrounding ground-glass opacity and hemorrhage have involuted. Cavitation and hypoattenuating bubbles are common at this stage. Pleural thickening is depicted adjacent to the ablation zone and along the electrode track. (d) CT image obtained at 4 months after ablation shows that the ablation zone continues to demonstrate peripheral enhancement (arrows). Pleural effusion and atelectasis were also seen secondary to ablation of another nodule in the left upper lobe (not shown). (e) Axial fused PET/CT image shows peripheral FDG uptake (arrows) not exceeding that of the blood pool or the adjacent collapsed lung. (f–h) Follow-up CT images obtained at 6 months (f), 9 months (g), and 12 months (h) after ablation. The nodule continues to regress in size, measuring smaller than the original tumor, with eventual scarring and remodeling of lung parenchyma and resolution of the pleural thickening and effusion.
Figure 9c.

Renal cell carcinoma with metastasis to the left lower lobe in a 64-year-old man. (a) CT image shows the pulmonary metastatic lesion. (b) CT image obtained immediately after ablation shows postablation zones C (arrows) and D (arrowheads) around the tumor, corresponding to the safety zone, the area of ablation beyond the tumor margins. (c) CT image obtained at 1 month after ablation shows a larger ablation zone than the original tumor, but the surrounding ground-glass opacity and hemorrhage have involuted. Cavitation and hypoattenuating bubbles are common at this stage. Pleural thickening is depicted adjacent to the ablation zone and along the electrode track. (d) CT image obtained at 4 months after ablation shows that the ablation zone continues to demonstrate peripheral enhancement (arrows). Pleural effusion and atelectasis were also seen secondary to ablation of another nodule in the left upper lobe (not shown). (e) Axial fused PET/CT image shows peripheral FDG uptake (arrows) not exceeding that of the blood pool or the adjacent collapsed lung. (f–h) Follow-up CT images obtained at 6 months (f), 9 months (g), and 12 months (h) after ablation. The nodule continues to regress in size, measuring smaller than the original tumor, with eventual scarring and remodeling of lung parenchyma and resolution of the pleural thickening and effusion.
Figure 9d.

Renal cell carcinoma with metastasis to the left lower lobe in a 64-year-old man. (a) CT image shows the pulmonary metastatic lesion. (b) CT image obtained immediately after ablation shows postablation zones C (arrows) and D (arrowheads) around the tumor, corresponding to the safety zone, the area of ablation beyond the tumor margins. (c) CT image obtained at 1 month after ablation shows a larger ablation zone than the original tumor, but the surrounding ground-glass opacity and hemorrhage have involuted. Cavitation and hypoattenuating bubbles are common at this stage. Pleural thickening is depicted adjacent to the ablation zone and along the electrode track. (d) CT image obtained at 4 months after ablation shows that the ablation zone continues to demonstrate peripheral enhancement (arrows). Pleural effusion and atelectasis were also seen secondary to ablation of another nodule in the left upper lobe (not shown). (e) Axial fused PET/CT image shows peripheral FDG uptake (arrows) not exceeding that of the blood pool or the adjacent collapsed lung. (f–h) Follow-up CT images obtained at 6 months (f), 9 months (g), and 12 months (h) after ablation. The nodule continues to regress in size, measuring smaller than the original tumor, with eventual scarring and remodeling of lung parenchyma and resolution of the pleural thickening and effusion.
Figure 9e.

Renal cell carcinoma with metastasis to the left lower lobe in a 64-year-old man. (a) CT image shows the pulmonary metastatic lesion. (b) CT image obtained immediately after ablation shows postablation zones C (arrows) and D (arrowheads) around the tumor, corresponding to the safety zone, the area of ablation beyond the tumor margins. (c) CT image obtained at 1 month after ablation shows a larger ablation zone than the original tumor, but the surrounding ground-glass opacity and hemorrhage have involuted. Cavitation and hypoattenuating bubbles are common at this stage. Pleural thickening is depicted adjacent to the ablation zone and along the electrode track. (d) CT image obtained at 4 months after ablation shows that the ablation zone continues to demonstrate peripheral enhancement (arrows). Pleural effusion and atelectasis were also seen secondary to ablation of another nodule in the left upper lobe (not shown). (e) Axial fused PET/CT image shows peripheral FDG uptake (arrows) not exceeding that of the blood pool or the adjacent collapsed lung. (f–h) Follow-up CT images obtained at 6 months (f), 9 months (g), and 12 months (h) after ablation. The nodule continues to regress in size, measuring smaller than the original tumor, with eventual scarring and remodeling of lung parenchyma and resolution of the pleural thickening and effusion.
Figure 9f.

Renal cell carcinoma with metastasis to the left lower lobe in a 64-year-old man. (a) CT image shows the pulmonary metastatic lesion. (b) CT image obtained immediately after ablation shows postablation zones C (arrows) and D (arrowheads) around the tumor, corresponding to the safety zone, the area of ablation beyond the tumor margins. (c) CT image obtained at 1 month after ablation shows a larger ablation zone than the original tumor, but the surrounding ground-glass opacity and hemorrhage have involuted. Cavitation and hypoattenuating bubbles are common at this stage. Pleural thickening is depicted adjacent to the ablation zone and along the electrode track. (d) CT image obtained at 4 months after ablation shows that the ablation zone continues to demonstrate peripheral enhancement (arrows). Pleural effusion and atelectasis were also seen secondary to ablation of another nodule in the left upper lobe (not shown). (e) Axial fused PET/CT image shows peripheral FDG uptake (arrows) not exceeding that of the blood pool or the adjacent collapsed lung. (f–h) Follow-up CT images obtained at 6 months (f), 9 months (g), and 12 months (h) after ablation. The nodule continues to regress in size, measuring smaller than the original tumor, with eventual scarring and remodeling of lung parenchyma and resolution of the pleural thickening and effusion.
Figure 9g.

Renal cell carcinoma with metastasis to the left lower lobe in a 64-year-old man. (a) CT image shows the pulmonary metastatic lesion. (b) CT image obtained immediately after ablation shows postablation zones C (arrows) and D (arrowheads) around the tumor, corresponding to the safety zone, the area of ablation beyond the tumor margins. (c) CT image obtained at 1 month after ablation shows a larger ablation zone than the original tumor, but the surrounding ground-glass opacity and hemorrhage have involuted. Cavitation and hypoattenuating bubbles are common at this stage. Pleural thickening is depicted adjacent to the ablation zone and along the electrode track. (d) CT image obtained at 4 months after ablation shows that the ablation zone continues to demonstrate peripheral enhancement (arrows). Pleural effusion and atelectasis were also seen secondary to ablation of another nodule in the left upper lobe (not shown). (e) Axial fused PET/CT image shows peripheral FDG uptake (arrows) not exceeding that of the blood pool or the adjacent collapsed lung. (f–h) Follow-up CT images obtained at 6 months (f), 9 months (g), and 12 months (h) after ablation. The nodule continues to regress in size, measuring smaller than the original tumor, with eventual scarring and remodeling of lung parenchyma and resolution of the pleural thickening and effusion.
Figure 9h.

Renal cell carcinoma with metastasis to the left lower lobe in a 64-year-old man. (a) CT image shows the pulmonary metastatic lesion. (b) CT image obtained immediately after ablation shows postablation zones C (arrows) and D (arrowheads) around the tumor, corresponding to the safety zone, the area of ablation beyond the tumor margins. (c) CT image obtained at 1 month after ablation shows a larger ablation zone than the original tumor, but the surrounding ground-glass opacity and hemorrhage have involuted. Cavitation and hypoattenuating bubbles are common at this stage. Pleural thickening is depicted adjacent to the ablation zone and along the electrode track. (d) CT image obtained at 4 months after ablation shows that the ablation zone continues to demonstrate peripheral enhancement (arrows). Pleural effusion and atelectasis were also seen secondary to ablation of another nodule in the left upper lobe (not shown). (e) Axial fused PET/CT image shows peripheral FDG uptake (arrows) not exceeding that of the blood pool or the adjacent collapsed lung. (f–h) Follow-up CT images obtained at 6 months (f), 9 months (g), and 12 months (h) after ablation. The nodule continues to regress in size, measuring smaller than the original tumor, with eventual scarring and remodeling of lung parenchyma and resolution of the pleural thickening and effusion.
Pleural thickening is also a common finding during the intermediate phase. Such thickening most commonly occurs in the region of pleura traversed by the radiofrequency electrode and averages 0.7 cm in thickness (Fig 9c). The pleural changes observed during the early phase show progressive fading, with resulting appearances ranging from complete resolution of pleural effusion to pleural thickening or pleural-parenchymal tags. Pneumothoraces tend to persist but remain as contained bronchopleural fistulas. In particular, with peripheral lesions, the active or live part of the electrode is close to the pleura, and the ablation zone may extend proximally or back along the electrode track to produce prolonged air leak and bronchopleural fistula. These cases are mostly managed with prolonged chest tube drainage or at times may need pleurodesis or surgical intervention (Fig 10). Sakurai et al (49) reported 182 pneumothoraces in 334 treatment sessions, and only two of the pneumothoraces were intractable, with protracted and complicated management. Both of the confirmed bronchopleural fistulas occurred in treated squamous cell carcinomas located immediately adjacent to the pleura and were attributed to excessive sloughing of necrotic tissue, possibly caused by the electrode design (49).
Figure 10a.

Colon carcinoma with metastasis to the left lower lobe in a 62-year-old man. (a) CT image shows the pulmonary lesion with surrounding satellite nodules and extension up to the pleural surface. After removal of one of the electrodes, a breach at the pleural surface (arrow) is seen. On the postablation chest radiograph (not shown), there was no appreciable pneumothorax, and the patient was discharged. On postablation day 10, the patient presented with persistent shortness of breath. (b) CT image obtained on day 10 shows a breach in the pleural surface (arrow), surrounded by the postablation zone. A chest tube was inserted. (c) Subsequent chest radiograph shows the chest tube, with reexpansion of the lung. The tube remained in place for 11 days. On postablation day 21, after multiple attempts, the chest tube was clamped for 12 hours and subsequently removed. (d) Chest radiograph obtained after removal of the tube shows no redevelopment of pneumothorax.
Figure 10b.

Colon carcinoma with metastasis to the left lower lobe in a 62-year-old man. (a) CT image shows the pulmonary lesion with surrounding satellite nodules and extension up to the pleural surface. After removal of one of the electrodes, a breach at the pleural surface (arrow) is seen. On the postablation chest radiograph (not shown), there was no appreciable pneumothorax, and the patient was discharged. On postablation day 10, the patient presented with persistent shortness of breath. (b) CT image obtained on day 10 shows a breach in the pleural surface (arrow), surrounded by the postablation zone. A chest tube was inserted. (c) Subsequent chest radiograph shows the chest tube, with reexpansion of the lung. The tube remained in place for 11 days. On postablation day 21, after multiple attempts, the chest tube was clamped for 12 hours and subsequently removed. (d) Chest radiograph obtained after removal of the tube shows no redevelopment of pneumothorax.
Figure 10c.

Colon carcinoma with metastasis to the left lower lobe in a 62-year-old man. (a) CT image shows the pulmonary lesion with surrounding satellite nodules and extension up to the pleural surface. After removal of one of the electrodes, a breach at the pleural surface (arrow) is seen. On the postablation chest radiograph (not shown), there was no appreciable pneumothorax, and the patient was discharged. On postablation day 10, the patient presented with persistent shortness of breath. (b) CT image obtained on day 10 shows a breach in the pleural surface (arrow), surrounded by the postablation zone. A chest tube was inserted. (c) Subsequent chest radiograph shows the chest tube, with reexpansion of the lung. The tube remained in place for 11 days. On postablation day 21, after multiple attempts, the chest tube was clamped for 12 hours and subsequently removed. (d) Chest radiograph obtained after removal of the tube shows no redevelopment of pneumothorax.
Figure 10d.

Colon carcinoma with metastasis to the left lower lobe in a 62-year-old man. (a) CT image shows the pulmonary lesion with surrounding satellite nodules and extension up to the pleural surface. After removal of one of the electrodes, a breach at the pleural surface (arrow) is seen. On the postablation chest radiograph (not shown), there was no appreciable pneumothorax, and the patient was discharged. On postablation day 10, the patient presented with persistent shortness of breath. (b) CT image obtained on day 10 shows a breach in the pleural surface (arrow), surrounded by the postablation zone. A chest tube was inserted. (c) Subsequent chest radiograph shows the chest tube, with reexpansion of the lung. The tube remained in place for 11 days. On postablation day 21, after multiple attempts, the chest tube was clamped for 12 hours and subsequently removed. (d) Chest radiograph obtained after removal of the tube shows no redevelopment of pneumothorax.
Size.—In the intermediate phase, the ablation zone will continue to be larger, compared with the original tumor, but should be smaller relative to the early phase as a result of regressing parenchymal edema, inflammation, and hemorrhage. Linear opacities, often associated with segmental volume loss, may also be seen between the ablated tumor and adjacent pleura and will contribute to its overall size (Fig 9c) (15,48).
Enhancement.—In the intermediate phase, the ablation zone continues to demonstrate a marked reduction in contrast material uptake compared with pre-RFA tumor enhancement. Benign periablational enhancement may continue to be seen, persisting for as long as 6 months after RFA (Fig 9d). Although unusual during the intermediate phase, the appearance of central or nodular enhancement is suggestive of residual disease or progression (Fig 5d).
PET.—On PET images, the uptake peaks by 2 weeks and thereafter continues to decline, reaching background mediastinal blood pool levels by 2 months. Okuma et al (54) reported that persistent FDG uptake or less than 60% reduction of uptake at 2 months relative to baseline may be predictive of recurrence on CT images at 6 months. Recently, Singnurkar et al (59) defined six uptake patterns at PET/CT performed between 1 and 4 months after ablation: (a) diffuse, (b) focal, (c) heterogeneous, (d) rim, (e) rim plus focal uptake corresponding to the site of the original lesion, and (f) rim plus focal uptake at a different location (not corresponding to the site of the original lesion). Favorable uptake patterns included rim, diffuse, heterogeneous, and rim plus focal uptake when the focal uptake did not correspond to the original tumor nodule (Fig 9e). Rim with superimposed focal uptake corresponding to the original tumor nodule was shown to be associated with local recurrence (Fig 2b). Superimposed focal uptake at a noncorresponding site was hypothesized to indicate heterogeneous inflammation around the ablated site (58).
Late Phase (>2 Months)
CT Appearance.—During the late phase, the ablation zone undergoes further involution. Patchy areas of hyperattenuation may be seen within the ablation zone at unenhanced CT imaging. The wall thickness and the size of previously depicted cavities progressively decrease. The cavities eventually disappear and undergo scarring, with minimal architectural distortion of the surrounding lung parenchyma. Hypoattenuating bubbles usually resolve by 1 year after RFA. Sequential CT examinations also show resolution of early and intermediate findings, including pleural thickening, pleural effusion, and pneumothorax. Peripheral tumors induce pleural retraction and tug, depicted on delayed images. After 6 months, the ablation zone undergoes few changes in appearance other than progressive involution of cavities (Fig 9f–9h) (48).
Satellite nodules and the development of nodules along the electrode track or tines are early indications of tumor recurrence and progression. On occasion, a nodular satellite pattern of tumor progression may be observed in patients treated with expandable electrodes, with the nodules corresponding to the deployed tines of the electrode. This peripheral pattern of increased nodularity may also be seen with nonexpandable electrodes. The pattern, however, does not always represent recurrence and at times requires confirmation and early diagnostic resolution with biopsy (Figs 11, 12).
Figure 11a.

Non–small cell lung carcinoma in the right upper lobe in a 71-year-old woman. (a) CT image obtained with the patient in the prone position shows the lesion in the right upper lobe. (b) CT image obtained at RFA shows the single electrode with its tines deployed, extending to the edge of the mass. (c) Contrast-enhanced CT image at 3-month follow-up shows that there is overall stability in the size of the ablation zone without central nodular enhancement, with the exception of a focal peripheral enhancing nodular lesion (arrows). (d) Unenhanced CT image (lung window) shows needle biopsy of the nodule being performed. (e) The findings from the lung core-needle biopsy were negative for recurrence, but the photomicrograph (original magnification, ×100; H-E stain) of a histologic section of the specimen from biopsy shows fibrin (F) and collagen (C) deposition, with neovascularization (arrows = new vessels).
Figure 11b.

Non–small cell lung carcinoma in the right upper lobe in a 71-year-old woman. (a) CT image obtained with the patient in the prone position shows the lesion in the right upper lobe. (b) CT image obtained at RFA shows the single electrode with its tines deployed, extending to the edge of the mass. (c) Contrast-enhanced CT image at 3-month follow-up shows that there is overall stability in the size of the ablation zone without central nodular enhancement, with the exception of a focal peripheral enhancing nodular lesion (arrows). (d) Unenhanced CT image (lung window) shows needle biopsy of the nodule being performed. (e) The findings from the lung core-needle biopsy were negative for recurrence, but the photomicrograph (original magnification, ×100; H-E stain) of a histologic section of the specimen from biopsy shows fibrin (F) and collagen (C) deposition, with neovascularization (arrows = new vessels).
Figure 11c.

Non–small cell lung carcinoma in the right upper lobe in a 71-year-old woman. (a) CT image obtained with the patient in the prone position shows the lesion in the right upper lobe. (b) CT image obtained at RFA shows the single electrode with its tines deployed, extending to the edge of the mass. (c) Contrast-enhanced CT image at 3-month follow-up shows that there is overall stability in the size of the ablation zone without central nodular enhancement, with the exception of a focal peripheral enhancing nodular lesion (arrows). (d) Unenhanced CT image (lung window) shows needle biopsy of the nodule being performed. (e) The findings from the lung core-needle biopsy were negative for recurrence, but the photomicrograph (original magnification, ×100; H-E stain) of a histologic section of the specimen from biopsy shows fibrin (F) and collagen (C) deposition, with neovascularization (arrows = new vessels).
Figure 11d.

Non–small cell lung carcinoma in the right upper lobe in a 71-year-old woman. (a) CT image obtained with the patient in the prone position shows the lesion in the right upper lobe. (b) CT image obtained at RFA shows the single electrode with its tines deployed, extending to the edge of the mass. (c) Contrast-enhanced CT image at 3-month follow-up shows that there is overall stability in the size of the ablation zone without central nodular enhancement, with the exception of a focal peripheral enhancing nodular lesion (arrows). (d) Unenhanced CT image (lung window) shows needle biopsy of the nodule being performed. (e) The findings from the lung core-needle biopsy were negative for recurrence, but the photomicrograph (original magnification, ×100; H-E stain) of a histologic section of the specimen from biopsy shows fibrin (F) and collagen (C) deposition, with neovascularization (arrows = new vessels).
Figure 11e.

Non–small cell lung carcinoma in the right upper lobe in a 71-year-old woman. (a) CT image obtained with the patient in the prone position shows the lesion in the right upper lobe. (b) CT image obtained at RFA shows the single electrode with its tines deployed, extending to the edge of the mass. (c) Contrast-enhanced CT image at 3-month follow-up shows that there is overall stability in the size of the ablation zone without central nodular enhancement, with the exception of a focal peripheral enhancing nodular lesion (arrows). (d) Unenhanced CT image (lung window) shows needle biopsy of the nodule being performed. (e) The findings from the lung core-needle biopsy were negative for recurrence, but the photomicrograph (original magnification, ×100; H-E stain) of a histologic section of the specimen from biopsy shows fibrin (F) and collagen (C) deposition, with neovascularization (arrows = new vessels).
Figure 12a.

Primary lung adenocarcinoma in a 75-year-old man undergoing RFA with two electrodes. (a) CT image (lung window) shows the right lower lobe mass. (b) CT image (lung window) shows an electrode through the tumor after ablation. Small periablational hemorrhage and mild retraction of the pleura are depicted. (c) CT image obtained at 3-month follow-up shows an enlarging nodule (arrows) at the medial periphery of the ablation zone, a finding that instigated a lung core-needle biopsy. (d) CT image shows biopsy needle. (e) Photomicrograph (original magnification, ×400; H-E stain) of a histologic section of the specimen from biopsy shows nests of neoplastic cells (arrows) within a dense collagenous (C) desmoplastic response. Inset: Photomicrograph (original magnification, ×400; immunohistochemical stain for thyroid transcription factor 1 [TTF-1]) of a histologic section of the specimen from biopsy shows that the neoplastic cells (arrowheads) are positive for TTF-1 (brown nuclear staining), a finding that helped confirm their pulmonary origin.
Figure 12b.

Primary lung adenocarcinoma in a 75-year-old man undergoing RFA with two electrodes. (a) CT image (lung window) shows the right lower lobe mass. (b) CT image (lung window) shows an electrode through the tumor after ablation. Small periablational hemorrhage and mild retraction of the pleura are depicted. (c) CT image obtained at 3-month follow-up shows an enlarging nodule (arrows) at the medial periphery of the ablation zone, a finding that instigated a lung core-needle biopsy. (d) CT image shows biopsy needle. (e) Photomicrograph (original magnification, ×400; H-E stain) of a histologic section of the specimen from biopsy shows nests of neoplastic cells (arrows) within a dense collagenous (C) desmoplastic response. Inset: Photomicrograph (original magnification, ×400; immunohistochemical stain for thyroid transcription factor 1 [TTF-1]) of a histologic section of the specimen from biopsy shows that the neoplastic cells (arrowheads) are positive for TTF-1 (brown nuclear staining), a finding that helped confirm their pulmonary origin.
Figure 12c.

Primary lung adenocarcinoma in a 75-year-old man undergoing RFA with two electrodes. (a) CT image (lung window) shows the right lower lobe mass. (b) CT image (lung window) shows an electrode through the tumor after ablation. Small periablational hemorrhage and mild retraction of the pleura are depicted. (c) CT image obtained at 3-month follow-up shows an enlarging nodule (arrows) at the medial periphery of the ablation zone, a finding that instigated a lung core-needle biopsy. (d) CT image shows biopsy needle. (e) Photomicrograph (original magnification, ×400; H-E stain) of a histologic section of the specimen from biopsy shows nests of neoplastic cells (arrows) within a dense collagenous (C) desmoplastic response. Inset: Photomicrograph (original magnification, ×400; immunohistochemical stain for thyroid transcription factor 1 [TTF-1]) of a histologic section of the specimen from biopsy shows that the neoplastic cells (arrowheads) are positive for TTF-1 (brown nuclear staining), a finding that helped confirm their pulmonary origin.
Figure 12d.

Primary lung adenocarcinoma in a 75-year-old man undergoing RFA with two electrodes. (a) CT image (lung window) shows the right lower lobe mass. (b) CT image (lung window) shows an electrode through the tumor after ablation. Small periablational hemorrhage and mild retraction of the pleura are depicted. (c) CT image obtained at 3-month follow-up shows an enlarging nodule (arrows) at the medial periphery of the ablation zone, a finding that instigated a lung core-needle biopsy. (d) CT image shows biopsy needle. (e) Photomicrograph (original magnification, ×400; H-E stain) of a histologic section of the specimen from biopsy shows nests of neoplastic cells (arrows) within a dense collagenous (C) desmoplastic response. Inset: Photomicrograph (original magnification, ×400; immunohistochemical stain for thyroid transcription factor 1 [TTF-1]) of a histologic section of the specimen from biopsy shows that the neoplastic cells (arrowheads) are positive for TTF-1 (brown nuclear staining), a finding that helped confirm their pulmonary origin.
Figure 12e.

Primary lung adenocarcinoma in a 75-year-old man undergoing RFA with two electrodes. (a) CT image (lung window) shows the right lower lobe mass. (b) CT image (lung window) shows an electrode through the tumor after ablation. Small periablational hemorrhage and mild retraction of the pleura are depicted. (c) CT image obtained at 3-month follow-up shows an enlarging nodule (arrows) at the medial periphery of the ablation zone, a finding that instigated a lung core-needle biopsy. (d) CT image shows biopsy needle. (e) Photomicrograph (original magnification, ×400; H-E stain) of a histologic section of the specimen from biopsy shows nests of neoplastic cells (arrows) within a dense collagenous (C) desmoplastic response. Inset: Photomicrograph (original magnification, ×400; immunohistochemical stain for thyroid transcription factor 1 [TTF-1]) of a histologic section of the specimen from biopsy shows that the neoplastic cells (arrowheads) are positive for TTF-1 (brown nuclear staining), a finding that helped confirm their pulmonary origin.
Size.—At 3 months, in general, the size of the ablation zone should be the same size or larger than the baseline tumor, and by 6 months, the size of the ablation zone should be the same or smaller than the tumor before ablation (Fig 9f) (38). Bojarski et al (48) demonstrated that neoplasms that showed growth beyond 6 months continued to demonstrate growth at follow-up examinations, a finding consistent with residual or recurrent disease. Any growth beyond 3 months should therefore be considered suspicious for tumor recurrence. Several neoplasms that remained stable for more than 12 months showed new growth at 18 and 24 months after RFA, which was considered a sign of tumor recurrence (48).
Therefore, the size of the ablation zone at 3-month follow-up CT may be used as a reference measurement; any further increase in size is suggestive of progression of partially or incompletely ablated tumor (Fig 5e, 5f). No change in or shrinkage of the ablation zone at 6 months is suggestive of, but not definitive for, effective ablation.
Enhancement.—At the 3-month follow-up, an increase in mean contrast enhancement compared with that at the intermediate phase may occur, which Suh et al (22) postulated to be the result of recovering circulation rather than tumor growth. However, contrast material uptake should never exceed that of the original tumor (Fig 5e). As mentioned previously, benign periablational enhancement may be observed for as long as 6 months (37). The appearance of central or nodular enhancement measuring more than 10 mm or 15 HU suggests progression of incompletely ablated disease (Figs 1, 5) (22). After 6 months, the enhancement continues to decrease or does not exceed the 3-month enhancement (Figs 13, 14).
Figures 13a.

No recurrence after RFA in a 67-year-old man. (a) Composite series of CT images show the enhancement pattern (left row) and the change in size (right row) with time (numbers = months after RFA). (b) Graph shows the relationship of lesion size and enhancement during the 12-month post-RFA period. The numbers along the red line represent the maximum enhancement before and after contrast material administration, and the numbers along the blue line represent the size of the tumor (before RFA) or the ablation zone. The contrast enhancement (red line) decreases immediately after ablation and remains below baseline, never exceeding 15 HU. A slight increase in enhancement, compared with the 1-month value, occurs by 6 months, but then enhancement continues to decrease until 12 months. After RFA, the postablation zone (blue line) is largest up to1 month after RFA and then decreases in size thereafter but remains larger than the original size until 3 months; after 3 months, the zone continues to decrease in size and remains smaller than the original size.
Figures 13b.

No recurrence after RFA in a 67-year-old man. (a) Composite series of CT images show the enhancement pattern (left row) and the change in size (right row) with time (numbers = months after RFA). (b) Graph shows the relationship of lesion size and enhancement during the 12-month post-RFA period. The numbers along the red line represent the maximum enhancement before and after contrast material administration, and the numbers along the blue line represent the size of the tumor (before RFA) or the ablation zone. The contrast enhancement (red line) decreases immediately after ablation and remains below baseline, never exceeding 15 HU. A slight increase in enhancement, compared with the 1-month value, occurs by 6 months, but then enhancement continues to decrease until 12 months. After RFA, the postablation zone (blue line) is largest up to1 month after RFA and then decreases in size thereafter but remains larger than the original size until 3 months; after 3 months, the zone continues to decrease in size and remains smaller than the original size.
Figures 14a.
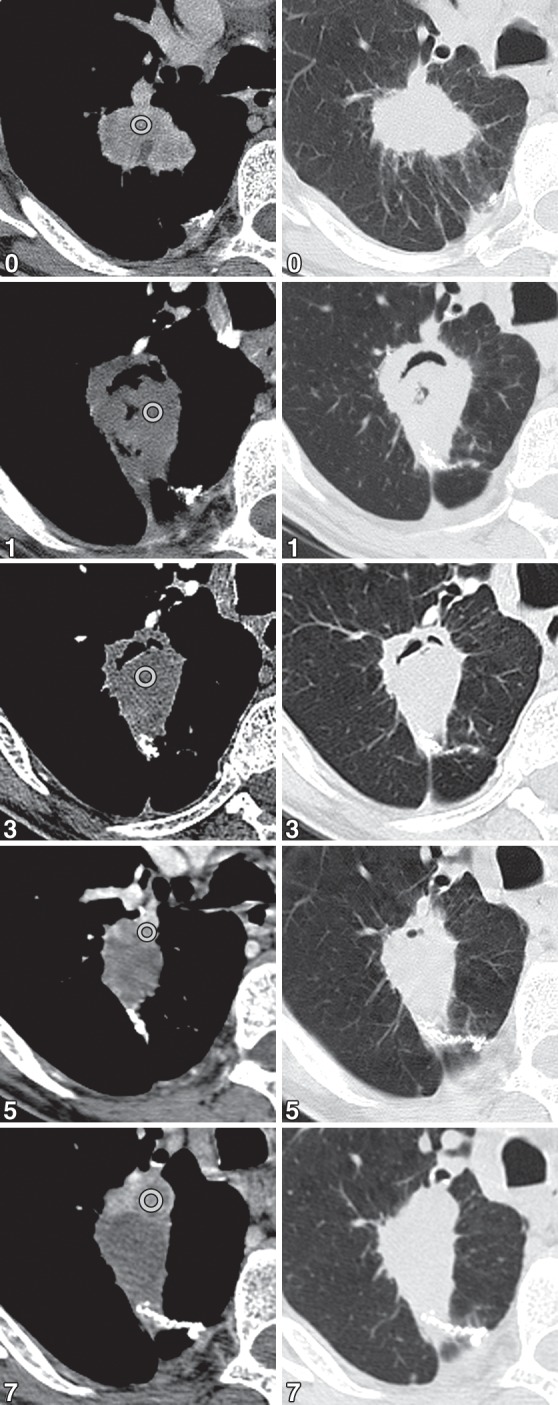
Recurrence after RFA in a 72-year-old woman. (a) Composite series of CT images show the enhancement pattern (left row) and the change in size (right row) with time (numbers = months after RFA). (b) Graph shows the relationship of lesion size and enhancement during the 12-month post-RFA period. The numbers along the red line represent the maximum enhancement before and after contrast material administration, and the numbers along the blue line represent the size of the tumor (before RFA) or the ablation zone. The contrast enhancement (red line) decreases immediately after ablation and remains low until 3 months, with enhancement not exceeding 15 HU. At 5 months, enhancement is increased beyond baseline and is more than 15 HU, a trend that continues at 7 months. Similarly, the lesion size (blue line) continues to increase after the initial reduction at 3 months, a finding suggestive of recurrence.
Figures 14b.

Recurrence after RFA in a 72-year-old woman. (a) Composite series of CT images show the enhancement pattern (left row) and the change in size (right row) with time (numbers = months after RFA). (b) Graph shows the relationship of lesion size and enhancement during the 12-month post-RFA period. The numbers along the red line represent the maximum enhancement before and after contrast material administration, and the numbers along the blue line represent the size of the tumor (before RFA) or the ablation zone. The contrast enhancement (red line) decreases immediately after ablation and remains low until 3 months, with enhancement not exceeding 15 HU. At 5 months, enhancement is increased beyond baseline and is more than 15 HU, a trend that continues at 7 months. Similarly, the lesion size (blue line) continues to increase after the initial reduction at 3 months, a finding suggestive of recurrence.
PET.—On PET images, increased metabolic activity after 2 months, residual activity centrally or at the region of the ablated tumor, or development of nodular activity at the site of the original tumor nodule is suggestive of recurrence (Fig 15).
Figure 15a.

Metastatic renal cell carcinoma in a 68-year-old woman. (a) CT image shows that the medial nodular edge of the metastasis (arrow) is too close to the bronchus and is subject to the heat sink effect. (b) PET/CT image obtained at 3-month surveillance shows a focal area of recurrence (arrowhead).
Figure 15b.

Metastatic renal cell carcinoma in a 68-year-old woman. (a) CT image shows that the medial nodular edge of the metastasis (arrow) is too close to the bronchus and is subject to the heat sink effect. (b) PET/CT image obtained at 3-month surveillance shows a focal area of recurrence (arrowhead).
Patterns of Recurrent Disease
Recurrence after RFA can be local recurrence or can be regional lymph node metastasis or distant metastasis. In a 10-year institutional review of RFA for primary lung carcinoma, Beland et al (59) showed a 43% recurrence rate and a median disease-free survival of 23 months. The most common pattern of recurrence after RFA was local recurrence, followed by intrapulmonary recurrence, local nodal metastasis, and distant metastases (59).
Local nodal metastasis is a pattern of recurrence that is more common with advanced tumor stages (Fig 16). However, reversible local-regional lymph node enlargement is commonly seen after ablation and should be differentiated from nodal metastasis. Sharma et al (60) analyzed sequential imaging findings in 16 patients after RFA and showed an increase in lymph node size after 10 (62.5%) of 16 RFA sessions at 1-month follow-up, with 60% of 10 patients having more than one of the lymph node regions demonstrating enlarged nodes that remained local-regional and not diffuse. Increased nodal FDG uptake can also be seen and has been postulated to be dependent on secondary follicles (61). At follow-up, Sharma et al (60) found that the nodes decreased in size at 3 and 6 months and decreased in metabolic activity by 12 months (Fig 17).
Figure 16a.

Non–small cell lung carcinoma in the left upper lobe in a 73-year-old woman. (a, b) CT images at the level of the ablated mass (a) and at the level of the left lobar lymph nodes (b) obtained at 1 month after RFA show no evidence of local adenopathy. (c, d) CT (c) and PET (d) images obtained at 6-month follow-up show a left lobar well-defined local-regional lymph node (arrow), as well as right paratracheal lymph nodes (arrowheads in d) with hypermetabolic activity, findings that are consistent with metastasis.
Figure 16b.

Non–small cell lung carcinoma in the left upper lobe in a 73-year-old woman. (a, b) CT images at the level of the ablated mass (a) and at the level of the left lobar lymph nodes (b) obtained at 1 month after RFA show no evidence of local adenopathy. (c, d) CT (c) and PET (d) images obtained at 6-month follow-up show a left lobar well-defined local-regional lymph node (arrow), as well as right paratracheal lymph nodes (arrowheads in d) with hypermetabolic activity, findings that are consistent with metastasis.
Figure 16c.
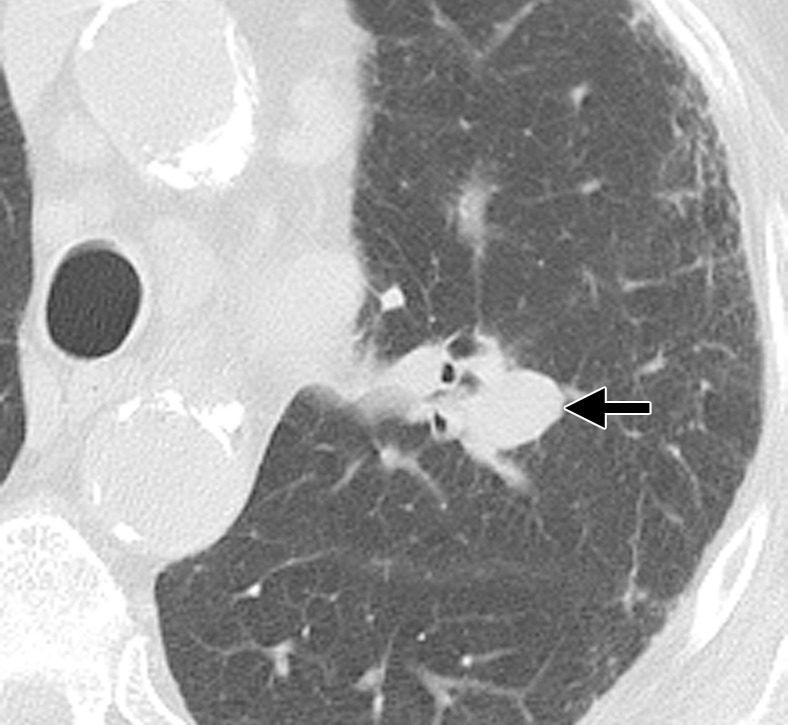
Non–small cell lung carcinoma in the left upper lobe in a 73-year-old woman. (a, b) CT images at the level of the ablated mass (a) and at the level of the left lobar lymph nodes (b) obtained at 1 month after RFA show no evidence of local adenopathy. (c, d) CT (c) and PET (d) images obtained at 6-month follow-up show a left lobar well-defined local-regional lymph node (arrow), as well as right paratracheal lymph nodes (arrowheads in d) with hypermetabolic activity, findings that are consistent with metastasis.
Figure 16d.

Non–small cell lung carcinoma in the left upper lobe in a 73-year-old woman. (a, b) CT images at the level of the ablated mass (a) and at the level of the left lobar lymph nodes (b) obtained at 1 month after RFA show no evidence of local adenopathy. (c, d) CT (c) and PET (d) images obtained at 6-month follow-up show a left lobar well-defined local-regional lymph node (arrow), as well as right paratracheal lymph nodes (arrowheads in d) with hypermetabolic activity, findings that are consistent with metastasis.
Figure 17a.

Squamous cell carcinoma in the right lower lobe in a 72-year-old man treated with RFA, who had postablation fluctuation in a local-regional lymph node. (a) CT image obtained before ablation shows a subcentimeter right tracheobronchial lymph node (arrow). (b, c) CT (b) and PET/CT (c) images obtained 2 weeks after ablation show the postablation cavity (arrowheads) and the enlarged right tracheobronchial lymph node (arrows), both of which demonstrated increased metabolic activity. (d) CT image obtained at 3 months after RFA shows a decrease in the size of the ablation zone (arrowheads) and a decrease in the size of the tracheobronchial lymph node (arrow) compared with the preablation size, findings that helped exclude metastasis.
Figure 17b.

Squamous cell carcinoma in the right lower lobe in a 72-year-old man treated with RFA, who had postablation fluctuation in a local-regional lymph node. (a) CT image obtained before ablation shows a subcentimeter right tracheobronchial lymph node (arrow). (b, c) CT (b) and PET/CT (c) images obtained 2 weeks after ablation show the postablation cavity (arrowheads) and the enlarged right tracheobronchial lymph node (arrows), both of which demonstrated increased metabolic activity. (d) CT image obtained at 3 months after RFA shows a decrease in the size of the ablation zone (arrowheads) and a decrease in the size of the tracheobronchial lymph node (arrow) compared with the preablation size, findings that helped exclude metastasis.
Figure 17c.

Squamous cell carcinoma in the right lower lobe in a 72-year-old man treated with RFA, who had postablation fluctuation in a local-regional lymph node. (a) CT image obtained before ablation shows a subcentimeter right tracheobronchial lymph node (arrow). (b, c) CT (b) and PET/CT (c) images obtained 2 weeks after ablation show the postablation cavity (arrowheads) and the enlarged right tracheobronchial lymph node (arrows), both of which demonstrated increased metabolic activity. (d) CT image obtained at 3 months after RFA shows a decrease in the size of the ablation zone (arrowheads) and a decrease in the size of the tracheobronchial lymph node (arrow) compared with the preablation size, findings that helped exclude metastasis.
Figure 17d.

Squamous cell carcinoma in the right lower lobe in a 72-year-old man treated with RFA, who had postablation fluctuation in a local-regional lymph node. (a) CT image obtained before ablation shows a subcentimeter right tracheobronchial lymph node (arrow). (b, c) CT (b) and PET/CT (c) images obtained 2 weeks after ablation show the postablation cavity (arrowheads) and the enlarged right tracheobronchial lymph node (arrows), both of which demonstrated increased metabolic activity. (d) CT image obtained at 3 months after RFA shows a decrease in the size of the ablation zone (arrowheads) and a decrease in the size of the tracheobronchial lymph node (arrow) compared with the preablation size, findings that helped exclude metastasis.
Distant metastasis can be seen to the lung or distant sites. After ablation, distant metastasis is usually seen within the 1st year and is influenced in part by a higher disease stage and the extent of disease (Fig 18) (59). Chua et al (30) evaluated 148 patients with metastasis to the lung who were treated with RFA and demonstrated that 32% of patients developed recurrence in other parts of the lung and 30% at other distant metastatic sites after ablation.
Figure 18a.

Primary non–small cell lung carcinoma in a 66-year-old man. (a) CT image obtained after RFA shows a linear postablation scar (arrows) in the right lower lobe. (b) PET image shows that the scar is without metabolic activity. (c, d) CT (c) and PET (d) images obtained at the 24-month follow-up depict a new mass (arrow) in the left lobe of the liver, which shows hypermetabolic activity. (e) Photomicrograph (original magnification, ×200; H-E stain) of a histologic section of the specimen from biopsy of the liver lesion shows neoplastic cells (top half) surrounded by chronic inflammatory cells and collagen (bottom half). Inset: Photomicrograph (original magnification, ×400; immunohistochemical stain for TTF-1) of a histologic section of the specimen from biopsy shows that the neoplastic cells (arrowhead) are positive for TTF-1 (brown nuclear staining), a finding that helped confirm their pulmonary origin.
Figure 18b.

Primary non–small cell lung carcinoma in a 66-year-old man. (a) CT image obtained after RFA shows a linear postablation scar (arrows) in the right lower lobe. (b) PET image shows that the scar is without metabolic activity. (c, d) CT (c) and PET (d) images obtained at the 24-month follow-up depict a new mass (arrow) in the left lobe of the liver, which shows hypermetabolic activity. (e) Photomicrograph (original magnification, ×200; H-E stain) of a histologic section of the specimen from biopsy of the liver lesion shows neoplastic cells (top half) surrounded by chronic inflammatory cells and collagen (bottom half). Inset: Photomicrograph (original magnification, ×400; immunohistochemical stain for TTF-1) of a histologic section of the specimen from biopsy shows that the neoplastic cells (arrowhead) are positive for TTF-1 (brown nuclear staining), a finding that helped confirm their pulmonary origin.
Figure 18c.

Primary non–small cell lung carcinoma in a 66-year-old man. (a) CT image obtained after RFA shows a linear postablation scar (arrows) in the right lower lobe. (b) PET image shows that the scar is without metabolic activity. (c, d) CT (c) and PET (d) images obtained at the 24-month follow-up depict a new mass (arrow) in the left lobe of the liver, which shows hypermetabolic activity. (e) Photomicrograph (original magnification, ×200; H-E stain) of a histologic section of the specimen from biopsy of the liver lesion shows neoplastic cells (top half) surrounded by chronic inflammatory cells and collagen (bottom half). Inset: Photomicrograph (original magnification, ×400; immunohistochemical stain for TTF-1) of a histologic section of the specimen from biopsy shows that the neoplastic cells (arrowhead) are positive for TTF-1 (brown nuclear staining), a finding that helped confirm their pulmonary origin.
Figure 18d.

Primary non–small cell lung carcinoma in a 66-year-old man. (a) CT image obtained after RFA shows a linear postablation scar (arrows) in the right lower lobe. (b) PET image shows that the scar is without metabolic activity. (c, d) CT (c) and PET (d) images obtained at the 24-month follow-up depict a new mass (arrow) in the left lobe of the liver, which shows hypermetabolic activity. (e) Photomicrograph (original magnification, ×200; H-E stain) of a histologic section of the specimen from biopsy of the liver lesion shows neoplastic cells (top half) surrounded by chronic inflammatory cells and collagen (bottom half). Inset: Photomicrograph (original magnification, ×400; immunohistochemical stain for TTF-1) of a histologic section of the specimen from biopsy shows that the neoplastic cells (arrowhead) are positive for TTF-1 (brown nuclear staining), a finding that helped confirm their pulmonary origin.
Figure 18e.

Primary non–small cell lung carcinoma in a 66-year-old man. (a) CT image obtained after RFA shows a linear postablation scar (arrows) in the right lower lobe. (b) PET image shows that the scar is without metabolic activity. (c, d) CT (c) and PET (d) images obtained at the 24-month follow-up depict a new mass (arrow) in the left lobe of the liver, which shows hypermetabolic activity. (e) Photomicrograph (original magnification, ×200; H-E stain) of a histologic section of the specimen from biopsy of the liver lesion shows neoplastic cells (top half) surrounded by chronic inflammatory cells and collagen (bottom half). Inset: Photomicrograph (original magnification, ×400; immunohistochemical stain for TTF-1) of a histologic section of the specimen from biopsy shows that the neoplastic cells (arrowhead) are positive for TTF-1 (brown nuclear staining), a finding that helped confirm their pulmonary origin.
In summary, CT and PET imaging features suggestive of residual disease or recurrence of disease include (a) increasing contrast material uptake in the ablation zone (>180 seconds on dynamic images), nodular enhancement measuring more than 10 mm, any central enhancement greater than 15 HU, and contrast enhancement greater than baseline anytime after ablation; (b) growth of the RFA zone after 3 months (compared with baseline) and definitely after 6 months, peripheral nodular growth and change from ground-glass opacity to solid opacity, regional or distant lymph node enlargement, new sites of intrathoracic disease, or new extrathoracic disease; and (c) increased metabolic activity beyond 2 months, residual activity centrally or at the region of the ablated tumor, or development of nodular activity (Table).
CT and PET/CT Imaging Features Suggestive of Residual or Recurrent Tumor after RFA

Conclusions
Reliable imaging surveillance after RFA is essential for the success of the treatment. A firm understanding of the expected and unexpected CT imaging features of the RFA zone is necessary for accurate assessment of the treatment response and early identification of incomplete ablation and local-regional or distant progression of disease. Contrast-enhanced CT, PET, and PET/CT should be used in conjunction as routine follow-up or as problem-solving modalities, especially when CT findings are equivocal. Biopsy should be performed if imaging findings are not definitive. In all cases, diligent and rigorous patient follow-up is required and should be performed.
Recipient of a Certificate of Merit award for an education exhibit at the 2006 RSNA Annual Meeting.
For this journal-based CME activity, the authors, editor, and reviewers have no relevant relationships to disclose.
Funding: The research was supported by the National Institutes of Health [grant number 5M01-RR000827].
Abbreviations:
- FDG
- fluorine 18 fluorodeoxyglucose
- NADH
- nicotinamide adenine dinucleotide,reduced
- RFA
- radiofrequency ablation
- SUV
- standardized uptake value
- TTF-1
- thyroid transcription factor 1
References
- 1.American Cancer Society Cancer facts and figures 2011. American Cancer Society Web site. http://www.cancer.org/Research/CancerFactsFigures/Cancer FactsFigures/cancer-facts-figures-2011. Published 2011. Accessed October 18, 2011 [Google Scholar]
- 2.Davidson RS, Nwogu CE, Brentjens MJ, Anderson TM. The surgical management of pulmonary metastasis: current concepts. Surg Oncol 2001;10(1-2):35–42 [DOI] [PubMed] [Google Scholar]
- 3.Mery CM, Pappas AN, Burt BM, et al. Diameter of non-small cell lung cancer correlates with long-term survival: implications for T stage. Chest 2005;128(5):3255–3260 [DOI] [PubMed] [Google Scholar]
- 4.McGarry RC, Song G, des Rosiers P, Timmerman R. Observation-only management of early stage, medically inoperable lung cancer: poor outcome. Chest 2002;121(4):1155–1158 [DOI] [PubMed] [Google Scholar]
- 5.Kyasa MJ, Jazieh AR. Characteristics and outcomes of patients with unresected early-stage non-small cell lung cancer. South Med J 2002;95(10):1149–1152 [PubMed] [Google Scholar]
- 6.Wisnivesky JP, Bonomi M, Henschke C, Iannuzzi M, McGinn T. Radiation therapy for the treatment of unresected stage I-II non-small cell lung cancer. Chest 2005;128(3):1461–1467 [DOI] [PubMed] [Google Scholar]
- 7.Friedel G, Pastorino U, Buyse M, et al. Resection of lung metastases: long-term results and prognostic analysis based on 5206 cases—the International Registry of Lung Metastases [in German]. Zentralbl Chir 1999;124(2):96–103 [PubMed] [Google Scholar]
- 8.Girard P, Baldeyrou P, Le Chevalier T, Le Cesne A, Brigandi A, Grunenwald D. Surgery for pulmonary metastases: who are the 10-year survivors? Cancer 1994;74(10):2791–2797 [DOI] [PubMed] [Google Scholar]
- 9.Cosman ER, Nashold BS, Ovelman-Levitt J. Theoretical aspects of radiofrequency lesions in the dorsal root entry zone. Neurosurgery 1984;15(6):945–950 [PubMed] [Google Scholar]
- 10.Organ LW. Electrophysiologic principles of radiofrequency lesion making. Appl Neurophysiol 1976-1977;39(2):69–76 [DOI] [PubMed] [Google Scholar]
- 11.Haines DE, Watson DD. Tissue heating during radiofrequency catheter ablation: a thermodynamic model and observations in isolated perfused and superfused canine right ventricular free wall. Pacing Clin Electrophysiol 1989;12(6):962–976 [DOI] [PubMed] [Google Scholar]
- 12.Huang SK. Advances in applications of radiofrequency current to catheter ablation therapy. Pacing Clin Electrophysiol 1991;14(1):28–42 [DOI] [PubMed] [Google Scholar]
- 13.Goldberg SN, Gazelle GS, Compton CC, Mueller PR, Tanabe KK. Treatment of intrahepatic malignancy with radiofrequency ablation: radiologic-pathologic correlation. Cancer 2000;88(11):2452–2463 [PubMed] [Google Scholar]
- 14.Lee JM, Jin GY, Goldberg SN, et al. Percutaneous radiofrequency ablation for inoperable non–small cell lung cancer and metastases: preliminary report. Radiology 2004;230(1):125–134 [DOI] [PubMed] [Google Scholar]
- 15.Yamamoto A, Nakamura K, Matsuoka T, et al. Radiofrequency ablation in a porcine lung model: correlation between CT and histopathologic findings. AJR Am J Roentgenol 2005;185(5):1299–1306 [DOI] [PubMed] [Google Scholar]
- 16.Anderson EM, Lees WR, Gillams AR. Early indicators of treatment success after percutaneous radiofrequency of pulmonary tumors. Cardiovasc Intervent Radiol 2009;32(3):478–483 [DOI] [PubMed] [Google Scholar]
- 17.Giraud P, Antoine M, Larrouy A, et al. Evaluation of microscopic tumor extension in non-small-cell lung cancer for three-dimensional conformal radiotherapy planning. Int J Radiat Oncol Biol Phys 2000;48(4):1015–1024 [DOI] [PubMed] [Google Scholar]
- 18.Goldberg SN, Gazelle GS, Compton CC, McLoud TC. Radiofrequency tissue ablation in the rabbit lung: efficacy and complications. Acad Radiol 1995;2(9):776–784 [DOI] [PubMed] [Google Scholar]
- 19.Gandhi NS, Dupuy DE. Image-guided radiofrequency ablation as a new treatment option for patients with lung cancer. Semin Roentgenol 2005;40(2):171–181 [DOI] [PubMed] [Google Scholar]
- 20.Dupuy DE, Zagoria RJ, Akerley W, Mayo-Smith WW, Kavanagh PV, Safran H. Percutaneous radiofrequency ablation of malignancies in the lung. AJR Am J Roentgenol 2000;174(1):57–59 [DOI] [PubMed] [Google Scholar]
- 21.Nishida T, Inoue K, Kawata Y, et al. Percutaneous radiofrequency ablation of lung neoplasms: a minimally invasive strategy for inoperable patients. J Am Coll Surg 2002;195(3):426–430 [DOI] [PubMed] [Google Scholar]
- 22.Suh RD, Wallace AB, Sheehan RE, Heinze SB, Goldin JG. Unresectable pulmonary malignancies: CT-guided percutaneous radiofrequency ablation—preliminary results. Radiology 2003;229(3):821–829 [DOI] [PubMed] [Google Scholar]
- 23.Herrera LJ, Fernando HC, Perry Y, et al. Radiofrequency ablation of pulmonary malignant tumors in nonsurgical candidates. J Thorac Cardiovasc Surg 2003;125(4):929–937 [DOI] [PubMed] [Google Scholar]
- 24.Dequanter D, Lothaire P. Tumour characteristics and therapeutic results after percutaneous radiofrequency ablation of secondary lung neoplasms. Clin Transl Oncol 2009;11(6):393–395 [DOI] [PubMed] [Google Scholar]
- 25.de Baère T, Palussière J, Aupérin A, et al. Midterm local efficacy and survival after radiofrequency ablation of lung tumors with minimum follow-up of 1 year: prospective evaluation. Radiology 2006;240(2):587–596 [DOI] [PubMed] [Google Scholar]
- 26.Yamakado K, Hase S, Matsuoka T, et al. Radiofrequency ablation for the treatment of unresectable lung metastases in patients with colorectal cancer: a multicenter study in Japan. J Vasc Interv Radiol 2007;18(3):393–398 [DOI] [PubMed] [Google Scholar]
- 27.Yan TD, King J, Sjarif A, Glenn D, Steinke K, Morris DL. Percutaneous radiofrequency ablation of pulmonary metastases from colorectal carcinoma: prognostic determinants for survival. Ann Surg Oncol 2006;13(11):1529–1537 [DOI] [PubMed] [Google Scholar]
- 28.Lencioni R, Crocetti L, Cioni R, et al. Response to radiofrequency ablation of pulmonary tumours: a prospective, intention-to-treat, multicentre clinical trial (the RAPTURE study). Lancet Oncol 2008;9(7):621–628 [DOI] [PubMed] [Google Scholar]
- 29.Simon CJ, Dupuy DE, DiPetrillo TA, et al. Pul-monary radiofrequency ablation: long-term safety and efficacy in 153 patients. Radiology 2007;243(1):268–275 [DOI] [PubMed] [Google Scholar]
- 30.Chua TC, Sarkar A, Saxena A, Glenn D, Zhao J, Morris DL. Long-term outcome of image-guided percutaneous radiofrequency ablation of lung metastases: an open-labeled prospective trial of 148 patients. Ann Oncol 2010;21(10):2017–2022 [DOI] [PubMed] [Google Scholar]
- 31.Huang L, Han Y, Zhao J, et al. Is radiofrequency thermal ablation a safe and effective procedure in the treatment of pulmonary malignancies? Eur J Cardiothorac Surg 2011;39(3):348–351 [DOI] [PubMed] [Google Scholar]
- 32.Yan TD, King J, Sjarif A, et al. Treatment failure after percutaneous radiofrequency ablation for nonsurgical candidates with pulmonary metastases from colorectal carcinoma. Ann Surg Oncol 2007;14(5):1718–1726 [DOI] [PubMed] [Google Scholar]
- 33.Hiraki T, Sakurai J, Tsuda T, et al. Risk factors for local progression after percutaneous radiofrequency ablation of lung tumors: evaluation based on a preliminary review of 342 tumors. Cancer 2006;107(12):2873–2880 [DOI] [PubMed] [Google Scholar]
- 34.Gillams AR, Lees WR. Radiofrequency ablation of lung metastases: factors influencing success. Eur Radiol 2008;18(4):672–677 [DOI] [PubMed] [Google Scholar]
- 35.Nolsoe CP, Torp-Pedersen S, Horn T, Larsen LG, Lorentzen T, Holm HH. US-guided interstitial laser tissue ablation: “ghost cells” imply a risk of misinterpretation at follow-up biopsy [abstr]. Radiology 1995;197(P):178 [Google Scholar]
- 36.Miao Y, Ni Y, Bosmans H, et al. Radiofrequency ablation for eradication of pulmonary tumor in rabbits. J Surg Res 2001;99(2):265–271 [DOI] [PubMed] [Google Scholar]
- 37.Goldberg SN, Grassi CJ, Cardella JF, et al. Image-guided tumor ablation: standardization of terminology and reporting criteria. J Vasc Interv Radiol 2009;20(7 suppl):S377–S390 [DOI] [PubMed] [Google Scholar]
- 38.Hiraki T, Tajiri N, Mimura H, et al. Pneumothorax, pleural effusion, and chest tube placement after radiofrequency ablation of lung tumors: incidence and risk factors. Radiology 2006;241(1):275–283 [DOI] [PubMed] [Google Scholar]
- 39.Gadaleta C, Mattioli V, Colucci G, et al. Radiofre-quency ablation of 40 lung neoplasms: preliminary results. AJR Am J Roentgenol 2004;183(2):361–368 [DOI] [PubMed] [Google Scholar]
- 40.Belfiore G, Moggio G, Tedeschi E, et al. CT-guided radiofrequency ablation: a potential complementary therapy for patients with unresectable primary lung cancer—a preliminary report of 33 patients. AJR Am J Roentgenol 2004;183(4):1003–1011 [DOI] [PubMed] [Google Scholar]
- 41.Steinke K, Glenn D, King J, et al. Percutaneous imaging-guided radiofrequency ablation in patients with colorectal pulmonary metastases: 1-year follow-up. Ann Surg Oncol 2004;11(2):207–212 [DOI] [PubMed] [Google Scholar]
- 42.Kang S, Luo R, Liao W, Wu H, Zhang X, Meng Y. Single group study to evaluate the feasibility and complications of radiofrequency ablation and usefulness of post treatment position emission tomography in lung tumours. World J Surg Oncol 2004;2:30 doi:10.1186/1477-7819-2-30. Published September 6, 2004. Accessed October 18, 2011 [DOI] [PMC free article] [PubMed] [Google Scholar]
- 43.Yasui K, Kanazawa S, Sano Y, et al. Thoracic tumors treated with CT-guided radiofrequency ablation: initial experience. Radiology 2004;231(3):850–857 [DOI] [PubMed] [Google Scholar]
- 44.Akeboshi M, Yamakado K, Nakatsuka A, et al. Percutaneous radiofrequency ablation of lung neoplasms: initial therapeutic response. J Vasc Interv Radiol 2004;15(5):463–470 [DOI] [PubMed] [Google Scholar]
- 45.Fernando HC, De Hoyos A, Landreneau RJ, et al. Radiofrequency ablation for the treatment of non-small cell lung cancer in marginal surgical candidates. J Thorac Cardiovasc Surg 2005;129(3):639–644 [DOI] [PubMed] [Google Scholar]
- 46.vanSonnenberg E, Shankar S, Morrison PR, et al. Radiofrequency ablation of thoracic lesions. II. Initial clinical experience—technical and multidisciplinary considerations in 30 patients. AJR Am J Roentgenol 2005;184(2):381–390 [DOI] [PubMed] [Google Scholar]
- 47.Steinke K, King J, Glenn D, Morris DL. Radiologic appearance and complications of percutaneous computed tomography-guided radiofrequency-ablated pulmonary metastases from colorectal carcinoma. J Comput Assist Tomogr 2003;27(5):750–757 [DOI] [PubMed] [Google Scholar]
- 48.Bojarski JD, Dupuy DE, Mayo-Smith WW. CT imaging findings of pulmonary neoplasms after treatment with radiofrequency ablation: results in 32 tumors. AJR Am J Roentgenol 2005;185(2):466–471 [DOI] [PubMed] [Google Scholar]
- 49.Sakurai J, Hiraki T, Mukai T, et al. Intractable pneumothorax due to bronchopleural fistula after radiofrequency ablation of lung tumors. J Vasc Interv Radiol 2007;18(1 pt 1):141–145 [DOI] [PubMed] [Google Scholar]
- 50.Swensen SJ, Viggiano RW, Midthun DE, et al. Lung nodule enhancement at CT: multicenter study. Radiology 2000;214(1):73–80 [DOI] [PubMed] [Google Scholar]
- 51.Giannopoulou C. The role of SPET and PET in monitoring tumour response to therapy. Eur J Nucl Med Mol Imaging 2003;30(8):1173–1200 [DOI] [PubMed] [Google Scholar]
- 52.Kostakoglu L, Goldsmith SJ. 18F-FDG PET evaluation of the response to therapy for lymphoma and for breast, lung, and colorectal carcinoma. J Nucl Med 2003;44(2):224–239 [PubMed] [Google Scholar]
- 53.Kubota K, Itoh M, Ozaki K, et al. Advantage of delayed whole-body FDG-PET imaging for tumour detection. Eur J Nucl Med 2001;28(6):696–703 [DOI] [PubMed] [Google Scholar]
- 54.Okuma T, Okamura T, Matsuoka T, et al. Fluorine-18-fluorodeoxyglucose positron emission tomography for assessment of patients with unresectable recurrent or metastatic lung cancers after CT-guided radiofrequency ablation: preliminary results. Ann Nucl Med 2006;20(2):115–121 [DOI] [PubMed] [Google Scholar]
- 55.Higaki F, Okumura Y, Sato S, et al. Preliminary retrospective investigation of FDG-PET/CT timing in follow-up of ablated lung tumor. Ann Nucl Med 2008;22(3):157–163 [DOI] [PubMed] [Google Scholar]
- 56.Oyama Y, Nakamura K, Matsuoka T, et al. Radiofrequency ablated lesion in the normal porcine lung: long-term follow-up with MRI and pathology. Cardiovasc Intervent Radiol 2005;28(3):346–353 [DOI] [PubMed] [Google Scholar]
- 57.Okuma T, Matsuoka T, Yamamoto A, Hamamoto S, Nakamura K, Inoue Y. Assessment of early treatment response after CT-guided radiofrequency ablation of unresectable lung tumours by diffusion-weighted MRI: a pilot study. Br J Radiol 2009;82(984):989–994 [DOI] [PMC free article] [PubMed] [Google Scholar]
- 58.Singnurkar A, Solomon SB, Gönen M, Larson SM, Schöder H. 18F-FDG PET/CT for the prediction and detection of local recurrence after radiofrequency ablation of malignant lung lesions. J Nucl Med 2010;51(12):1833–1840 [DOI] [PubMed] [Google Scholar]
- 59.Beland MD, Wasser EJ, Mayo-Smith WW, Dupuy DE. Primary non–small cell lung cancer: review of frequency, location, and time of recurrence after radio frequency ablation. Radiology 2010;254(1):301–307 [DOI] [PubMed] [Google Scholar]
- 60.Sharma A, Digumarthy SR, Kalra MK, Lanuti M, Shepard JA. Reversible locoregional lymph node enlargement after radiofrequency ablation of lung tumors. AJR Am J Roentgenol 2010;194(5):1250–1256 [DOI] [PubMed] [Google Scholar]
- 61.Nakagawa T, Yamada M, Suzuki Y. 18F-FDG uptake in reactive neck lymph nodes of oral cancer: relationship to lymphoid follicles. J Nucl Med 2008;49(7):1053–1059 [DOI] [PubMed] [Google Scholar]