

Abstract
Background: P‐wave indices, an electrocardiographic phenotype reflecting atrial electrophysiology and morphology, may be altered in multiple disease states or by cardiovascular risk factors. Reference values for P‐wave indices, providing cut points for their classification and interpretation, have not yet been established and are essential toward facilitating clinical application and comparison between studies.
Methods: We randomly selected 20 men and 20 women from 10‐year age intervals between <25 years to 76–85 years from the Framingham Heart Study Original and Offspring Cohorts, excluding subjects with prevalent cardiovascular disease, hypertension, diabetes or obesity. The total included 295 subjects; eligibility in women >75 years was limited by exclusion criteria. We used a digital measurement technique with demonstrated intrarater reproducibility to determine P‐wave indices. P‐wave indices examined included the maximum, mean, lead II and PR durations, dispersion, and the standard deviation of duration.
Results: All P‐wave indices were significantly (P < 0.0001) correlated with advancing age. Means of all P‐wave indices were lower in women as compared to men. PR‐interval duration was strongly correlated with maximum, mean, and lead II mean P‐wave durations. In multivariable models adjusting for significant anthropometric and clinical associations risk factors, significant differences persisted by age and sex in P‐wave indices.
Conclusions. In our healthy sample without cardiovascular disease, hypertension, diabetes, or obesity, men and older subjects had longer mean P‐wave indices. Our description of P‐wave indices establishes reference values for future comparative studies and facilitates the classification of P‐wave indices.
Ann Noninvasive Electrocardiol 2010;15(4):344‐352
Keywords: electrocardiogram, P waves, epidemiology, reference values
P‐wave indices constitute an intermediate phenotype reflecting the impact of ischemic, metabolic, and inflammatory insults on atrial electrophysiology and morphology. Measured from the surface electrocardiogram (ECG), they reflect dimensions of atrial depolarization and are modified by conditions that alter atrial conduction, atrial refractoriness, or may result in a proarrhythmic substrate. The P‐wave indices of duration and dispersion have most commonly been measured. An array of studies have utilized these P‐wave indices to distinguish subjects with diverse cardiovascular and noncardiovascular conditions and diseases from healthy reference groups. 1 Computerized software has more recently facilitated measurement of P‐wave indices reflecting atrial area and terminal force.
The range of P‐wave indices has had considerable variability in the literature, limiting the establishment of reference values. For example, the largest (n = 15,429) identified study to date utilized digitized ECGs and computer software to report a maximum P‐wave duration of 112.3 ± 12.3 milliseconds in African‐American and 107.0 ± 12.2 milliseconds in white subjects in a middle‐aged cohort (mean age 54.2 ± 5.8 years). 2 A younger cohort (mean age 24 years) of army recruits reported a maximum P‐wave duration of 96 ms. 3 In other samples, assessment of P‐wave duration in referent groups has been similarly variable. 1 Using cut‐points of a normal P‐wave duration as <120 ms, studies have reported 41% 4 to 47% 5 of hospitalized patients as having prolonged measurements.
Consequently, we undertook this study to define reference values of P‐wave indices in the Framingham Heart Study (FHS). We had two major objectives for the study. First, we sought to examine our hypothesis that reference P‐wave indices would vary between men and women, and would increase with advanced age. Second, we sought to identify the clinical correlates associated with P‐wave indices in the reference range. We calculated P‐wave indices in a healthy referent cohort identified as a subset within the FHS and without prevalent atrial fibrillation (AF), cardiovascular disease or select cardiovascular risk factors such as hypertension, diabetes, and obesity. For our measures of interest, we identified the maximum and mean P‐wave durations; mean duration in lead II; P‐wave dispersion, calculated as the difference between maximum and minimum duration between two leads; standard deviation of mean duration; and the PR interval from a prior assessment. 6
METHODS
Participants
FHS is a prospective community‐based study that was undertaken in 1948 to examine risk factors for cardiovascular disease. 7 , 8 Initial enrollment consisted in 5209 participants (Original Cohort) followed in the 1970s by recruitment of 5124 of their offspring and spouses (Offspring Cohort). Examinations occur every 2 years for the Original Cohort and every 4–8 years for the Offspring Cohort. The current investigation used study participants from the Original Cohort's 11th biennial examination (1968–1971) and the Offspring Cohort's first examination (1971–1975) that consisted in a combined total of 8079 subjects. In this study, we selected, at random, subjects without prevalent AF, a paced rhythm, or technically inadequate ECG tracings. Exclusion criteria definitions included 1. a history of cardiovascular disease, including heart failure, myocardial infarction and stroke, adjudicated by a panel of three investigators; 9 , 10 , 11 , 12 2. hypertension, defined as systolic blood pressure ≥140 mmHg, or diastolic blood pressure ≥90 mmHg or antihypertensive medication use; 3. diabetes, defined as fasting blood glucose ≥126 mg/dL or use of insulin or oral hypoglycemic agents; and 4. obesity, defined as body mass index (BMI) ≥30 kg/m2. Moderate‐to‐heavy alcohol consumption was defined as > 7 or 14 drinks/week for women and men, respectively.
We sought to obtain measurements of the selected P‐wave indices on at least 20 men and 20 women in each age group from age <25 years to 76–85 years. Due to limited eligibility in the upper‐age deciles given the exclusion criteria, we ultimately included 295 subjects for measurement. All FHS subjects provided written, informed consent and the FHS examination is approved by the Boston University Medical Center Institutional Review Board.
Measurement Protocol
The measurement protocol is described elsewhere. 13 Subjects participating in the Original Cohort 11th biennial visit or Offspring Cohort initial visit underwent a single channel ECG (Hewlett‐Packard, Palo Alto, CA, USA) recorded on lined paper at 25 mm/s and 0.1 mV/mm, as previously described, 14 which was converted to tagged image format. Measurements were made with modified, commercially available software 15 , 16 (Rigel version 1.7.4, AMPS, New York, NY, USA; http://www.amps-llc.com). In prior analyses, we determined the intrarater intraclass correlation coefficient as r = 0.80 for maximum P‐wave duration and r = 0.82 for P‐wave dispersion. 13 Measurements were performed by a single individual (JWM) to maintain a consistent level of reproducibility and quality control.
Definitions
We measured P‐wave duration in all 12 leads or as many leads as possible with legible P‐wave onset and end. We then calculated the maximum P‐wave duration in any of the measured leads; the mean duration from the measured leads; and the mean duration in lead II. Means were calculated by summing all P waves measured in an individual lead (up to 3) and dividing by the number of measurements made in that lead. P‐wave dispersion was calculated as the difference between the mean maximum and minimum P‐wave durations. Our assessment of P‐wave indices was limited by our measurement tool. We consequently could not record P‐wave area, and did not record dimensions of amplitude or terminal force. PR‐interval measurement in lead II was measured independently by other investigators as described elsewhere. 6
Statistical Analysis
Descriptive statistics were produced for the study sample. These included means and standard deviations for continuous variables and percentages for categorical variables. P wave maximum, mean, dispersion, and PR interval were treated as continuous variables. The standard deviation for P‐wave duration was obtained using mean P‐wave durations for each subject's measured leads. The associations between P‐wave indices, considered separately, and anthropometric and clinical variables, adjusted for age and sex, were estimated by multiple linear regression analysis. Anthropometric and clinical variables that were significant at the P < 0.10 level in age‐ and sex‐adjusted models were considered simultaneously in a multivariable model. Age and sex were forced into the model. Analyses were performed on the total sample and then stratified by sex. All analyses were done using SAS 9.1 (SAS Institute Inc., Cary, NC, USA). Statistical significance was determined as a 2‐sided P value <0.05.
RESULTS
Study Subjects
Of the total sample of 295 subjects, 133 (45.1%) had all 12 ECG leads measured. Baseline noise or artifact resulted in 91 (30.9%) subjects missing 1 lead, 40 (13.6%) missing 2 leads, and 31 (10.5%) missing at least 3 leads. The characteristics of the 295 subjects included in the sample are described by Table 1. The sample had a high prevalence of smoking (41%).
Table 1.
Characteristics of the Study Sample
| Total Sample (n = 295) | Men (n = 152) | Women (n = 143) | |
|---|---|---|---|
| Clinical Characteristics | |||
| Age, year | 49.9 (19.2) | 50.9 (19.5) | 48.7 (19) |
| Smoking,% | 41% | 54% | 28% |
| Alcohol consumption, drinks per week | 6.3 (8.0) | 8.9 (9.6) | 3.7 (4.6) |
| Moderate‐to‐heavy alcohol consumers | 18% | 20% | 16% |
| Body mass index, kg/m2 | 24.0 (3.0) | 24.7 (2.8) | 23.2 (3.0) |
| Systolic blood pressure, mmHg | 119 (11) | 121 (11) | 117 (11) |
| Diastolic blood pressure, mmHg | 74 (8) | 75 (8) | 74 (8) |
| Total/high‐density lipoprotein cholesterol ratio | 4.2 (1.4) | 4.7 (1.4) | 3.8 (1.3) |
| Triglycerides, mg/dL | 283 (186,421) | 307 (214,446) | 243 (159,388) |
| Heart Rate, bpm | 75 (13) | 71 (12) | 79 (13) |
| PR interval, milliseconds | 160 (20) | 161 (20) | 158 (19) |
| P‐wave Indices | |||
| Maximum P‐wave duration, milliseconds | 103 (94,110) | 105 (96,112) | 100 (91, 107) |
| Mean P‐wave duration, milliseconds | 66 (59, 72) | 68 (60,73) | 65 (59, 72) |
| P‐wave duration in lead II | 96 (86, 106) | 99 (90,108) | 94 (84,42) |
| P‐wave dispersion, milliseconds** | 34 (28,43) | 36 (28,45) | 34 (27,42) |
| P‐wave duration standard deviation, milliseconds | 11 (9,13) | 12 (9,14) | 10 (9,13) |
Clinical characteristics are means (SD) or proportions; Triglycerides and P wave indices are median (25th percentile, 75th percentile)
**P‐wave dispersion determined by calculating the difference between maximum and minimum P‐wave duration.
In Table 2, the unadjusted median maximum, mean, and lead II P‐wave duration were longer for men than women in all but one 10‐year age group (56–65 years). Figure 1A graphically displays the distribution of maximum P‐wave durations in men and women by age group, and Figure 1B displays the same distributions for P‐wave dispersion.
Table 2.
P‐wave Indices Reference Value Distributions by Sex and Age.*
| Maximum P Wave, milliseconds | Mean P Wave, milliseconds | Mean P‐wave Duration, Lead II, milliseconds | P‐wave Dispersion, milliseconds | Standard Deviation P Wave, milliseconds | PR Interval, milliseconds | ||
|---|---|---|---|---|---|---|---|
| <25 years | Men (n = 20) | 95 (88,100) | 81 (75,90) | 87 (80, 96) | 27 (19,35) | 9 (6,11) | 160 (160,160) |
| Women (n = 20) | 93 (87, 102) | 80 (75,85) | 84 (78,90) | 31 (28,38) | 10 (8,11) | 160 (140,160) | |
| 26–35 years | Men (n = 20) | 99 (92,110) | 84 (78,89) | 96 (86,107) | 31 (25,43) | 9 (8,12) | 160 (160,160) |
| Women (n = 20) | 95 (84,103) | 80 (74,86) | 92 (83,102) | 32 (23,42) | 9 (8,13) | 160 (140,160) | |
| 36–45 years | Men (n = 20) | 96 (92,105) | 83 (78,87) | 93 (91,98) | 31 (26.4,39.5) | 10 (8,12) | 160 (150,160) |
| Women (n = 20) | 94 (89,99) | 78 (74,83) | 88 (81,94) | 30.7 (24.3,33.5) | 9 (8,10) | 160 (140,160) | |
| 46–55 years | Men (n = 23) | 106 (103, 111) | 90 (87,95) | 99 (90, 107) | 37.0 (31.3,43.0) | 13 (11,14) | 160 (160,160) |
| Women (n = 20) | 99 (93,112) | 84 (81,89) | 94 (88,105) | 31.3 (24.5,46.5) | 10 (8,13) | 160 (150,160) | |
| 56–65 years | Men (n = 24) | 104 (96,114) | 87 (85,93) | 99 (94,111) | 36.5 (27.2,45.5) | 12 (9,15) | 160 (160,170) |
| Women (n = 24) | 105 (99,110) | 89 (86,91) | 100 (90,108) | 34.3 (29.8,42.2) | 11 (9,13) | 160 (160,170) | |
| 66–75 years | Men (n = 24) | 110 (104,114) | 91 (87,93) | 104 (85,108) | 37.7 (31.6,44.0) | 12 (10,14) | 160 (155,160) |
| Women (n = 23) | 105 (98,113) | 87 (83,92) | 102 (90,113) | 37.0 (32.6,42.3) | 12 (10,16) | 160 (140,180) | |
| 76–85 years | Men (n = 22) | 110 (109,114) | 89 (84,94) | 108 (102,110) | 46.7 (41.0,50.5) | 15 (13,16) | 180 (160,180) |
| Women (n = 17) | 105 (102,111) | 88 (83,89) | 102 (92,106) | 40.0 (33.7,47.0) | 13 (12,14) | 160 (160,180) |
*Values are median (25th Percentile, 75th Percentile).
Figure 1.
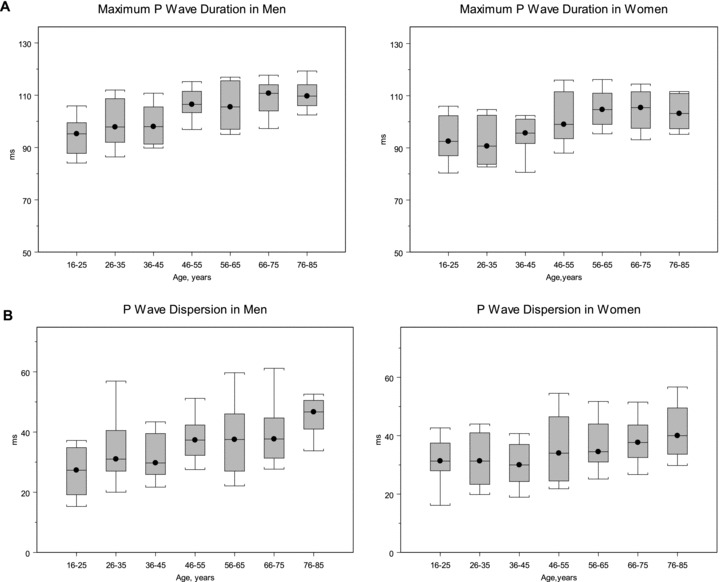
Maximum P‐wave duration (A) and dispersion (B) in men and women, showing the distribution according to age decile. Values shown are the median, 25th and 75th percentile, and the range from the 90th and 10th percentile. The number of subjects per each progressive 10‐year age group was 20, 20, 20, 23, 24, 24, and 22 for men, and 20, 20, 20, 20, 24, 23, and 17 for women.
The age‐ and sex‐adjusted regression coefficients for the 6 P‐wave indices and the clinical variables are shown in Table 3. All P‐wave indices were significantly (P < 0.0001) correlated with advancing age. All P‐wave indices had significantly lower mean values in women. The association between BMI and the various P‐wave indices was unexpectedly variable and only achieved statistical significance with P‐wave standard deviation (β=−0.47, P = 0.02). Heart rate was negatively correlated with all P‐wave indices and reached statistical significance (P < 0.05) in all but P‐wave dispersion. PR duration was strongly associated with maximum P wave (β= 2.33), mean P wave (β= 1.68), and mean duration in lead II (β= 2.91).
Table 3.
Age‐ and Sex‐Adjusted Coefficients of P‐wave Indices with Anthropometric and Clinical Variables.*
| Maximum P Wave, milliseconds | Mean P Wave, milliseconds | Mean P‐wave Duration, Lead II, milliseconds | P‐wave Dispersion, milliseconds | Standard deviation P Wave, milliseconds | PR Interval, milliseconds | |||||||
|---|---|---|---|---|---|---|---|---|---|---|---|---|
| Regression Coefficient | P Value | Regression Coefficient | P Value | Regression Coefficient | P Value | Regression Coefficient | P Value | Regression Coefficient | P Value | Regression Coefficient | P Value | |
| Age (10 year) | 2.64 | <0.0001 | 1.63 | <0.0001 | 2.59 | <0.0001 | 2.03 | <0.0001 | 0.74 | <0.0001 | 2.28 | <0.0001 |
| Female sex | −3.70 | <0.0001 | −3.01 | <0.0001 | −3.39 | 0.02 | −1.82 | 0.17 | −0.76 | 0.06 | −5.69 | 0.01 |
| Smoking | −1.42 | 0.24 | −1.24 | 0.17 | −0.50 | 0.74 | −0.18 | 0.90 | 0.06 | 0.89 | −1.38 | 0.56 |
| Moderate–to‐heavy alcohol use | 0.03 | 0.98 | 0.89 | 0.43 | 0.31 | 0.87 | −1.02 | 0.55 | −0.36 | 0.49 | −4.69 | 0.11 |
| Body mass index (3 kg/m2) | −0.32 | 0.58 | 0.23 | 0.61 | −0.88 | 0.22 | −1.20 | 0.08 | −0.47 | 0.02 | 1.73 | 0.14 |
| Systolic blood pressure (10 mmHg) | −0.99 | 0.08 | −0.93 | 0.03 | −0.42 | 0.55 | 0.18 | 0.78 | 0.09 | 0.64 | −1.55 | 0.17 |
| Diastolic blood pressure (10 mmHg) | −0.27 | 0.71 | 0.12 | 0.82 | −0.32 | 0.72 | −0.09 | 0.91 | −0.04 | 0.87 | −0.10 | 0.95 |
| Total/HDL cholesterol ratio (2 units) | −0.76 | 0.41 | −0.31 | 0.65 | 0.13 | 0.91 | −0.81 | 0.44 | −0.30 | 0.35 | 1.00 | 0.57 |
| Triglycerides (50 mg/dL) | 0.00 | 0.26 | 0.00 | 0.53 | 0.00 | 0.58 | −0.01 | 0.17 | 0.00 | 0.51 | 0.00 | 0.79 |
| Heart rate (13 bpm) | −1.83 | <0.0001 | −1.16 | 0.01 | −1.97 | 0.01 | −1.24 | 0.08 | −0.46 | 0.03 | −3.77 | <0.0001 |
| PR interval (20 milliseconds) | 2.33 | <0.0001 | 1.68 | <0.0001 | 2.91 | <0.0001 | 1.00 | 0.14 | 0.30 | 0.15 | – | – |
*Values are age‐ and sex‐adjusted beta regression coefficients and P values for PR, Maximum, Mean, Lead II, and Minimum P‐wave duration, and P‐wave dispersion and anthropometric, clinical, and laboratory variables.
Values in parenthesis are a standard deviation change for continuous variables (see Table 1).
Multivariable models were developed for each of the P‐wave indices, incorporating the anthropometric and clinical associations that were significant in age‐ and sex‐adjusted models. The multivariable models included age, female sex, BMI, systolic blood pressure, and heart rate as presented in Table 4. Age was significantly associated with all six of the P‐wave indices, with the strongest association in maximum P‐wave duration (β= 2.70), mean P‐wave duration in lead II (β= 2.51), PR interval (β= 2.34), and P‐wave dispersion (β= 1.89). Female sex continued to be negatively associated with all P‐wave indices in the multivariable analysis, particularly with PR interval (β=−3.42), maximum P‐wave duration (β=−3.13), mean duration in lead II (β=−2.73), and mean P‐wave duration (β=−2.58). BMI had mixed negative and positive associations, ranging from β=−1.45 for P‐wave dispersion to β= 1.62 for PR interval. Heart rate had a significantly negative association with all six P wave indices.
Table 4.
Multivariable‐adjusted Clinical Correlates of P‐wave Indices.*
| Maximum P Wave, milliseconds | Mean P Wave, milliseconds | Mean P‐wave Duration, Lead II, milliseconds | P‐wave Dispersion, milliseconds | Standard Deviation P Wave, milliseconds | PR Interval, milliseconds | |||||||
|---|---|---|---|---|---|---|---|---|---|---|---|---|
| β‐Coefficient (SE) | P Value | β‐Coefficient (SE) | P Value | β‐Coefficient (SE) | P Value | β‐Coefficient (SE) | P Value | β‐Coefficient (SE) | P Value | β‐Coefficient (SE) | P Value | |
| Age (10 years)** | 2.70 | <0.0001 | 1.73 | <0.0001 | 2.51 | <0.0001 | 1.89 | <0.0001 | 0.67 | <0.0001 | 2.34 | <0.0001 |
| Female sex | −3.13 | 0.01 | −2.58 | 0.01 | −2.73 | 0.07 | −1.52 | 0.29 | −0.65 | 0.13 | −3.42 | 0.16 |
| Body mass index (3 units) | −0.38 | 0.52 | 0.27 | 0.55 | −1.10 | 0.13 | −1.45 | 0.04 | −0.58 | 0.01 | 1.62 | 0.17 |
| Systolic blood pressure (10 mmHg) | −0.70 | 0.23 | −0.84 | 0.05 | 0.07 | 0.93 | 0.62 | 0.36 | 0.26 | 0.20 | −1.36 | 0.23 |
| Heart rate (13 bpm) | −1.76 | <0.0001 | −1.00 | 0.03 | −2.10 | 0.01 | −1.49 | 0.04 | −0.56 | 0.01 | −3.38 | 0.01 |
*Values are from multivariable models with anthropometric and clinical values as predictor values and P‐wave indices as response variables. Values shown are for variables retained in the model, determined by their significant association with any of the P‐wave indices (P ≤ 0.10) in age‐ and sex‐adjusted analysis. Age and sex were forced into these models.
**Values in parenthesis are a standard deviation change for continuous variables.
As only 133 of 295 (45.1%) of subjects had measurements available from all 12 ECG leads, we examined the differences in demographic (sex, age) and anthropometric (BMI) variables between subjects without and with missing leads (Table S1). There was no statistically significant difference in the distribution of missing leads by sex (chi‐square = 0.66, P = 0.42). Subjects without missing leads were significantly younger than those with missing leads (mean age 46.6 ± 19.9 vs 52.5 ± 18.3 years, P < 0.01). BMI was not statistically different between those without and with missing leads (23.5 ± 2.9 vs 24.0 ± 2.8, P = 0.97).
DISCUSSION
This study determined reference values for P‐wave indices in a community‐based sample representing men and women spanning from young adulthood to advanced age. Reference values are a critical component for determining the distribution of an ordinal measurement by establishing cut‐points for normal‐range values. 17 Reference values establish a measure of quality control by facilitating identification of outliers and quantifying the extent of outliers’ deviation from population‐based values. 18 In the case of P‐wave indices, reference values are an essential benchmark for evaluating the impact of disease states and cardiovascular risk factors on this phenotype. In published studies, P‐wave indices have been examined in a range of clinical contexts. To our knowledge, there has not been an assessment of reference values in a reference cohort. Hence, in our investigation, we sought to quantify these measurements in a healthy cohort without evident cardiovascular disease.
Our study made several important observations. First, in our sample mean P‐wave indices were greater for men than women. The variation by sex was observed in descriptive statistics and confirmed in multivariable models adjusted for age, BMI, systolic blood pressure, and heart rate. Our results are consistent with a large, multicenter study that identified that the mean distributions of PR intervals were longer in men compared to women. 19
Second, in the multivariable model, age was significantly associated with prolonged duration for each of the indices. In selected referral samples from the invasive electrophysiologic study prolongation of atrial conduction, delayed conduction, and prolonged sinus node recovery time has been demonstrated in older (≥ 60 years) compared to younger age groups. 20 Such prolongation is distinguished on the surface ECG by prolonged P‐wave indices and likely results from the development of atrial fibrosis that occurs with aging 21 and predisposes to atrial fibrillation. 22 The associations between advancing age and P‐wave duration 23 and morphology 24 have been similarly demonstrated by signal‐averaged ECG in healthy subjects.
In our study, BMI's correlation with P‐wave indices varied and was only statistically significantly associated with the standard deviation of P‐wave measurements. Our cohort was selected by definition as lacking obesity and hence the mean BMI for both men and women was constrained, limiting power to demonstrate an association. We observed a high prevalence of smoking within our sample, 54% among men and 28% among women. In animal models, tobacco exposure has resulted in fibrosis of cardiac tissue. 25 Larger cohorts may test the relation between tobacco exposures and P‐wave indices.
Strengths and Limitations
Strengths of our study include a community‐based sample with a broad age distribution that has undergone a comprehensive, longitudinal assessment for cardiovascular disease, and risk factors. We determined P‐wave indices in a healthy sample free of cardiovascular disease and without hypertension, diabetes, or obesity, all of which have been demonstrated to be associated with P‐wave indices. 26 , 27 , 28 , 29
Our study has several important limitations. First, our tracings were single channel and their quality suffered from baseline noise. Only 133 (45.1%) of 295 subjects had all 12 ECG leads available for measurement. We observed that individuals with missing leads were significantly older than those without missing leads. We acknowledge that missing leads due to excessive noise may have impaired identifying longest or shortest P waves and, in turn, altered the calculation of P‐wave dispersion. Such a limitation may limit the generalizability of our findings in older subjects. It also suggests that techniques that mitigate baseline noise, such as signal‐averaging, may provide greater accuracy for ECG quantification in older subjects.
Lead noise may also have resulted in mismeasurement due to poor identification of P‐wave onset and end. However, we have demonstrated our technique has strong intrarater quality control, 13 and we took advantage of this by having a single individual perform all measurements for the current investigation. Nevertheless, our study would be improved by use of the automated software measurement technique that we anticipate will rapidly develop as the standard for conducting epidemiologic investigation of P‐wave indices. 2 Such an instrument would allow us to derive a broader array of P‐wave indices reflecting amplitude and area. Participants in our study were adults of European descent; more diverse cohorts are necessary for establishing reference values for P‐wave indices for other races and ethnicities. Our study included 295 subjects total; a larger sample size would improve power to demonstrate clinical associations.
Conclusion
In our community‐based, healthy referent sample, we developed age‐ and sex‐specific reference values for P‐wave indices. We identified that P‐wave indices, such as the PR interval, are on average longer in men and with older age. Reference values are essential toward studying how clinical and metabolic processes impact an intermediate phenotype such as P‐wave indices. Establishing population‐based reference values is necessary to define the epidemiology of P‐wave indices.
Supporting information
Table S1. (A) P‐wave indices reference value distributions by sex and age.* (Where number of missing leads > = 1). (B) P wave indices reference value distributions by sex and age.* (Where number of missing leads = 0)
Please note: Wiley‐Blackwell are not responsible for the content or functionality of any supporting materials supplied by the authors. Any queries (other than missing material) should be directed to the corresponding author for the article.
Supporting info item
Funding: This research was funded by American Heart Association Award 09FTF2190028; RC1 HL101056; HL092577.
Disclosures: None.
REFERENCES
- 1. Magnani JW, Williamson MA, Ellinor PT, et al P wave Indices: Current status and future directions in epidemiology, clinical, and research applications. Circ Arrhythm Electrophysiol 2009;2:72–79. [DOI] [PMC free article] [PubMed] [Google Scholar]
- 2. Soliman EZ, Prineas RJ, Case LD, et al Ethnic distribution of ECG predictors of atrial fibrillation and its impact on understanding the ethnic distribution of ischemic stroke in the Atherosclerosis Risk in Communities (ARIC) study. Stroke 2009;40:1204–1211. [DOI] [PMC free article] [PubMed] [Google Scholar]
- 3. Gialafos EJ, Dilaveris PE, Synetos AG, et al P wave analysis indices in young healthy men: Data from the digital electrocardiographic study in Hellenic Air Force Servicemen (DEHAS). Pacing Clin Electrophysiol 2003;26(1 Pt 2):367–372. [DOI] [PubMed] [Google Scholar]
- 4. Jairath UC, Spodick DH. Exceptional prevalence of interatrial block in a general hospital population. Clin Cardiol 2001;24:548–550. [DOI] [PMC free article] [PubMed] [Google Scholar]
- 5. Asad N, Spodick DH. Prevalence of interatrial block in a general hospital population. Am J Cardiol 2003;91:609–610. [DOI] [PubMed] [Google Scholar]
- 6. Cheng S, Keyes MJ, Larson MG, et al Long‐term outcomes in individuals with prolonged PR interval or first‐degree atrioventricular block. JAMA 2009;301:2571–2577. [DOI] [PMC free article] [PubMed] [Google Scholar]
- 7. Dawber TR, Meadors GF, Moore FE, Jr . Epidemiological approaches to heart disease: The Framingham Study. Am J Public Health Nations Health 1951;41:279–281. [DOI] [PMC free article] [PubMed] [Google Scholar]
- 8. Kannel WB, Feinleib M, McNamara PM, et al An investigation of coronary heart disease in families. The Framingham offspring study. Am J Epidemiol 1979;110:281–290. [DOI] [PubMed] [Google Scholar]
- 9. D’Agostino RB, Sr ., Vasan RS, Pencina MJ, et al General cardiovascular risk profile for use in primary care: The Framingham Heart Study. Circulation 2008;117:743–753. [DOI] [PubMed] [Google Scholar]
- 10. Kannel WB, D’Agostino RB, Silbershatz H, et al Profile for estimating risk of heart failure. Arch Intern Med 1999;159:1197–1204. [DOI] [PubMed] [Google Scholar]
- 11. Levy D, Larson MG, Vasan RS, et al The progression from hypertension to congestive heart failure. JAMA 1996;275:1557–1562. [PubMed] [Google Scholar]
- 12. Wolf PA, D’Agostino RB, Belanger AJ, et al Probability of stroke: A risk profile from the Framingham Study. Stroke 1991;22:312–318. [DOI] [PubMed] [Google Scholar]
- 13. Magnani JW, Mazzini MJ, Sullivan LM, et al P Wave Indices, distribution and quality control assessment (from the Framingham Heart Study). Ann Noninvasive Electrocardiol 2010;15:77–84. [DOI] [PMC free article] [PubMed] [Google Scholar]
- 14. Sagie A, Larson MG, Goldberg RJ, et al An improved method for adjusting the QT interval for heart rate (the Framingham Heart Study). Am J Cardiol 1992;70:797–801. [DOI] [PubMed] [Google Scholar]
- 15. Badilini F, Sarapa N. Implications of methodological differences in digital electrocardiogram interval measurement. J Electrocardiol 2006;39(4 Suppl):S152–S156. [DOI] [PubMed] [Google Scholar]
- 16. Kligfield P, Badilini F, Brown B, et al The ISCE ECG genome pilot challenge: A 2004 progress report. J Electrocardiol 2004;37(Suppl):144–148. [DOI] [PubMed] [Google Scholar]
- 17. Hyltoft PP, Rustad P. Prerequisites for establishing common reference intervals. Scand J Clin Lab Invest 2004;64:285–292. [DOI] [PubMed] [Google Scholar]
- 18. Buttner J. Reference methods as a basis for accurate measuring systems. Eur J Clin Chem Clin Biochem 1991;29:223–235. [DOI] [PubMed] [Google Scholar]
- 19. Mason JW, Ramseth DJ, Chanter DO, et al Electrocardiographic reference ranges derived from 79,743 ambulatory subjects. J Electrocardiol 2007;40:228–234. [DOI] [PubMed] [Google Scholar]
- 20. Kistler PM, Sanders P, Fynn SP, et al Electrophysiologic and electroanatomic changes in the human atrium associated with age. J Am Coll Cardiol 2004;44:109–116. [DOI] [PubMed] [Google Scholar]
- 21. Becker AE. How structurally normal are human atria in patients with atrial fibrillation? Heart Rhythm 2004;1:627–631. [DOI] [PubMed] [Google Scholar]
- 22. Kourliouros A, Savelieva I, Kiotsekoglou A, et al Current concepts in the pathogenesis of atrial fibrillation. Am Heart J 2009;157:243–252. [DOI] [PubMed] [Google Scholar]
- 23. Babaev AA, Vloka ME, Sadurski R, et al Influence of age on atrial activation as measured by the P‐wave signal‐averaged electrocardiogram. Am J Cardiol 2000;86:692–695, A9. [DOI] [PubMed] [Google Scholar]
- 24. Havmoller R, Carlson J, Holmqvist F, et al Age‐related changes in P wave morphology in healthy subjects. BMC Cardiovasc Disord 2007;7:22. [DOI] [PMC free article] [PubMed] [Google Scholar]
- 25. Boor P, Casper S, Celec P, et al Renal, vascular and cardiac fibrosis in rats exposed to passive smoking and industrial dust fiber amosite. J Cell Mol Med 2008. [DOI] [PMC free article] [PubMed] [Google Scholar]
- 26. Yazici M, Ozdemir K, Altunkeser BB, et al The effect of diabetes mellitus on the P‐wave dispersion. Circ J 2007;71:880–883. [DOI] [PubMed] [Google Scholar]
- 27. Duru M, Seyfeli E, Kuvandik G, et al Effect of weight loss on P wave dispersion in obese subjects. Obesity (Silver Spring) 2006;14:1378–1382. [DOI] [PubMed] [Google Scholar]
- 28. Dogan A, Ozaydin M, Nazli C, et al Does impaired left ventricular relaxation affect P wave dispersion in patients with hypertension? Ann Noninvasive Electrocardiol 2003;8:189–193. [DOI] [PMC free article] [PubMed] [Google Scholar]
- 29. Dagli N, Karaca I, Yavuzkir M, et al Are maximum P wave duration and P wave dispersion a marker of target organ damage in the hypertensive population? Clin Res Cardiol 2008;97:98–104. [DOI] [PubMed] [Google Scholar]
Associated Data
This section collects any data citations, data availability statements, or supplementary materials included in this article.
Supplementary Materials
Table S1. (A) P‐wave indices reference value distributions by sex and age.* (Where number of missing leads > = 1). (B) P wave indices reference value distributions by sex and age.* (Where number of missing leads = 0)
Please note: Wiley‐Blackwell are not responsible for the content or functionality of any supporting materials supplied by the authors. Any queries (other than missing material) should be directed to the corresponding author for the article.
Supporting info item