Abstract
AIM(S)
To investigate the potential of AZD7325 to induce CYP1A2 and CYP3A4 enzyme activities.
METHODS
Induction of CYP1A2 and CYP3A4 by AZD7325 was first evaluated using cultured human hepatocytes. The effect of multiple doses of 10 mg AZD7325 on the pharmacokinetics of midazolam and caffeine was then examined in healthy subjects.
RESULTS
The highest CYP1A2 and CYP3A4 induction responses were observed in human hepatocytes treated with 1 or 10 µm of AZD7325, in the range of 17.9%–54.9% and 76.9%–85.7% of the positive control responses, respectively. The results triggered the further clinical evaluation of AZD7325 induction potential. AZD7325 reached a plasma Cmax of 0.2 µm after 10 mg daily dosing to steady-state. AZD7325 decreased midazolam geometric mean AUC by 19% (0.81-fold, 90% CI 0.77, 0.87), but had no effect on midazolam Cmax (90% CI 0.82, 0.97). The mean CL/F of midazolam increased from 62 l h−1 (midazolam alone) to 76 l h−1 when co-administered with AZD7325. The AUC and Cmax of caffeine were not changed after co-administration of AZD7325, with geometric mean ratios (90% CI) of 1.17 (1.12, 1.23) and 0.99 (0.95, 1.03), respectively.
CONCLUSIONS
While AZD7325 appeared to be a potent CYP3A4 inducer and a moderate CYP1A2 inducer from in vitro studies, the expected efficacious dose of AZD7325 had no effect on CYP1A2 activity and only a weak inducing effect on CYP3A4 activity. This comparison of in vitro and in vivo results demonstrates the critical role that clinical exposure plays in evaluating the CYP induction risk of a drug candidate.
Keywords: AZD7325, caffeine, CYP1A2, CYP3A4, induction, midazolam
WHAT IS ALREADY KNOWN ABOUT THIS SUBJECT
AZD7325 is an orally administered, potent, selective gamma-amino-butyric acid (GABAA) α2,3 receptor modulator intended for the treatment of anxiety.
The induction effects of AZD7325 on CYP1A2 and CYP3A4 have not been systematically studied.
WHAT THIS STUDY ADDS
The in vitro studies showed that AZD7325 was a moderate CYP1A2 inducer and potent CYP3A4 inducer.
The follow-up clinical studies in healthy volunteers demonstrated that the expected efficacious daily dose of AZD7325 only weakly induced the pharmacokinetics of the CYP3A4 sensitive substrate, midazolam, and had no effect on the pharmacokinetics of the CYP1A2 substrate, caffeine. There was no apparent change in AZD7325 exposure following co-administration of midazolam or caffeine compared with AZD7325 alone.
The study demonstrated that clinical exposure of the inducer plays a critical role in the determination of cytochrome P450 induction risk of a drug candidate.
Introduction
AZD7325 (Figure 1), 4-amino-8-(2-fluoro-6-methoxy-phenyl)-N-propyl-cinnoline-3-carboxamide, is a potent, selective gamma-amino-butyric acid (GABAA)α2,3 receptor modulator intended for the treatment of anxiety [1]. GABAA receptors are heteropentameric chloride channels, containing α-, β- and γ-subunits, with multiple subtypes [2], [3]. Benzodiazepines are widely used because of their immediate and robust anxiolytic onset, but are also limited because of their side effects. Benzodiazepines have near equipotent affinities at α1, α2, α3 and α5 containing GABAA receptors and display uniform positive allosteric modulation activity at all these subtype receptors [1], [4]. The anxiolytic effects of benzodiazepines are attributed to GABAAα2,3 receptor modulation, and the sedative effects to GABAAα1,5 receptor modulation [5], [6]. AZD7325, as a selective GABAAα2,3 receptor modulator, is expected to reduce the risk for the benzodiazepine like side effects, such as sedation and cognitive effects.
Figure 1.
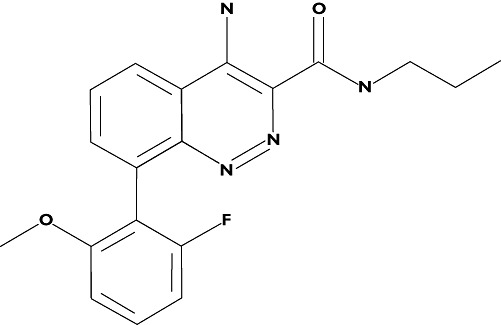
Chemical structure of AZD7325
The cytochrome P450 (CYP) enzymes play an important role in the metabolism of a majority of marketed drugs. CYP3A4 is the predominant human hepatic and intestinal CYP isoform and contributes to the metabolism of approximately 50% of clinically used drugs [7]. CYP1A2 is also one of the major human hepatic CYPs and represents ∼13% of total CYP enzymes in liver [8]. Induction of human CYP enzymes may lead to decreased systemic exposure of co-administered drugs and result in inadequate efficacy of the affected drugs [9]. Therefore, it is important to assess CYP induction potential during drug discovery and development to enable planning of appropriate clinical drug–drug interaction studies. CYP induction is generally regulated at the transcriptional level. The pregnane X receptor (PXR) is a transcription factor that is primarily responsible for CYP3A4 and CYP2C9 gene regulation [10], [11], while the aryl hydrocarbon receptor (AhR) is thought to regulate the expression of CYP1A enzymes [12]. CYP induction potential can be readily evaluated using a number of in vitro test systems, such as nuclear receptor assays, and in cultured hepatocytes. However, CYP induction has demonstrated significant species differences and well controlled experiments in cultured primary human hepatocytes or cell lines that display human hepatocyte-like functions including drug-metabolizing enzymes and nuclear receptors are the preferred in vitro model for induction evaluations [13], [14]. In the present study, the induction potential of AZD7325 was first assessed in vitro with cultured human hepatocytes by measurement of mRNA concentrations, protein concentration and CYP functional enzyme activity. Based on our in vitro results, a clinical drug–drug interaction study was performed in healthy male subjects to investigate the effects of 11–12 days daily oral doses of 10 mg AZD7325, the expected efficacious dose, on the pharmacokinetics of a CYP3A4 substrate, midazolam, and a CYP1A2 substrate, caffeine.
Methods
In vitro CYP Induction by AZD7325
Materials
AZD7325 was synthesized at AstraZeneca Pharmaceuticals LP. All other chemicals were obtained from Sigma-Aldrich (St Louis, MO) or BD Biosciences (Woburn, MA). Freshly isolated primary human hepatocytes for induction studies were obtained by BD Gentest from an ethically approved source (Woburn, MA).
Induction evaluation in cultured primary human hepatocytes
The potential of AZD7325 to induce the expression of CYP enzymes was investigated in primary cultures of freshly isolated human hepatocytes from one female (HH210) and two male (HH215, HH216) donors. Hepatocytes were treated once daily for 3 consecutive days with AZD7325 (0.01, 0.1, 1, and 10 µm) or positive control inducers, β-naphthoflavone (BNF, 20 µm) and rifampicin (RIF, 20 µm), as well as a solvent vehicle control (0.08% DMSO). After 72 h treatment, the hepatocytes were harvested and homogenized for microsomes preparation [13]. CYP enzyme induction was assessed by microsomal assay using probe substrates phenacetin (200 µm) and testosterone (200 µm) for CYP1A2 and CYP3A4 catalytic activities, respectively. The incubation mixture (0.1 ml) also included 0.2 mg ml−1 microsomes, 0.1 m pH 7.4 potassium phosphate buffer and NADPH re-generating system containing 1.3 mm NADP, 3.3 mm of glucose-6-phosphate and 0.4 units ml−1 of glucose-6-phosphate dehydrogenase. Metabolic reactions were stopped by addition of acetonitrile at 45 and 30 min for CYP1A2 and CYP3A4, respectively. Metabolite formation of the specific probe substrate for each enzyme was analyzed using HPLC with UV absorbance [15]. Fold of induction was calculated as the ratio of activity from AZD7325 or positive control to activity from vehicle control. The extent of enzyme activity induction, expressed as a percentage of the positive control effect, was calculated as follows:
Western blots of CYP1A2 and CYP3A4
CYP1A2 and CYP3A4 protein in microsomes treated with AZD7325 or positive control inducers was determined by electrophoresis under denaturing/reducing conditions and immunoblot analysis. Briefly, microsomal samples (30 µg) were loaded onto the pre-cast Novex mini-gels (Invitrogen, Carlsbad, CA), separated with sodium dodecyl sulphate (SDS) running buffer, and then electrotransferred to nitrocellulose blotting membranes. The relative immunoreactive protein content of CYP1A2 and CYP3A4 present in samples was determined with polyclonal antibodies specific to human CYP1A2 (Xenotech, Lenexa, KS) and CYP3A4 (BD Biosciences, Woburn, MA). The blots were visualized with an anti-rabbit IgG secondary antibody (BD Biosciences, Woburn, MA) biotinylated with streptavidin-horseradish peroxidase. CYP1A2 and CYP3A4 protein was then detected by a chemiluminescence imaging detection reagent (Thermo Scientific, Rockford, IL). The bands were analyzed by densitometry using a Kodak Digital Image Station (Model 440 CF) equipped with 1D Image Analysis Software. Pooled human liver microsomes were used as a reference marker.
TaqMan real-time, reverse transcription (RT)-PCR
The mRNA expression for each CYP isoform was determined using TaqMan RT-PCR analysis [16]. Threshold cycle (CT) values (the fractional cycle number at which the fluorescence passes the fixed threshold) were first determined. Then ΔCT of each target gene sample was calculated by subtracting the CT from the corresponding endogenous control, β-actin. The ΔΔCT was then determined for the positive control inducer or AZD7325 by subtracting the ΔCT from phosphate-buffered saline. Fold induction was determined by the calculation of 2-ΔΔCT. The extent of mRNA induction, expressed as a percentage of the positive control effect, was calculated as follows:
In vivo CYP induction by AZD7325
Subjects
The drug−drug interaction study was performed in healthy male subjects, aged 18–45 years inclusive with a body mass index of 19–30 kg m−2. Exclusion criteria included clinically relevant disease or abnormalities, use of any tobacco products within the past 6 months, history of alcohol or drugs of abuse, or use of any prescription medication within 14 days prior to the study. Subjects were not permitted to consume caffeine containing products for 48 h before and after administration of the test dose of caffeine. Subjects were also asked to refrain from use of any over the counter medications, herbal medications (e.g. St Johns Wort) or foodstuffs (e.g. grapefruit juice) that possibly could interfere with the objectives of this study (e.g. inhibiting or inducing drug metabolizing enzymes), from 14 days prior to the study until the end of the study period. All volunteers provided written informed consent. The protocol was approved by an Independent Ethics Committee, and the study was conducted in accordance with guidelines established by the Declaration of Helsinki and was consistent with International Conference on Harmonization and Good Clinical Practice.
Study design
The study was a single centre, open label, fixed sequence, non-randomized study in a single cohort of 24 healthy male subjects to investigate the effects of repeated doses of AZD7325 on the pharmacokinetics of a CYP3A4 substrate (midazolam) and a CYP1A2 substrate (caffeine). All subjects received a single oral dose of 5 mg midazolam (Ratiopharm GmbH, Blaubeuren, Germany) on day −2 and day 11 and a single oral dose of 200 mg caffeine (Pharmapac UK, Bidston, UK) on day −1 and day 12. All subjects received a single daily oral dose of 10 mg AZD7325 as a gelatin capsule (AstraZeneca, Södertälje, Sweden) in the morning on days 1–12. Midazolam and caffeine were administered 1 h after AZD7325 intake to reduce the risk of drug−drug interactions during the absorption phase.
Screening of the healthy volunteers was performed between 30 and 4 days prior to dosing and involved collection of a full medical history and a complete physical examination including electrocardiogram (ECG), vital signs and clinical laboratory tests. Subjects were confined to a clinical research unit from the evening before the study began (day −3) until day 14, 48 h after administration of caffeine on day 12. Subjects returned to the clinical unit for a follow-up visit 7–10 days after completing the study.
Pharmacokinetic sampling and analysis
Blood samples for determination of midazolam and its metabolite 1′-hydroxymidazolam plasma concentrations were collected at pre dose, 0.17, 0.33, 0.5, 0.75, 1, 1.5, 2, 2.5, 3, 4, 6, 9, 12 and 24 h post dose after a single midazolam dose (day −2), and after co-administration with AZD7325 (day 11). Blood samples for determination of caffeine and its metabolite, paraxanthine, plasma concentrations were collected at pre dose, 0.5, 1, 1.5, 2, 2.5, 3, 4, 6, 9, 12, 18, 24, 36 and 48 h post dose after a single caffeine dose (day −1) and after co-administration with AZD7325 (day 12). Blood samples for determination of AZD7325 plasma concentrations were collected after a single AZD7325 dose on day 1, pre dose, 0.25, 0.5, 1, 1.5, 2, 3, 4, 6, 8, 10, 12, 16, 20 and 24 h post dose. Trough samples were collected pre-dose on days 4, 6, 8, 9 and 10 and on days 11 and 12 at the same sample times as when midazolam or caffeine were co-administered. Blood samples were collected and centrifuged at within 30 min of sampling. The plasma samples were stored at or below −70°C until analyzed by BASi (West Lafayette, IN).
Plasma concentrations of midazolam and 1′-hydroxymidazolam were determined using a validated liquid chromatography tandem mass spectrometry (LC-MS/MS) method after liquid−liquid extraction. The range of quantification was 0.3 −300 ng ml−1 for both midazolam and 1′-hydroxymidazolam. The accuracy, within-run and between-run precision were −11.7% ≤ %bias ≤ 3.8%, ≤ 8.4% and ≤7.5% for midazolam and −8.3% ≤ %bias ≤ 2.0%, ≤ 9.9% and ≤7.4% for 1′-hydroxymidazolam, respectively. Plasma concentrations of caffeine and paraxanthine were determined using a validated LC-MS/MS method after solid phase extraction. The range of quantification was 25−20 000 ng ml−1 for both caffeine and paraxanthine. The accuracy, within-run and between-run precision were −12.0% ≤ %bias ≤ 10.8%, ≤8.9% and ≤12.0% for caffeine and −13.6% ≤ %bias ≤ 8.0%, ≤6.2% and ≤11.2% for paraxanthine, respectively. Plasma concentrations of AZD7325 were determined using a validated LC-MS/MS method after solid phase extraction. The range of quantification, accuracy, within-run and between-run precision for AZD7325 were 0.05−40 ng ml−1, −2.7% ≤ %bias ≤ 14.0%, ≤11.0% and ≤7.4%, respectively.
Pharmacokinetic and statistical analysis
Plasma concentration−time results were analyzed by standard non-compartmental methods using WinNonlin (Pharsight Corporation, Mountain View, CA). When applicable, the following PK parameters were estimated for midazolam, 1′-hydroxymidazolam, caffeine, paraxanthine and AZD7325: area under the curve extrapolated to infinity (AUC), observed peak concentration (Cmax), elimination half-life (t1/2) and clearance (CL/F).
The natural log-transformed variables AUC and Cmax were analyzed as dependent variables in a linear mixed effect model with treatment as a fixed effect and subject as a random effect. Estimates of the mean difference (with AZD7325 – without AZD7325) were calculated with 90% confidence intervals (CI). The results were transformed back to the original scale in order to give an estimate of the true ratios (with AZD7325 : without AZD7325) and 90% CIs for these ratios. No clinically relevant effect on the pharmacokinetics of midazolam or caffeine after co-administration of AZD7325 could be claimed if the 90% CIs of the ratio of the geometric means were completely contained in (0.8, 1.25).
Results
In vitro CYP Induction by AZD7325
The potential of AZD7325 to induce CYP1A2 and CYP3A4 expression was evaluated using primary cultures of fresh human hepatocytes. A cytotoxicity assay using the tetrazole 3-(4,5-dimethylthiazol-2-yl)-2,5-diphenyltetrazolium and visual inspection showed no apparent reduction in hepatocyte viability after treatment with AZD7325 at a concentration up to 10 µm. Treatment with positive control inducers, β-naphthoflavone or rifampicin, caused marked induction of CYP1A2 activity (8.9- to 24-fold) and CYP3A4 activity (14- to 112-fold), respectively, in hepatocytes from three individual donors (Figure 2). Marked induction of mRNA expression (Figure 3) and protein expression (Figure 4) was also observed with positive control inducer treatment in all three donors.
Figure 2.
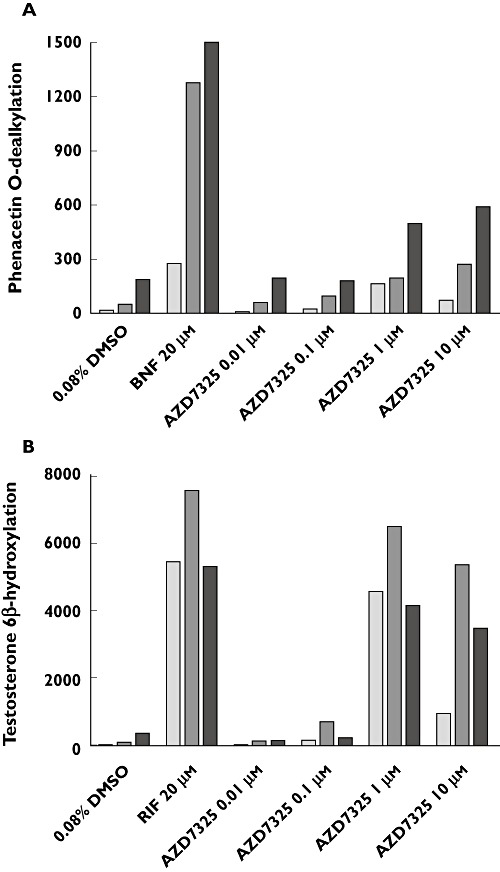
Microsomal enzyme activity (pmol min−1mg−1 protein) of CYP1A2 (A) and CYP3A4 (B) in cultured human hepatocytes treated with AZD7325 (0.01, 0.1, 1, 10 µm) or positive control inducers, β-naphthoflavone (BNF) or rifampicin (RIF), from three human donors ( HH210,
  HH215,
  HH216) using CYP selective probe drugs. Each bar represents the mean activity from duplicate incubations
Figure 3.
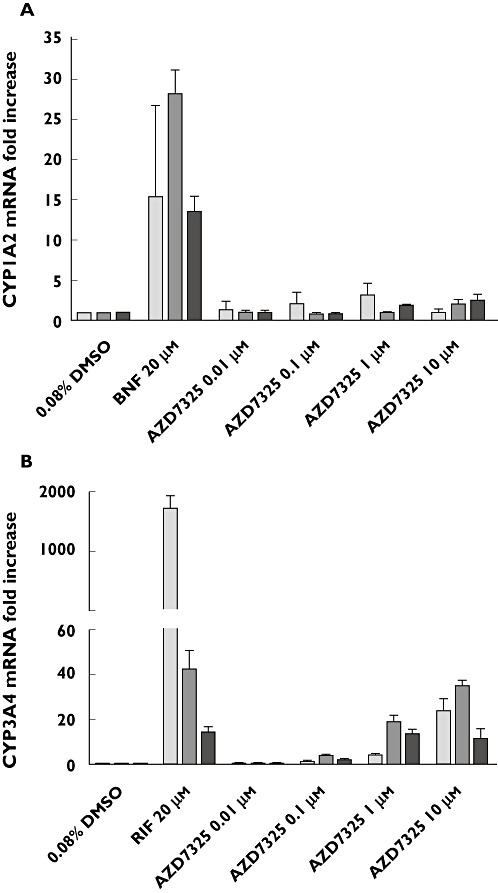
The mRNA expression of CYP1A2 (A) and CYP3A4 (B) in cultured human hepatocyte cultures treated with AZD7325 (0.01, 0.1, 1, 10 µm) or positive control inducers, β-naphthoflavone (BNF) or rifampicin (RIF), from three human donors ( HH210,
  HH215,
  HH216)
Figure 4.
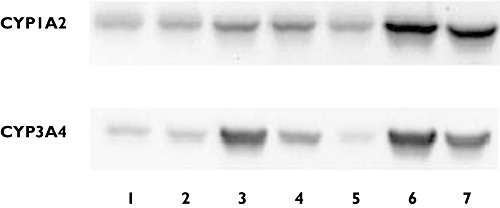
Western blot analysis of CYP1A2 (A) and CYP3A4 (B) protein expression levels in cultured human hepatocytes treated with AZD7325 from a representative donor (HH210). Band 1 to 4 were microsomes (30 µg) from human hepatocytes treated with 0.01, 0.1, 1, 10 µm AZD7325, respectively. Band 5 was microsomes from human hepatocytes treated with 0.08% DMSO that was used as baseline. Band 6 was microsomes from human hepatocytes treated with positive control inducers (20 µmβ-naphthoflavone or 20 µm rifampicin). Band 7 was pooled human liver microsomes that were used as a positive control
Increase of CYP1A2 activity was observed in all three preparations of hepatocytes treated with 0.01, 0.1, 1 or 10 µm AZD7325 (Figure 2). The maximal induction response (8.9-fold over vehicle controls) was observed at 1 µm in donor HH210, corresponding to 54.9% of the adjusted positive control β-naphthoflavone response. In addition, the maximal induction response of 5.1-fold (17.9% of the positive control response) and 3.1-fold (26.8% of the positive control response) was observed at 10 µm in donor HH215 and donor HH 216, respectively. In general, the results from mRNA assays and Western blots were consistent with those observed from CYP1A2 activity assays. AZD7325 at 1 or 10 µm caused a maximal CYP1A2 mRNA expression of 3.2-fold, 2.1-fold and 2.5-fold in donor HH210, HH215 and HH216, respectively (Figure 3). The densitometry and image data from Western blots demonstrated an induction (1.5-fold to 3.5-fold) in CYP1A2 protein expression in hepatocytes from multiple donors after treatment with AZD7325 (Figure 4). Though variability was observed among the three donors, the results from enzyme activity, mRNA and protein expression suggested that AZD7325 was a moderate inducer of CYP1A2 in vitro.
A concentration-related increase in CYP3A4 activity was observed with 0.01, 0.1, 1 or 10 µm AZD7325 treatment in all three preparations of primary human hepatocyte cultures (Figure 2). The maximal induction response observed at 1 µm of AZD7325 treatment was 94-fold, 53-fold and 11-fold over vehicle controls in donors HH210, HH215 and HH216, respectively. The CYP3A4 activity increase was in the range of 76.9–85.7% relative to the adjusted positive control rifampicin response, indicating that AZD7325 was a potent CYP3A4 inducer in vitro. The increase in testosterone 6β-hydroxylase activity observed in hepatocyte microsomes was similar or lower after exposure to 10 µm than exposure to 1 µm AZD7325. The average induction response observed after incubation with 0.1 µm was only 3.4-fold over vehicle controls in the three donors. Little or no induction of CYP3A4 activity was observed with 0.01 µm AZD7325 treatment in all three donors. Similarly, AZD7325 caused maximal CYP3A4 mRNA expression increases of 24-fold, 35-fold and 12-fold in donor HH210, HH215 and HH216, respectively (Figure 3). The induction of CYP3A4 mRNA expression was similar to the positive control rifampicin (82.4% and 95.6%) in donors HH215 and HH216 but the relative induction was much lower (1.31% of positive control response) in donor HH210, due to the strong observed response to rifampicin in this donor (1744-fold over vehicle control). In the Western blot study, treatment with AZD7325 caused a CYP3A4 protein expression increase of 1.5-fold to 74-fold in the three donors (Figure 4). The results in general supported the data obtained from microsomal CYP3A4 enzyme activity and mRNA assays.
In vivo CYP induction by AZD7325
Demographics
A total of 24 healthy male subjects were enrolled, 23 completed the study, and one withdrew his consent on day −2, prior to dosing with AZD7325 due to a pre dose adverse event of back pain. The subject was therefore withdrawn from the study. The subject received one dose of midazolam 5 mg. Subject demographics and baseline characteristics are summarized in Table 1.
Table 1.
Demographic characteristics
| Characteristic | All subjects |
|---|---|
| n | 24 |
| Gender, male, n (%) | 24 (100%) |
| Race: | |
| White | 20 (83%) |
| Black or African American | 1 (4%) |
| Asian (except Indian/Pakistani) | 1 (4%) |
| Other | 2 (8%) |
| Age (years), mean (range) | 27.7 (20–41) |
| Weight (kg), mean (range) | 81.3 (62–96) |
| Height (cm), mean (range) | 177.5 (168–189) |
| Body mass index (kg m−2), mean (range) | 25.8 (21–30) |
Pharmacokinetics
The mean caffeine and its metabolite, paraxanthine, plasma concentration–time profiles after oral administration of 200 mg caffeine before and after co-administration with repeat dose AZD7325 (10 mg) are shown in Figure 5. No significant change in caffeine and paraxanthine exposure was observed with co-administration of repeat doses of AZD7325 compared with caffeine alone. The individual AUCs of caffeine and paraxanthine with and without co-administration of AZD7325 are depicted in Figure 6. The corresponding 90% CIs for AUC and Cmax of caffeine and paraxanthine were within the pre-defined range of 0.80–1.25 (Table 2). The geometric mean CL/F of caffeine decreased slightly from 5.8 l h−1 (caffeine alone) to 5.0 l h−1 when given during AZD7325 steady-state administration. The median t1/2 of caffeine alone or co-adminstered with AZD7325 (6.3 vs. 7.0 h) and paraxanthine (7.4 vs. 8.0 h) was similar between treatments.
Figure 5.
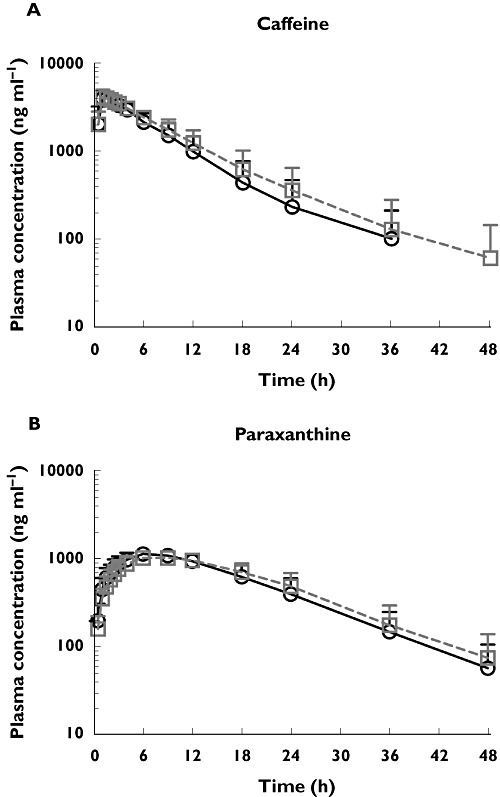
The mean plasma concentration−time profiles of caffeine (A) and its metabolite paraxanthine (B) after oral administration of 200 mg caffeine alone and after co-administration to steady-state with AZD7325 (10 mg) in healthy male volunteers (n = 23). Error bars represent SD. Caffeine alone (○), caffeine in the presence of AZD7325 (□)
Figure 6.
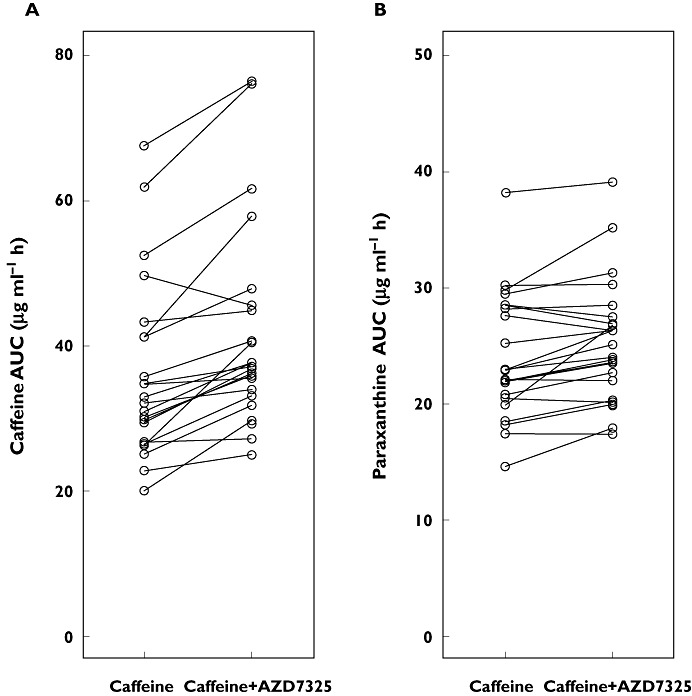
Individual AUC values of caffeine (n = 22, A) or paraxanthine (n = 23, B) following a 200 mg single dose of caffeine alone or in combination with a 10 mg once daily administration of AZD7325 to steady-state
Table 2.
Effect of steady-state treatment of AZD7325 on caffeine pharmacokinetics
| Parameter | Caffeine alone (n = 23) | Caffeine + AZD7325 (n = 23) | Ratio |
|---|---|---|---|
| Caffeine | |||
| AUC (µg ml−1 h) | 34.0 (29.7, 38.8) | 39.8 (34.9, 45.5) | 1.17 (1.12, 1.23) |
| Cmax (µg ml−1) | 4.3 (4.1, 4.6) | 4.3 (4.1, 4.5) | 0.99 (0.95, 1.03) |
| Paraxanthine | |||
| AUC (µg ml−1 h) | 23.5 (21.4, 25.7) | 24.9 (22.8, 27.3) | 1.06 (1.03, 1.10) |
| Cmax (µg ml−1) | 1.2 (1.12, 1.28) | 1.1 (1.02, 1.17) | 0.92 (0.90, 0.93) |
AUC and Cmax values are reported as geometric mean with 95% confident interval (CI). Ratio is expressed as geometric mean ratio with 90% CI.
The mean plasma concentration−time profiles of midazolam and its metabolite 1′-hydroxymidazolam after oral administration of 5 mg midazolam alone and after co-administration with repeat doses of AZD7325 (10 mg) are illustrated in Figure 7. The key pharmacokinetic parameters are summarized in Table 3. The AUC geometric mean ratio of midazolam after administration of AZD7325 to steady-state to midazolam alone was 0.81 (90% CI 0.77, 0.87), which was not contained within the pre-defined range of 0.8, 1.25. The lower limit of the 90% CI was below 0.8 indicating that the AUC of midazolam was 19% lower in combination with the AZD7325 administration. The Cmax of midazolam decreased with AZD7325 co-administration, but the 90% CI (0.82, 0.97) was within the range of 0.80, 1.25. The corresponding CIs for AUC and Cmax of the 1′-hydroxymidazolam indicated that AZD7325 had no significant effect on the exposure of 1′-hydroxymidazolam. The individual AUCs of midazolam and 1′-hydroxymidazolam with and without co-administration of AZD7325 are depicted in Figure 8. The geometric mean CL/F of midazolam increased from 62 l h−1 (midazolam alone) to 76 l h−1 when administered during AZD7325 steady-state administration. The median t1/2 of midazolam decreased from 5.2 h (midazolam alone) to 3.6 h (midazolam with AZD7325) while the median t1/2 of 1′-hydroxymidazolam after midazolam administration alone or when co-adminstered with AZD7325 (2.3 vs. 2.4 h) was similar between treatments.
Figure 7.
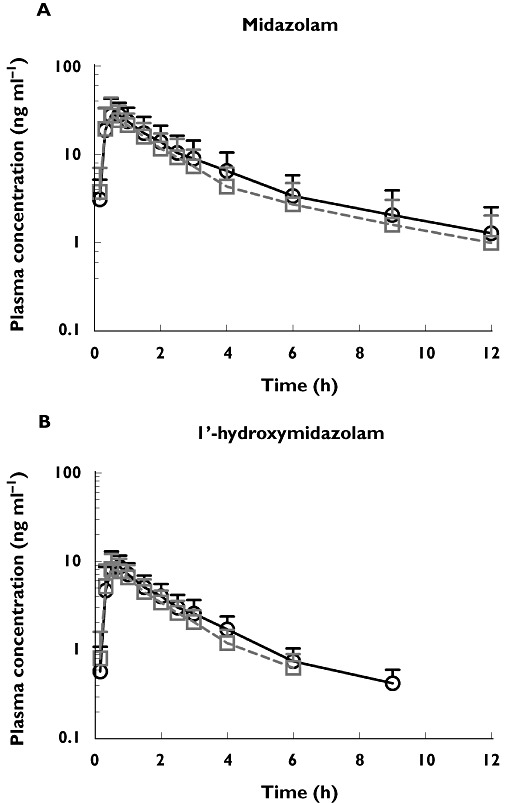
The mean plasma concentration−time profiles of midazolam (A) and its metabolite 1′-hydroxymidazolam (B) after oral administration of 5 mg midazolam alone and after co-administration with AZD7325 (10 mg) to steady-state in healthy male volunteers (n = 23). Error bars represent SD. Midazolam alone (○), midazolam in the presence of AZD7325 (□)
Table 3.
Effect of steady-state treatment of AZD7325 on midazolam pharmacokinetics
| Parameter | Midazolam alone (n = 24) | Midazolam + AZD7325 (n = 23) | Ratio |
|---|---|---|---|
| Midazolam | |||
| AUC (ng ml−1 h) | 80.9 (66.6, 98.2) | 65.8 (54.2, 79.9) | 0.81 (0.77, 0.87) |
| Cmax (ng ml−1) | 32.2 (27.7, 37.5) | 28.6 (24.6, 33.4) | 0.89 (0.82, 0.97) |
| 1′-hydroxymidazolam | |||
| AUC (ng ml−1 h) | 21.2 (18.0, 25.0) | 18.1 (15.4, 21.3) | 0.85 (0.81, 0.90) |
| Cmax (ng ml−1) | 10.0 (8.6, 11.8) | 9.4 (8.0, 11.0) | 0.93 (0.82, 1.06) |
AUC and Cmax values are reported as geometric mean with 95% confident interval (CI). Ratio is expressed as geometric mean ratio with 90% CI.
Figure 8.
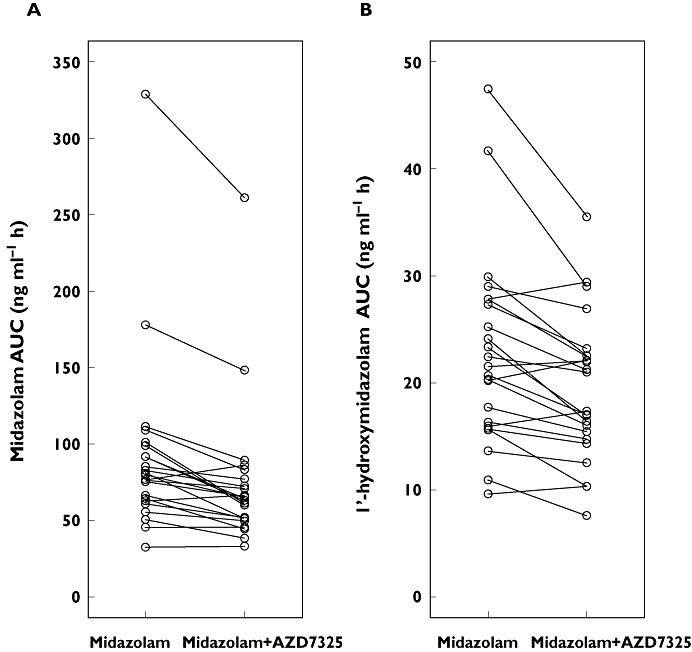
Individual AUC values of midazolam (A) or 1′-hydroxymidaxolam (B) following a 5 mg single dose of midazolam alone or in combination with a 10 mg once daily administration of AZD7325 to steady-state (n = 23)
The mean AZD7325 plasma concentration−time profiles on day 1, day 11 and day 12 after single daily oral administration of 10 mg AZD7325 are shown in Figure 9. Plots of individual Ctrough values on day 1 to day 12 indicated that steady-state was reached on day 6 for most subjects. The geometric mean Cmax and AUC of AZD7325 were 57 ng ml−1 and 261 ng ml−1 h, respectively on day 1. The geometric mean Cmax was 69 and 72 ng ml−1 on day 11 (in combination of midazolam) and day 12 (in combination with caffeine), respectively, indicating the Cmax of AZD7325 at steady-state was about 0.2 µm. The geometric mean AUC(0,24 h) on day 11 and day 12 was 285 and 327 ng ml−1 h, respectively. The geometric mean CL/F of AZD7325 was 38 l h−1, 35 l h−1 and 31 l h−1 on day 1, day 11 and day 12, respectively. There was no apparent change in AZD7325 exposure following co-administration of midazolam or caffeine compared with AZD7325 alone.
Figure 9.
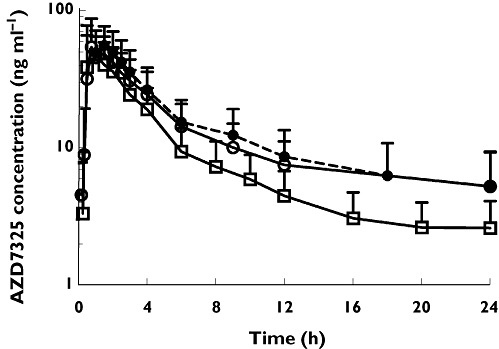
The mean plasma concentration−time profiles of AZD7325 on day 1 ( ), day 11 (
 ) and day12 (
 ) after an oral daily dose of 10 mg AZD7325 in healthy male volunteers (n = 23). Error bars represent SD
Safety
AZD7325 administered in combination with caffeine and midazolam was well tolerated by subjects. There were no significant adverse events or discontinuations due to adverse events noted. A total of 68 treatment emergent adverse events (TEAEs) were reported by 20/24 (83%) subjects. Somnolence was predominantly reported in those subjects taking midazolam. The TEAE most commonly reported by subjects receiving AZD7325 was dizziness. The majority of TEAEs (44/68) were considered to be related to AZD7325, 10 of the 68 were considered to be related to midazolam and 5 of the 68 were considered to be related to caffeine. There were no clinically significant changes in laboratory values, vital signs or ECGs during the study.
Discussion
AZD7325 is a potent, selective GABAAα2,3 receptor modulator intended for the treatment of anxiety. The purpose of this study was to assess the potential of AZD7325 to induce CYP1A2 and CYP3A4 in vivo following on from results observed in vitro. AZD7325 appeared to be a potent inducer of CYP3A4 and a moderate inducer of CYP1A2 in fresh human hepatocytes. AZD7325 caused a maximal in vitro induction response in CYP1A2 activity in the range of 17.9% to 54.9% of the positive control response in the three donors. At 1 µm, AZD7325 caused a maximal induction response (76.9% to 85.7% of the positive control response) in CYP3A4 activity and the induction of CYP3A4 was lower after exposure to 10 µm AZD7325. The decreased induction effect at higher concentrations cannot be attributed to time-dependent inhibition as in vitro studies demonstrated that AZD7325 was not a time-dependent inhibitor of CYP3A4/5 (data on file). Both Western blot and PCR analysis for CYP1A2 and CYP3A4 in general supported the results obtained from the microsomal activity assays. Though the in vitro results demonstrated AZD7325 to be a potent CYP3A4 inducer, the CYP3A4 induction effect was much lower at lower AZD7325 concentrations, indicating that the clinical dose–exposure relationship of AZD7325 would play a critical role in determining the effect on CYP3A4 expression in vivo. Therefore, the clinical evaluation of the impact of this compound on the CYP3A4 substrate midazolam and the CYP1A2 substrate caffeine was performed at the expected efficacious dose of AZD7325 (10 mg). In addition, it has been suggested that in vivo evaluation would be warranted if an in vitro induction of at least 40% of the positive control was observed [17]. Since a response of more than 40% of the positive control inducer was observed for CYP1A2 in one of three donors and in all three donors for CYP3A4 activity, in vivo induction studies were performed using midazolam and caffeine as selective probe drugs for CYP3A4 and CYP1A2, respectively.
The exposure of caffeine and paraxanthine by AUC or Cmax was unchanged by AZD7325 co-administration, with the 90% CI within the default no effect boundary of 0.8, 1.25. In addition, the CL/F of caffeine and the t1/2 of caffeine and paraxanthine were similar between treatments, indicating that at steady-state 10 mg AZD7325 exhibited no effect on CYP1A2 activity. Midazolam AUC decreased statistically significantly by 19% after oral dosing of 10 mg AZD7325 to steady-state. In accordance with this an increase in midazolam CL/F and a slight decrease in midazolam t1/2 were also observed. The Cmax of midazolam also decreased with AZD7325 co-administration, but the 90% CI was within the default no effect boundary of 0.8, 1.25. The results indicated a weak inducing effect of AZD7325 on CYP3A4 activity, which was not likely to be clinically meaningful at this dose. In vitro studies have demonstrated that AZD7325 was primarily metabolized by CYP3A4/5 and CYP2C19 (data on file). The trough concentration of AZD7325 was similar after six doses indicating no evidence of AZD7325 auto-induction after multiple doses, which also indicated that the CYP3A4 induction effect would be minimal at this dose of AZD7325.
Though midazolam exposure decreased with AZD7325 co-administration, there was no notable effect on the 1'-hydroxymidazolam exposure parameters, AUC or Cmax. It has been demonstrated that 1'-hydroxymidazolam can be rapidly converted to its glucuronide conjugate and about 60% to 80% of the midazolam dose is excreted in the urine as 1'-hydroxymidazolam glucuronide within 24 h [18]. Link et al. [19] also demonstrated that glucuronidation plays a major role in the kinetics of the hydroxymidazolam metabolites and proposed that the ratio (1′- hydroxymidazolam + 1'-hydroxymidazolam glucuronide) vs. midazolam rather than 1′- hydroxymidazolam vs. midazolam may be best used to assess induction of CYP3A4 activity in plasma. This may explain the observed statistically significant decrease of midazolam exposure while no change was observed in 1'-hydroxymidazolam exposure. However, the plasma concentrations of the 1'-hydroxymidazolam glucuronide were not determined in current study.
Extrapolation of the magnitude of in vivo induction of CYP inducers from in vitro results is quite complicated. A number of mathematical approaches and correlation approaches, including relative induction score (RIS) and AUC/F2 approaches, have been proposed and validated with various drugs in different clinical trials [9]. All these approaches incorporated in vivo plasma exposure (Cmax, AUC) of the inducer in addition to the observed in vitro induction parameters (EC50, Emax) as clinical exposure of the inducer is a critical determinant to characterize appropriately induction risk. Pioglitazone, rosiglitazone and troglitazone exhibited similar CYP3A4 induction potency evaluated in cryopreserved human hepatocytes [20]. However, the daily doses of 8 mg, 45 mg and 600 mg for rosiglitazone, pioglitazone and troglitazone resulted in free plasma concentrations of 0.0028, 0.028 and 0.063 µm, respectively. In accordance with this, troglitazone and pioglitazone clinically decreased midazolam AUC by 67% and 26%, respectively, while rosiglitazone demonstrated no significant effect on the pharmacokinetics of another CYP3A4 probe drug, nifedipine [20]. On the contrary, carbamazepine, phenobarbital and phenytoin only exhibited weak CYP3A4 induction in in vitro studies. However, all three drugs caused significant induction in good agreement with predictions when high free plasma concentrations were considered [20]. After repeated oral dosing of AZD7325 10 mg, the total Cmax of AZD7325 at steady-state was about 0.2 µm. By considering the human plasma protein binding of 92.4%, the free plasma concentration of AZD7325 at steady-state was only about 0.015 µm. Therefore, it was quite reasonable to expect to observe only weak CYP3A4 induction of midazolam after multiple 10 mg daily doses of AZD7325. Our study provides a valuable additional comparison of in vitro and in vivo induction results and further demonstrates that the physiologically relevant exposure level of a compound plays a critical role when estimating the in vivo impact of an inducer identified through in vitro evaluations.
In conclusion, the hepatocyte studies revealed that AZD7325 was a moderate CYP1A2 inducer and a potent CYP3A4 inducer in vitro. Follow-up clinical studies demonstrated that a 10 mg daily dose of AZD7325 only weakly induced the pharmacokinetics of the CYP3A4 sensitive substrate, midazolam, and did not significantly affect the pharmacokinetics of CYP1A2 substrate, caffeine. As the induction effect was quite weak, dose adjustments would likely not be necessary for drugs substantially metabolized by CYP3A4 when co-administered with AZD7325 at its predicted efficacious dose. This study also demonstrates, like that shown for other drugs, that the clinical exposure of a CYP inducing drug is a key determinant in predicting clinical drug interaction risk and highlights again the importance in improving the predictive modelling of in vitro results to reduce the necessity for clinical drug-drug interaction trials.
Acknowledgments
The authors thank George Zhang and colleagues at BD Gentest for the in vitro induction assessments, and Darren Wilbraham and his team at Quintiles for conducting the clinical study.
Competing Interests
All authors were employees of AstraZeneca at the time of study conduct.
REFERENCES
- 1.Alhambra C, Becker C, Blake T, Chang AH, Damewood JR, Jr, Daniels T, Dembofsky BT, Gurley DA, Hall JE, Herzog KJ, Horchler CL, Ohnmacht CJ, Schmiesing RJ, Dudley A, Ribadeneira MD, Knappenberger KS, Maciag C, Stein MM, Chopra M, Liu XF, Christian EP, Arriza JL, Chapdelaine MJ. Development and SAR of functionally selective allosteric modulators of GABAA receptors. Bioorg Med Chem. 2011;19:2927–38. doi: 10.1016/j.bmc.2011.03.035. [DOI] [PubMed] [Google Scholar]
- 2.Zeilhofer HU, Witschi R, Hösl K. Subtype-selective GABAA receptor mimetics – novel antihyperalgesic agents? J Mol Med. 2009;87:465–9. doi: 10.1007/s00109-009-0454-3. [DOI] [PubMed] [Google Scholar]
- 3.Nutt D. GABAA receptors: subtypes, regional distribution, and function. J Clin Sleep Med. 2006;2:S7–11. [PubMed] [Google Scholar]
- 4.Sheehan DV, Sheehan KH. Current approaches to the pharmacologic treatment of anxiety disorders. Psychopharmacol Bull. 2007;40:98–109. [PubMed] [Google Scholar]
- 5.Foster AC, Kemp JA. Glutamate- and GABA-based CNS therapeutics. Curr Opin Pharmacol. 2006;6:7–17. doi: 10.1016/j.coph.2005.11.005. [DOI] [PubMed] [Google Scholar]
- 6.Rowlett JK, Cook JM, Duke AN, Platt DM. Selective antagonism of GABAA receptor subtypes: an in vivo approach to exploring the therapeutic and side effects of benzodiazepine-type drugs. CNS Spectr. 2005;10:40–8. doi: 10.1017/s1092852900009895. [DOI] [PubMed] [Google Scholar]
- 7.Guengerich FP. Cytochrome P-450 3A4: regulation and role in drug metabolism. Annu Rev Pharmacol Toxicol. 1999;39:1–17. doi: 10.1146/annurev.pharmtox.39.1.1. [DOI] [PubMed] [Google Scholar]
- 8.Zhou SF, Chan E, Zhou ZW, Xue CC, Lai X, Duan W. Insights into the structure, function, and regulation of human cytochrome P450 1A2. Curr Drug Metab. 2009;10:713–29. doi: 10.2174/138920009789895552. [DOI] [PubMed] [Google Scholar]
- 9.Chu V, Einolf HJ, Evers R, Kumar G, Moore D, Ripp S, Silva J, Sinha V, Sinz M, Skerjanec A. In vitro and in vivo induction of cytochrome p450: a survey of the current practices and recommendations: a pharmaceutical research and manufacturers of america perspective. Drug Metab Dispos. 2009;37:1339–54. doi: 10.1124/dmd.109.027029. [DOI] [PubMed] [Google Scholar]
- 10.Gibson GG, Plant NJ, Swales KE, Ayrton A, El-Sankary W. Receptor-dependent transcriptional activation of cytochrome P4503A genes: induction mechanisms, species differences and interindividual variation in man. Xenobiotica. 2002;32:165–206. doi: 10.1080/00498250110102674. [DOI] [PubMed] [Google Scholar]
- 11.Chen Y, Ferguson SS, Negishi M, Goldstein JA. Induction of human CYP2C9 by rifampicin, hyperforin, and phenobarbital is mediated by the pregnane X receptor. J Pharmacol Exp Ther. 2004;308:495–501. doi: 10.1124/jpet.103.058818. [DOI] [PubMed] [Google Scholar]
- 12.Denison MS, Nagy SR. Activation of the aryl hydrocarbon receptor by structurally diverse exogenous and endogenous chemicals. Annu Rev Pharmacol Toxicol. 2003;43:309–34. doi: 10.1146/annurev.pharmtox.43.100901.135828. [DOI] [PubMed] [Google Scholar]
- 13.LeCluyse EL. Human hepatocyte culture systems for the in vitro evaluation of cytochrome P450 expression and regulation. Eur J Pharm Sci. 2001;13:343–68. doi: 10.1016/s0928-0987(01)00135-x. [DOI] [PubMed] [Google Scholar]
- 14.Kanebratt KP, Andersson TB. Evaluation of HepaRG cells as an in vitro model for human drug metabolism studies. Drug Metab Dispos. 2008;36:1444–52. doi: 10.1124/dmd.107.020016. [DOI] [PubMed] [Google Scholar]
- 15.Stresser DM, Broudy MI, Ho T, Cargill CE, Blanchard AP, Sharma R, Dandeneau AA, Goodwin JJ, Turner SD, Erve JC, Patten CJ, Dehal SS, Crespi CL. Highly selective inhibition of human CYP3Aa in vitro by azamulin and evidence that inhibition is irreversible. Drug Metab Dispos. 2004;32:105–12. doi: 10.1124/dmd.32.1.105. [DOI] [PubMed] [Google Scholar]
- 16.McGinnity DF, Zhang G, Kenny JR, Hamilton GA, Otmani S, Stams KR, Haney S, Brassil P, Stresser DM, Riley RJ. Evaluation of multiple in vitro systems for assessment of CYP3A4 induction in drug discovery: human hepatocytes, pregnane X receptor reporter gene, and Fa2N-4 and HepaRG cells. Drug Metab Dispos. 2009;37:1259–68. doi: 10.1124/dmd.109.026526. [DOI] [PubMed] [Google Scholar]
- 17.Huang SM, Temple R, Throckmorton DC, Lesko LJ. Drug interaction studies: study design, data analysis, and implications for dosing and labeling. Clin Pharmacol Ther. 2007;81:298–304. doi: 10.1038/sj.clpt.6100054. [DOI] [PubMed] [Google Scholar]
- 18.Vossen M, Sevestre M, Niederalt C, Jang IJ, Willmann S, Edginton AN. Dynamically simulating the interaction of midazolam and the CYP3A4 inhibitor itraconazole using individual coupled whole-body physiologically-based pharmacokinetic (WB-PBPK) models. Theor Biol Med Model. 2007;26:4–13. doi: 10.1186/1742-4682-4-13. [DOI] [PMC free article] [PubMed] [Google Scholar]
- 19.Link B, Haschke M, Grignaschi N, Bodmer M, Aschmann YZ, Wenk M, Krähenbühl S. Pharmacokinetics of intravenous and oral midazolam in plasma and saliva in humans: usefulness of saliva as matrix for CYP3A phenotyping. Br J Clin Pharmacol. 2008;66:473–84. doi: 10.1111/j.1365-2125.2008.03201.x. [DOI] [PMC free article] [PubMed] [Google Scholar]
- 20.Fahmi OA, Ripp SL. Evaluation of models for predicting drug-drug interactions due to induction. Expert Opin Drug Metab Toxicol. 2010;6:1399–416. doi: 10.1517/17425255.2010.516251. [DOI] [PubMed] [Google Scholar]


