

Abstract
AIMS
To investigate inhibitive and inductive effects of tofacitinib (CP-690,550), a Janus kinase inhibitor, on CYP3A4 function via in vitro and in vivo studies.
METHODS
In vitro experiments were conducted to assess the inhibition and induction potential of tofacitinib for major drug metabolizing enzymes (CYP1A2, CYP2B6, CYP2C8, CYP2C9, CYP2C19, CYP2D6 and CYP3A4). A phase 1, randomized, open-label, two-way crossover study (NCT00902460) was conducted to confirm the lack of inhibitive/inductive effect on a sensitive CYP3A4 substrate, midazolam, in healthy subjects. Midazolam pharmacokinetics were assessed over 24 h following single dose 2 mg administration prior to administering tofacitinib and after twice daily dosing of tofacitinib 30 mg for 6 days. The primary endpoint was midazolam area under the concentration–time profile, from time 0 to infinity (AUC(0,∞)).
RESULTS
In vitro studies demonstrated low potential for CYP inhibition (IC50 estimates tofacitinib >30 µm), CYP3A4 mRNA induction (observed at tofacitinib concentrations ≥25 µm) and no effect on enzymatic activity of CYP substrates. In the human study, AUC(0,∞) adjusted geometric mean ratio for midazolam plus tofacitinib to midazolam alone was 103.97% [90% confidence interval (CI) 95.57, 113.12], wholly within the pre-specified acceptance region (80, 125). The 90% CI for the ratio of adjusted geometric means of maximum plasma concentration (Cmax) (95.98, 108.87) was also wholly within this acceptance region.
CONCLUSIONS
These data confirm a lack of an inhibitive or inductive effect of tofacitinib on CYP3A activity in humans and, in conjunction with in vitro data, support the conclusion that tofacitinib is unlikely to influence the CYP enzyme system as a whole.
Keywords: CYP3A, drug–drug interaction, Janus kinase inhibitor, pharmacokinetics and drug metabolism, rheumatology/immunology
WHAT IS ALREADY KNOWN ABOUT THIS SUBJECT
Tofacitinib (CP-690,550) is a novel, oral Janus kinase inhibitor being investigated as a targeted immunomodulator and disease-modifying therapy in rheumatoid arthritis.
Non-renal elimination accounts for 70% of the total clearance of tofacitinib and the metabolism is primarily mediated by cytochrome P450 (CYP) 3A4.
This study was required to determine the effect of tofacitinib on the in vivo pharmacokinetics of a sensitive CYP3A4 substrate.
WHAT THIS STUDY ADDS
The pharmacokinetics of midazolam, a sensitive CYP3A4 substrate, are not altered when co-administered with tofacitinib in healthy subjects.
Tofacitinib is unlikely to affect the clearance of drugs metabolized by CYP enzymes.
There is no need for dose adjustments of CYP substrates when co-administered with tofacitinib.
Introduction
Tofacitinib (CP-690,550) is a novel, oral Janus kinase (JAK) inhibitor that is being investigated as a targeted immunomodulator and disease-modifying therapy in rheumatoid arthritis. Tofacitinib selectively inhibits JAK1, JAK2 and JAK3 in vitro with functional cellular specificity for JAK1 and JAK3 over JAK2 [1]. Inhibition of JAK3, in combination with JAK1, blocks signalling through the common gamma chain-containing cytokines (interleukins [IL]-2, -4, -7, -9, -15 and -21). These cytokines are integral to lymphocyte activation, proliferation and function and, thus, inhibition of JAK1 and JAK3 by tofacitinib may result in therapeutic modulation of immune and inflammatory responses. Tofacitinib is currently in development for the treatment of autoimmune diseases, including rheumatoid arthritis (RA) [2], [3], psoriatic arthritis, psoriasis [4], dry eye and inflammatory bowel disease, as well as the prevention of allograft rejection [5].
The plasma pharmacokinetics (PK) of tofacitinib are characterized by rapid absorption and elimination [6]. Non-renal elimination accounts for 70% of the total clearance of tofacitinib. The metabolism is primarily mediated by cytochrome P450 (CYP) 3A4, with less significant contribution from CYP2C19. The remaining 30% is renally excreted. The potential for tofacitinib to inhibit or induce CYP enzyme activity was investigated using methods that have been described previously [7], [8]. To substantiate the in vitro findings, a human study on the effect of tofacitinib on the PK of midazolam, a sensitive CYP3A4 substrate, was performed.
Midazolam, a short-acting benzodiazepine, is widely used as a regulatory standard for evaluating drug interaction with respect to these CYP isoenzymes [9]. Midazolam is almost completely and rapidly metabolized to two metabolites and, importantly, both metabolic pathways are selectively mediated by CYP3A [10], [11]. Furthermore, midazolam has also been shown to be an appropriate in vivo probe, despite the large interindividual differences found in both intestinal and hepatic CYP3A activity [12], [13]. Studies analysing midazolam as an in vivo probe for CYP3A activity have found it to meet nearly all of the necessary criteria suggested for this application, including correlation with target enzyme activity in liver biopsies, correlation with fractional clearance of other substrates of the target enzyme, reduction when subjects are treated with other substrates and inhibitors of the target enzyme and reduction in patients with severe liver disease [14].
This study was conducted to assess the in vitro metabolic inhibition and induction profiles of tofacitinib and to examine the effect of tofacitinib on the in vivo PK of midazolam in healthy subjects.
Methods
In vitro inhibition and induction
The ability of tofacitinib to inhibit CYP1A2 (phenacetin O-deethylase), CYP2B6 (bupropion hydroxylase), CYP2C8 (amodiaquine N-deethylase), CYP2C9 (diclofenac 4’-hydroxylase), CYP2C19 (S-mephenytoin 4’-hydroxylase), CYP2D6 (dextromethorphan O-deethylase) and CYP3A (felodipine oxidase, midazolam 1’-hydroxylase and testosterone 6β-hydroxylase) was investigated in human microsomes with methods described by Walsky & Obach [8]. The potential of tofacitinib to induce CYP3A4 and CYP1A2 in vitro using immortalized human hepatocytes (the Fa2N-4 cell line) and cryopreserved human hepatocytes was investigated with methods described by Fahmi et al. [7]. All drug/molecular target nomenclature conforms to the BJP's Guide to Receptors and Channels [15].
Subjects
Eligible subjects for the clinical study were healthy adult volunteers aged 18–55 years (males, and females without childbearing potential), with a body mass index of 17.5–30 kg m−2 and a total body weight >50 kg (110 lbs).
Subjects with evidence or history of clinically significant disease or any condition possibly affecting drug absorption were excluded from the study. Other exclusion criteria included clinically significant infections within the past 3 months, any infection within the past 7 days, history of previously untreated infection with Mycobacterium tuberculosis, history of disseminated herpes simplex infection or recurrent/disseminated herpes zoster, personal or family history of hereditary immunodeficiency and use of CYP3A4 inhibitors/inducers, prescription or non-prescription drugs, vitamins and dietary supplements within 28 days or five half-lives (whichever was longer) before the first dose of study medication. Subjects were screened within 28 days before the first dose of study drug.
Clinical study design
This was a phase 1, randomized, open-label, two-way crossover study (A3921059; ClinicalTrials.gov identifier NCT00902460). A sample size of 24 completers (12 subjects per treatment sequence) was determined to provide 91% power that the 90% confidence interval (CI) for the ratio of test (tofacitinib plus midazolam) to reference (midazolam alone) for area under the plasma midazolam concentration–time profile from time zero extrapolated to infinite time (AUC(0,∞)) would lie within the acceptance region (80, 125). This estimate is based on the assumption that the true ratio between test and reference treatments for AUC(0,∞) is 1.05 and within subject standard deviation is estimated as 0.19 for natural log-transformed AUC(0,∞) [16].
Subjects were randomized to receive one of two treatment sequences, each consisting of two treatment periods. In one treatment period, subjects were administered a single oral dose of midazolam syrup 2 mg, and midazolam PK were assessed over the next 24 h. In the other treatment period, subjects were administered tofacitinib 30 mg orally twice daily for 6 days, followed by administration of a concurrent single oral dose of midazolam syrup 2 mg on the morning of day 7. Midazolam PK were assessed over the next 24 h (Table 1). Blood samples for PK analyses were collected pre dose and at 0.5, 1, 2, 3, 4, 6, 8, 10, 12, 16 and 24 h post dose in periods 1 and 2. Plasma was stored at −20°C until assay and samples were assayed within the established stability period.
Table 1.
Treatment sequences
| Sequence | Treatment period 1 | Washout period | Treatment period 2 |
|---|---|---|---|
| 1 | Treatment A | None | Treatment B |
| 2 | Treatment B | Minimum of 7 days | Treatment A |
Treatment A, single administration of midazolam 2 mg syrup orally. Treatment B, administration of tofacitinib 30 mg twice daily orally for 6 days, followed by administration of a concurrent, single dose of midazolam 2 mg syrup orally on the morning of day 7. Dosing with tofacitinib 30 mg twice daily orally continued through the evening dose on day 7.
Safety
The investigator obtained and recorded all adverse events (AEs), the severity of AEs, and provided opinion of the relationship of AEs to study drug. Any serious AEs (SAEs) were to be reported within 24 h to the sponsor. Vital signs (supine blood pressure, pulse rate and oral temperature) were measured throughout. A complete physical examination was carried out on day 0 of period 1 and day 8 of period 2; 12-lead electrocardiography (ECG) at screening and on day 8 of period 2. Clinical laboratory parameters were determined from blood and urine samples obtained at screening, on day 0 of period 1, day 8 of period 2 and at follow-up.
Sampling and analytical methodology
Midazolam samples were assayed using a validated high performance liquid chromatography tandem mass spectrometry assay. Calibration standard responses were linear over the range of 0.05–50 ng ml−1 using a weighted (l/concentration2) linear regression. Those samples with concentrations above the upper limit of quantification were adequately diluted into calibration range. The lower limit of quantitation for midazolam was 0.05 ng ml−1.
Pharmacokinetic parameters
Plasma midazolam PK parameters were calculated for each subject for each treatment using non-compartmental analysis of concentration–time data. The primary PK measure was AUC(0,∞). Secondary PK measures included area under the plasma midazolam concentration–time profile from time zero to the time of the last quantifiable concentration (AUC(0,tlast)), maximum observed plasma midazolam concentration (Cmax), the time point at which Cmax was observed (tmax) and midazolam plasma half-life (t1/2).
Statistical analyses
Natural log-transformed AUC(0,∞), AUC(0,tlast) and Cmax of midazolam were analysed using a mixed effect model with sequence, period and treatment as fixed effects and subject within sequence as a random effect. Midazolam alone was the reference treatment, while midazolam co-administered with tofacitinib was the test treatment. Lack of an interaction on midazolam PK would be demonstrated if the 90% CIs for the ratio of adjusted geometric means (test : reference) for AUC(0,∞) fell wholly within the interval (80, 125).
Ethics
The final protocol, any amendments and informed consent documentation were reviewed and approved by the Institutional Review Board and the Independent Ethics Committee of the investigational centre participating in the study. This study was conducted in compliance with the ethical principles originating in or derived from the Declaration of Helsinki and in compliance with all International Conference on Harmonisation Good Clinical Practice Guidelines.
Results
In vitro inhibition and induction
In vitro inhibition studies assessing tofacitinib potential interactions with major CYP isoenzymes (CYP1A2, CYP2B6, CYP2C8, CYP2C9, CYP2C19, CYP2D6 and CYP3A4) using human liver microsomes demonstrated a low potential for CYP interaction with half maximal inhibitory concentration (IC50) estimates greater than 30 µm against all seven isoforms. In vitro induction experiments investigating tofacitinib at several concentrations (0.78–100 µm) using human hepatocytes demonstrated induction of CYP3A4 messenger ribonucleic acid (mRNA) levels. However, there was no effect on enzymatic activity of the CYP3A substrate, testosterone 6β-hydroxylase. Furthermore, CYP3A4 mRNA induction in vitro was observed only at tofacitinib concentrations at or above 25 µm, which is far in excess of concentrations associated with in vivo efficacy of <1 µm (5 and 10 mg twice daily) [1]. With respect to CYP1A2, tofacitinib did not show induction of either CYP1A2 mRNA levels or activity of the CYP1A2 substrate ethoxyresorufin-O-deethylase.
Subject disposition and demography
Overall, 25 subjects were screened, all of whom were randomly assigned to one of the two treatment sequences. One subject was discontinued from the study due to a protocol violation and was excluded from the PK analyses. A replacement was enrolled and completed the study. Subjects were aged between 22 and 55 years and all were male. Subject demography and baseline characteristics are summarized in Table 2.
Table 2.
Demography and baseline characteristics
| Demographic characteristic parameter | All subjects |
|---|---|
| Number of subjects | 25 |
| Male gender | 25 |
| Age (years) | |
| Mean | 35.0 |
| SD | 10.4 |
| Range | 22–55 |
| Race | |
| White | 9 |
| Black | 8 |
| Asian | 1 |
| Other | 7 |
| Weight (kg) | |
| Mean | 78.0 |
| SD | 9.1 |
| Range | 60.0–97.0 |
| BMI (kg m−2) | |
| Mean | 25.8 |
| SD | 2.6 |
| Range | 20.1–29.6 |
| Height (cm) | |
| Mean | 173.7 |
| SD | 7.0 |
| Range | 164.0–188.0 |
BMI was calculated as weight in kg/(height in cm × 0.01)2. BMI, body mass index; SD, standard deviation.
Pharmacokinetics
Median plasma midazolam concentration–time profiles in the presence and absence of multiple dose tofacitinib were similar (Figure 1). The geometric mean of AUC(0,∞) [% coefficient of variation, calculated as (standard deviation/arithmetic mean) × 100] for midazolam plus tofacitinib and midazolam alone was 26.80 (60) and 26.60 (55) ng h ml−1, respectively (Figure 2). For AUC(0,∞), the ratio of the adjusted geometric means for midazolam plus tofacitinib to midazolam alone was 103.97% (90% CI 95.57, 113.12), which fell wholly within the acceptance region (80, 125). Furthermore, for Cmax, the 90% CI for the ratio of adjusted geometric means (95.98, 108.87) was also wholly within the acceptance region. In addition, that for AUC(0,tlast) was 96.46, 113.13. The distribution summary of midazolam AUC(0,∞) and Cmax is shown in Figure 2, and the descriptive and statistical summaries of the effect of multiple dose tofacitinib on the single dose PK of midazolam are shown in Table 3.
Figure 1.
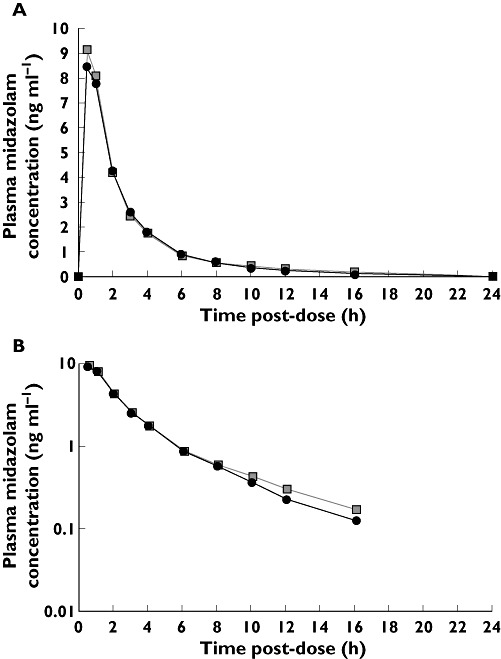
Effect of multiple dose tofacitinib on median plasma concentration of midazolam: (A) linear and (B) semi-log scales for midazolam concentration. Midazolam (2 mg) ( ); Midazolam (2 mg) + tofacitinib (30 mg twice daily) (
 )
)
Figure 2.
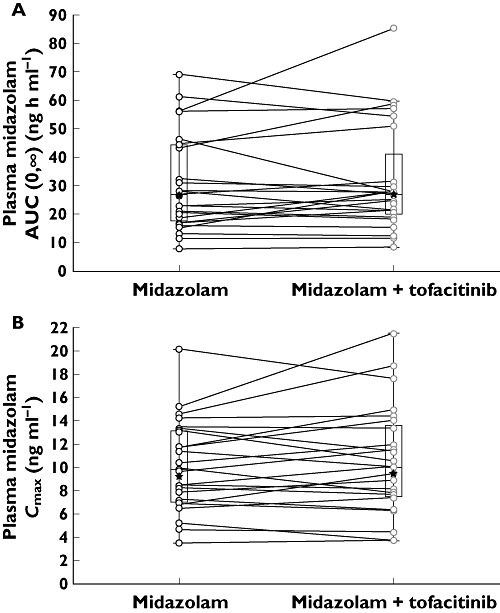
Box-Whisker plot of midazolam: (A) AUC(0,∞) and (B) Cmax. Box plots show median, 25th and 75th percentiles, and Whiskers to the last point within ×1.5 the interquartile range. Stars represent the geometric mean. AUC(0,∞) area under the plasma concentration–time curve from time zero to infinity, Cmax maximum plasma concentration
Table 3.
Effect of multiple dose tofacitinib on the PK of single dose midazolam
| Descriptive summary* | ||
|---|---|---|
| Midazolam (2 mg) + tofacitinib (30 mg twice daily) n = 24 | Midazolam (2 mg) n = 24 | |
| AUC(0,∞) (ng h ml−1) (%CV) | 26.81 (60) | 26.63 (55)† |
| AUC(0,tlast) (ng h ml−1) (%CV) | 26.12 (59) | 25.01 (56) |
| Cmax (ng ml−1) (%CV) | 9.64 (43) | 9.43 (39) |
| tmax (h) (range) | 0.50 (0.50–1.00) | 0.50 (0.50–1.00) |
| t1/2 (h) (%CV) | 4.21 (34) | 4.29 (40)† |
| Statistical summary | ||||
|---|---|---|---|---|
| Midazolam + tofacitinib (test) | Midazolam (reference) | Ratio (test : reference) of adjusted geometric means (%) | 90% CI for ratio (%) | |
| AUC(0,∞) (ng ml−1) | 26.81 | 25.79 | 103.97 | 95.57, 113.12 |
| AUC(0,tlast) (ng h ml−1) | 26.12 | 25.01 | 104.46 | 96.46, 113.13 |
| Cmax (ng ml−1) | 9.63 | 9.43 | 102.22 | 95.98, 108.87 |
Geometric mean (geometric %CV) for all except median (range) for tmax, arithmetic mean (%CV) for t1/2.
n = 23, as these parameters were not reported for one subject for this treatment due to lack of a well-characterized terminal phase in the concentration-time profile. AUC(0,∞) area under the plasma concentration–time profile from time zero extrapolated to infinite time, AUC(0,tlast) area under the plasma concentration–time profile from time zero to the time of the last quantifiable concentration (Clast), Cmax, maximum observed plasma concentration; CI, confidence interval; CV, coefficient of variation; PK, pharmacokinetics; t1/2, terminal half-life; tmax, the time point at which Cmax was observed.
Safety
The most frequently reported treatment emergent, all causality AEs were headache (seven incidences), and nausea, fatigue and dizziness (five incidences each). The most frequently reported treatment emergent, treatment related AEs were headache (seven incidences) and fatigue and dizziness (five incidences each). No severe or serious AEs were reported, and there were no clinically significant changes in vital signs, clinical laboratory parameters or ECG findings.
Discussion
Patients with autoimmune diseases often receive concomitant medications as part of their therapeutic regimen. Thus, new compounds in the therapy area must be subjected to a thorough investigation for potential interactions with other drugs for an assessment of their safety and effectiveness. Such an evaluation may eventually provide quantitative criteria to determine a need for dose alterations for concomitantly administered medications. The current drug interaction study was designed to assess whether tofacitinib can affect the metabolic disposition of co-administered drugs that undergo CYP-mediated elimination.
The collective evidence from in vitro studies predicted that tofacitinib was highly unlikely to show any significant inhibition or induction in vivo. The in vitro inhibition data suggested a low potential for interaction by tofacitinib on the metabolism of co-administered drugs that are primarily metabolized by CYP enzymes. Even though CYP3A4 mRNA induction was observed in vitro, it was only observed at concentrations ≥25 µm, which far exceed the efficacious plasma concentrations of 0.3–0.5 µm[7]. Therefore, these in vitro induction data predicted that tofacitinib also had a very low risk for induction potential at therapeutic concentrations (<1 µm) [1] observed in different patient populations. In addition, the steady-state PK of tofacitinib in humans are predictable based on single dose data, with no evidence of auto-induction [16].
Recent work by Fahmi et al. [7] demonstrated that it is sufficient to measure CYP3A4 mRNA to determine the possibility that a compound will be a potential inducer of other CYP450 enzymes. These studies were conducted with the aim of assessing the induction potency of CYP3A4, CYP2B6, CYP2C9, CYP2C19 and CYP3A5 based on mRNA expression of inducers, identified from the published literature, that have varying levels of pregnane X receptor (PXR/NR1IR) and constitutive androstane receptor (CAR/NR1I3) contributions. In every instance, the increase in CYP3A4 mRNA was greater than the mRNA increases for all other enzymes, suggesting that measurement of CYP3A4 mRNA is sufficient to determine whether a compound has the potential to be an inducer. The relatively higher inducibility of CYP3A is also apparent in data from clinical drug–drug interaction studies in which PK probe substrates for more than one CYP isoform were examined [17]. In all cases, the effect of a given inducer on CYP3A probe substrates was greater than effects on probe substrates for other CYP isoforms. This indicates that for both in vitro and in vivo studies, CYP3A is the most sensitive target of PXR-/CAR-type inducers.
Based on these considerations and following a strategy consistent with the ‘Food and Drug Administration (FDA) decision tree for CYP-based drug–drug interaction studies’[18], midazolam, a highly sensitive CYP3A4 substrate, was selected for further in vivo evaluation. Given the lack of CYP inhibition by tofacitinib, and that measuring CYP3A4 mRNA levels is sufficient and more sensitive than measuring mRNA levels for other CYP enzymes to assess induction potential, the present study helps to rule out other interaction studies with these major drug metabolizing CYP isoforms.
FDA guidance for drug interaction studies recommends the administration of the maximum planned or approved dose of the interacting drug at the shortest dosing interval [18]. This study used tofacitinib 30 mg twice daily, based on the highest anticipated exposure attainable in the different patient populations currently being studied for different indications. Phase 2 studies have included doses of tofacitinib up to 30 mg twice daily. For example, tofacitinib up to 30 mg twice daily was well tolerated in a 6 week phase 2 monotherapy study investigating the efficacy and safety of this compound in patients with active RA [3]. Phase 3 studies are currently investigating 5 and 10 mg twice daily doses in RA [19] and psoriasis (http://www.clinicaltrials.gov; NCT01186744). The treatment duration in the current study was 6 days, which was judged to be sufficient time to ensure that any potential enzyme induction or inhibition by tofacitinib could be evaluated. Midazolam was administered as 2 mg syrup orally, a dose regimen that has been employed safely in many drug–drug interaction studies [20].
In this study, AUC(0,∞) was used solely as a primary endpoint. Cmax was not used due to its dependence on extraneous factors, such as absorption rate that can potentially contribute to a high variability [21]. This, in turn, can artificially inflate the estimate of the sample size required to achieve the desired objectives.
Administration of midazolam alone and with multiple dose tofacitinib produced midazolam AUC(0,∞) adjusted geometric mean ratio 90% CIs that were entirely within the acceptance region. Similar results were observed for Cmax. Thus, these data confirm a lack of interaction of tofacitinib on midazolam PK. Furthermore, using known and predicted PK parameters for tofacitinib [6], [22], [23], SIMCYP® (a population-based PK modelling and simulation programme) was used to simulate the tofacitinib-midazolam clinical interaction. The results indicated a non-significant median change in AUC and Cmax of 1.03 (95% CI 1.01, 1.05), consistent with the observed clinical data [16].
Given the lack of CYP inhibition by tofacitinib and that measuring CYP3A4 mRNA levels is sufficient and more sensitive than measuring mRNA levels for other CYP enzymes to assess induction potential, the present study alone helps rule out other interaction studies, not only with CYP3A4 substrates, but also with substrates of other CYP isoforms. Indeed, the FDA decision tree states that if in vivo studies conducted with the most sensitive probe demonstrate that there is no significant interaction, there is no need to investigate other probes [18]. The midazolam PK profiles with and without tofacitinib are virtually superimposable, thereby permitting the conclusion that CYP3A4 and other isoenzymes are not altered by tofacitinib. The results from this study will be of particular importance for the use of tofacitinib in several disease processes requiring modulation of immunity, where tofacitinib may be co-administered with other therapeutic agents that undergo elimination via the CYP enzyme system.
Adverse events were mostly mild and consistent with those observed in other tofacitinib phase 1 and phase 2 studies, and the single oral dose of midazolam was well tolerated when co-administered with tofacitinib. In conclusion, this study demonstrates that the PK of midazolam are not altered when co-administered with tofacitinib in healthy male subjects, suggesting that tofacitinib is unlikely to affect the clearance of drugs metabolized by CYP enzymes and that there is no need for dose adjustments of CYP substrates when co-administered with tofacitinib.
Acknowledgments
This study was sponsored by Pfizer Inc. The authors would like to thank the A3921059 investigators and study team, and Sherri Boldt for providing the in vitro induction data. Editorial support was provided by Gary Dever, PhD at Complete Medical Communications and was funded by Pfizer Inc.
Competing Interests
The material in this manuscript represents original material and has not been submitted or published elsewhere. The study reported in this manuscript was funded by Pfizer Inc. P. Gupta, C. Alvey, R. Wang, M. E. Dowty, O. A. Fahmi, R. L. Walsky, R. J. Riese and S. Krishnaswami are employees of Pfizer Inc.
REFERENCES
- 1.Meyer DM, Jesson MI, Li X, Elrick MM, Funckes-Shippy CL, Warner JD, Gross CJ, Dowty ME, Ramaiah SK, Hirsch JL, Saabye MJ, Barks JL, Kishore N, Morris DL. Anti-inflammatory activity and neutrophil reductions mediated by the JAK1/JAK3 inhibitor, CP-690,550, in rat adjuvant-induced arthritis. J Inflamm. 2010;7:41. doi: 10.1186/1476-9255-7-41. [DOI] [PMC free article] [PubMed] [Google Scholar]
- 2.Coombs JH, Bloom BJ, Breedveld FC, Fletcher MP, Gruben D, Kremer JM, Burgos-Vargas R, Wilkinson B, Zerbini CAF, Zwillich SH. Improved pain, physical functioning and health status in patients with rheumatoid arthritis treated with CP-690,550, an orally active Janus kinase (JAK) inhibitor: results from a randomised, double-blind, placebo-controlled trial. Ann Rheum Dis. 2010;69:413–6. doi: 10.1136/ard.2009.108159. [DOI] [PubMed] [Google Scholar]
- 3.Kremer JM, Bloom BJ, Breedveld FC, Coombs JH, Fletcher MP, Gruben D, Krishnaswami S, Burgos-Vargas R, Wilkinson B, Zerbini CAF, Zwillich SH. The safety and efficacy of a JAK inhibitor in patients with active rheumatoid arthritis: results of a double-blind, placebo-controlled phase IIa trial of three dose levels of CP-690,550 versus placebo. Arthritis Rheum. 2009;60:1895–905. doi: 10.1002/art.24567. [DOI] [PubMed] [Google Scholar]
- 4.Boy MG, Wang C, Wilkinson BE, Chow VF, Clucas AT, Krueger JG, Gaweco AS, Zwillich SH, Changelian PS, Chan G. Double-blind, placebo-controlled, dose-escalation study to evaluate the pharmacologic effect of CP-690,550 in patients with psoriasis. J Invest Dermatol. 2009;129:2299–302. doi: 10.1038/jid.2009.25. [DOI] [PubMed] [Google Scholar]
- 5.Busque S, Leventhal J, Brennan DC, Steinberg S, Klintmalm G, Shah T, Mulgaonkar S, Bromberg JS, Vincenti F, Hariharan S, Slakey D, Peddi VR, Fisher RA, Lawendy N, Wang C, Chan G. Calcineurin-inhibitor-free immunosuppression based on the JAK inhibitor CP-690,550: a pilot study in de novo kidney allograft recipients. Am J Transplant. 2009;9:1936–45. doi: 10.1111/j.1600-6143.2009.02720.x. [DOI] [PubMed] [Google Scholar]
- 6.Prakash C, Lin J, Chan G, Boy M. Metabolism, pharmacokinetics and excretion of a Janus kinase-3 inhibitor, CP-690,550, in healthy male volunteers. AAPS J. 2008;10:2492A. [Google Scholar]
- 7.Fahmi OA, Kish M, Boldt S, Obach RS. Cytochrome P450 3A4 messenger RNA is a more reliable marker than CYP3A4 activity for detecting PXR-activated induction of drug-metabolizing enzymes. Drug Metab Dispos. 2010;38:1605–11. doi: 10.1124/dmd.110.033126. [DOI] [PubMed] [Google Scholar]
- 8.Walsky RL, Obach RS. Validated assays for human cytochrome P450 activities. Drug Metab Dispos. 2004;32:647–60. doi: 10.1124/dmd.32.6.647. [DOI] [PubMed] [Google Scholar]
- 9.Chung E, Nafziger AN, Kazierad DJ, Bertino JS., Jr Comparison of midazolam and simvastatin as cytochrome P450 3A probes. Clin Pharmacol Ther. 2006;79:350–61. doi: 10.1016/j.clpt.2005.11.016. [DOI] [PubMed] [Google Scholar]
- 10.Gorski JC, Hall SD, Jones DR, Vandenbranden M, Wrighton SA. Regioselective biotransformation of midazolam by members of the human cytochrome P450 3A (CYP3A) subfamily. Biochem Pharmacol. 1994;47:1643–53. doi: 10.1016/0006-2952(94)90543-6. [DOI] [PubMed] [Google Scholar]
- 11.Kronbach T, Mathys D, Umeno M, Gonzalez FJ, Meyer UA. Oxidation of midazolam and triazolam by human liver cytochrome P450IIIA4. Mol Pharmacol. 1989;36:89–96. [PubMed] [Google Scholar]
- 12.Thummel KE, Shen DD, Podoll TD, Kunze KL, Trager WF, Bacchi CE, Marsh CL, McVicar JP, Barr DM, Perkins JD. Use of midazolam as a human cytochrome P450 3A probe: II. Characterization of inter- and intra-individual hepatic CYP3A variability after liver transplantation. J Pharmacol Exp Ther. 1994;271:557–66. [PubMed] [Google Scholar]
- 13.Thummel KE, Shen DD, Podoll TD, Kunze KL, Trager WF, Hartwell PS, Raisys VA, Marsh CL, McVicar JP, Barr DM. Use of midazolam as a human cytochrome P450 3A probe: I. In vitroin vivo correlations in liver transplant patients. J Pharmacol Exp Ther. 1994;271:549–56. [PubMed] [Google Scholar]
- 14.Watkins PB. Noninvasive tests of CYP3A enzymes. Pharmacogenetics. 1994;4:171–84. doi: 10.1097/00008571-199408000-00001. [DOI] [PubMed] [Google Scholar]
- 15.Alexander SPH, Mathie A, Peters JA. Guide to receptors and channels (GRAC), 4th edition. Br J Pharmacol. 2009;158:S1–S254. doi: 10.1111/j.1476-5381.2009.00499.x. [DOI] [PMC free article] [PubMed] [Google Scholar]
- 16.Pfizer Inc. Data on file. 2010.
- 17.Fahmi OA, Ripp S. Evaluation of models for predicting drug-drug interactions due to induction. Expert Opin Drug Metab Toxicol. 2010;6:1399–416. doi: 10.1517/17425255.2010.516251. [DOI] [PubMed] [Google Scholar]
- 18.US Health and Human Services. Food and Drug Administration. Guidance for industry drug interaction studies – study design, data analysis, and implications for dosing and labeling draft guidance. Available at http://www.fda.gov/downloads/Drugs/GuidanceComplianceRegulatoryInformation/Guidances/ucm072101.pdf. Updated 2006 (last accessed 17 May 2011)
- 19.Fleischmann R, Kremer J, Cush J, Schulze-Koops H, Connell CA, Bradley J, Gruben D, Wallenstein G, Zwillich SH, Kanik KS. Phase 3 study of oral JAK inhibitor tasocitinib (CP-690,550) monotherapy in patients with active rheumatoid arthritis. Arthritis Rheum. 2010;62:1. [Google Scholar]
- 20.Lin YS, Lockwood GF, Graham MA, Brian WR, Loi CM, Dobrinska MR, Shen DD, Watkins PB, Wilkinson GR, Kharasch ED, Thummel KE. In-vivo phenotyping for CYP3A by a single-point determination of midazolam plasma concentration. Pharmacogenetics. 2001;11:781–91. doi: 10.1097/00008571-200112000-00006. [DOI] [PubMed] [Google Scholar]
- 21.Gard P. Human Pharmacology (Lifelines) London: Taylor and Francis; 2000. pp. 152–3. [Google Scholar]
- 22.Hutmacher MM, Krishnaswami S, Kowalski KG. Exposure-response modeling using latent variables for the efficacy of a JAK3 inhibitor administered to rheumatoid arthritis patients. J Pharmacokinet Pharmacodyn. 2008;35:139–57. doi: 10.1007/s10928-007-9080-2. [DOI] [PubMed] [Google Scholar]
- 23.Krishnaswami S, Kudlacz E, Yocum S, Dowty M, Alvey C, Wang R, Chan G. Effect of CYP2C19 polymorphism on the pharmacokinetics of CP-690,550, a Janus kinase inhibitor. AAPS J. 2009;11:36A. [Google Scholar]