

Abstract
This paper responds to Thompson and Holland (2011), who challenged our tensor-based morphometry (TBM) method for estimating rates of brain changes in serial MRI from 431 subjects scanned every 6 months, for 2 years. Thompson and Holland noted an unexplained jump in our atrophy rate estimates: an offset between 0-6 months that may bias clinical trial power calculations. We identified why this jump occurs and propose a solution. By enforcing inverse-consistency in our TBM method, the offset dropped from 1.4% to 0.28%, giving plausible anatomical trajectories. Transitivity error accounted for the minimal remaining offset. Drug trial sample size estimates with the revised TBM-derived metrics are highly competitive with other methods, though higher than previously reported sample size estimates by a factor of 1.6 to 2.4. Importantly, estimates are far below those given in the critique. To demonstrate a 25% slowing of atrophic rates with 80% power, 62 AD and 129 MCI subjects would be required for a 2-year trial, and 91 AD and 192 MCI subjects for a 1-year trial.
1. Introduction
This paper responds to a recent commentary in the journal NeuroImage (Thompson and Holland, 2011), regarding the accurate estimation of changes in serial brain MRI scans. Thompson1 and Holland (2011) pointed out an important issue about potential image registration bias when computing changes in brain images, which they noticed in a re-analysis of the data we previously published in NeuroImage (Hua et al., 2010). We carefully studied and agreed with the main argument in Thompson and Holland's letter and have developed a solution to the problem by using inverse-consistent registration. The resulting updated measures from tensor-based morphometry are informative and powerful for use in drug trials to assess factors that affect brain change; sample size estimates remain competitive. Measures from our inverse-consistent algorithm show very good power, and are superior to the adjustments that showed poor statistical power in the Thompson and Holland re-analysis. We would like to thank Thompson and Holland for noting surprising aspects of our prior data and helping us identify and correct them.
Summary of the Problem
1.1 What is tensor-based morphometry?
Tensor-based morphometry (TBM) produces 3D maps of volumetric brain change found by deforming one brain to match another. Individual maps of brain changes (also called Jacobian maps) are aligned to an average group template, and group-wise comparisons can be made using voxel-based statistics. We note, for clarity, that although this general type of analysis is called TBM, many nonlinear image registration methods have been developed to compute brain changes analyzed in this way (e.g., Freeborough and Fox, 1998; Ashburner, 2007; Yanovsky et al., 1999). Klein et al. (2009) recently compared 14 nonlinear registration methods; these algorithms are in a continual state of refinement, with the goal of reducing quantification errors.
1.2 Apparent jump in the rate of atrophy, measured using TBM
In recent work, we computed rates of brain change based on 1309 ADNI MRI scans (Hua et al., 2010) and in accordance with the recommendations of the ADNI project, we made the resulting numeric summaries from our analyses available in a public database (http://adni.loni.ucla.edu). Several ADNI analysis groups also upload numerical summaries from the MRI scans to this database. Because of the unusually large scale of this neuroimaging project, these numeric summaries are frequently replaced or updated over time, and corrected datasets are uploaded as errors in the analyses come to light.
Although TBM produces an entire 3D map of brain changes, most MRI analysis methods compute a single number from each image (such as the volume of the hippocampus; Schuff et al., 2009; Morra et al., 2009a,b). Given the interest in comparing different analysis methods, we examined two different methods to obtain a representative measure of brain change from TBM. First, we computed the average change over an anatomically defined region of interest (ROI), the temporal lobes. As advocated in work on FDG-PET by Eric Reiman and colleagues (Chen et al., 2009), we also used a statistically-defined region of interest (stat-ROI) that selects the regions in the image with greatest effect sizes, based on a pilot analysis of a non-overlapping dataset. This region is then used to compute summaries of changes in other scans. The validity and advantages of the stat-ROI method have previously been discussed (e.g., Chen et al., 2009) and often outperform standard atlas-based ROIs.
In a re-analysis of our numeric summary data from a stat-ROI, which we uploaded to the public ADNI database, Thompson and Holland (2011) noted an unexplained and surprising jump in the time-series of changes. We were able to replicate this effect in our own data, and the graph is shown in Figure 1. Clearly there is an apparent jump in the atrophy rate between 0-6 months, with more linear changes thereafter. The jump occurs in all diagnostic groups – AD, MCI, and controls. In Hua et al. (2010), we showed time-series of cumulative atrophy in MCI and AD. This jump is more coherent with the rest of the trajectory in those groups, and we interpreted it as natural. This was plausible, given the possibility of a biological nonlinear change in the atrophy over time due to changes in the disease process, measurement error, drift in scanner calibration over time and attrition or sampling effects. However, when the trajectory of atrophy from controls is also shown, it becomes clear that there is a systematic bias in the measures of unknown origin.
Figure 1.

TBM-derived summaries of cumulative atrophy in 91 AD, 188 MCI and 152 normal control subjects, based on a statistical region of interest in the temporal lobes (using summary data from Hua et al., 2010; see methods for details). If the 6-12 month change is extrapolated back to the origin, there is an apparent non-zero offset that appears to shift the measures upward by about 1.2-1.4%; a linear regression fitted to all time points would give a smaller offset. The biological trajectory may not be linear over time, but algorithmic sources contributing to this offset are explained and analyzed in this paper. We later show that this offset is reduced to 0.28% using the proposed implementation of inverse-consistent registration to compute the brain changes. The residual (much smaller) offset may be attributed to transitivity errors as well as sampling and biological nonlinearity, as there is no reason to expect the changes to be perfectly linear and to have zero intercept.
1.3 Assessment of the source of the bias
We were alerted to this effect on September 27, 2010 (W. Thompson, personal communication) and conducted a set of experiments that hypothesized, tested, identified and subsequently corrected the source of this problem. We postulate that any bias in atrophy estimates may be comprised of a constant, additive offset, and a component whose magnitude may depend on the true level of atrophy, an atrophy-dependent component. We report our experiments below, which consider factors that might affect the linearity of the time-series. In turn, we discuss various sources of bias as they are relevant to ongoing investigations of brain morphometry by our group and others.
Inverse-consistency. In Hua et al. (2010), we computed atrophy rates using a registration method developed and validated in Yanovsky et al. (2009). This approach estimates the rate of brain change by computing a deformation field that optimizes a matching cost functional, in this case the mutual information (MI) between the deforming image and the target scan, while also optimizing a measure of the regularity of the deformation, called the regularizer. In this case the regularizer is the symmetrized Kullback-Leibler distance, or sKL (and the algorithm is referred to as sKL-MI). While the regularization is symmetrized (and thus inverse-consistent), here the follow-up scans are aligned to the baseline scan, which serves as a registration target. This results in inherent asymmetry in the overall functional being optimized, due to the asymmetric nature of the registration. To address this as a potential issue, we re-implemented the registration method to be fully inverse-consistent by further symmetrizing the MI, which means the computed brain changes (deformations) are forced to be the same if the chronological order of the images is switched; i.e., regardless of which image is the target. As first proposed by Thirion (1998) and later popularized in several papers by Christensen et al. (e.g., Christensen et al., 1999; Christensen and He, 2001), an inverse-consistent registration algorithm gives the same correspondences between the source and target images, even if the order of the images is switched. This does not allow either time-point to have a privileged position in assessment of change, as change is computed in both directions between the two images. An inverse-consistent mapping is typically achieved numerically by mapping the source to the target and the target to the source simultaneously, and reducing the degree of inverse-inconsistency with an explicit regularization term (Johnson and Christensen, 2002; He and Christensen, 2003; Rogelj and Kovacic, 2006; Christensen et al., 2006). Inverse consistency may also be achieved using more complex 4D methods that optimize the geodesic path connecting a pair of images, treated as a full space-time optimization that is symmetric in the inputs (Miller, 2004; Avants et al., 2008; Vercauteren et al., 2008; Miller and Qiu, 2009; Qiu et al., 2009). We studied inverse-consistency extensively in our prior work (e.g., Leow et al., 2007), and found that it could be implemented computationally without the need to use an explicit inverse-consistency regularization, through a numerical method known as equivalent perturbation (Leow et al., 2007). Even so, in our published work with sKL-MI, we did not use an inverse-consistent version of the algorithm for the matching cost functional, which, as shown below, accounts for all but 0.28% of the offset in atrophy rates. In our tests below, the additive bias in atrophy estimation was largely eliminated by using an inverse-consistent implementation of sKL-MI: reduced from 1.4% to 0.28%. Thus, we conclude that inverse-consistent implementation should be preferred in future analyses. To assess the contribution of inverse-consistency error to the mappings, we recomputed trajectories of atrophy rates. Using inverse consistency error (ICE) maps, we also verified that our new equivalent perturbation version of the sKL-MI method (ic-sKL-MI) enforces zero inverse consistency error across the brain, to within a few thousandths of a voxel.
-
Statistical region of interest. We studied whether the bias (non-zero intercept) in the time-series is affected by the use of a statistical region of interest. By non-zero intercept, we mean that, if the trajectory of atrophy over time is approximated by a straight line, the line should hit the y-axis at a point that is not significantly different from zero. Because the stat-ROI is defined based on regions that change the most (strictly speaking, voxels with greatest effect sizes for changes between the time-points in AD), the use of a stat-ROI may pick up a biologically plausible nonlinearity in the rate of regional atrophy, which could represent biological truth rather than algorithmic error. For example, if the same stat-ROI is applied to summarize maps of brain change from all time points, the trajectory may still appear to be nonlinear if the focus of atrophy moves to a different part of the brain over time (e.g., if it moves out of the statistical ROI).
The region of fastest ongoing atrophy in Alzheimer's disease moves rapidly over a period of 1.5 years from the temporal lobes to other cortices as the disease progresses (Thompson et al., 2003; see also Smith, 2002; Whitwell et al., 2007). Scahill et al. (2002) also noted that, using fluid registration of serial MRI scans, the focus of atrophy in the brain changes as the disease advances, and this is in line with the spreading trajectory of pathology (Braak and Braak, 1991). Given our knowledge of atrophy in normal aging (Sowell et al., 2003), this shifting effect is expected to be minimal over the 2-year time-span of this study. To avoid correcting for atrophy that is truly biologically nonlinear, such as that due to an anatomically spreading or shifting disease process, we assessed the effects of atrophy in control subjects (N=152) in addition to assessing the same issues in MCI and AD.
Transitivity error. As noted by Christensen and Johnson (2001) [see also Johnson and Christensen, 2002; Geng et al., 2005, and the PhD thesis by Geng (2007)] one desirable property of a registration algorithm is that it creates mappings that are transitive. Few existing registration algorithms are transitive, but most will give mappings that are fairly close to transitive. In our context of mapping brain change, transitivity means that the total amount of change found when matching baseline (0 month) to 24-month follow-up scans should be the same as would be found by matching 0 to 12-month follow-up scans, and then matching 12- to 24-month scans, and concatenating the results. Any discrepancy between the direct and indirect mappings may be used to compute the transitivity error (as detailed below in the Methods). In theory, this may lead to an additive or multiplicative bias present in all mappings, which may or may not correlate with the true amount of change, or with the estimated amount of change. Very few registration algorithms are forced to be transitive by design (see Skrinjar et al., 2004, 2008; Tagare et al., 2006; Geng, 2007, for exceptions). To assess this, we examined the contributions of this source of error (transitivity error) to the mapping of serial changes. We also tested if this error was correlated with the estimated overall amount of change.
2. Methods
As in our prior work (Hua et al., 2010), we used tensor-based morphometry (TBM) to map the 3D profile of progressive atrophy in 91 subjects with probable AD (age: 75.4±7.5 years), and 188 with amnestic mild cognitive impairment (MCI; 74.6±7.1 years), scanned at 0, 6, 12, 18 and 24 months (in ADNI, only the MCI subjects were scanned at 18 month intervals). In the current analysis, we added 152 healthy controls (age: 76.0±4.8 years), scanned at 0, 6, 12, and 24 months. To avoid sampling different individuals at each time-point, we included only those subjects who were scanned at all time-points. At the time of writing, far fewer people had been scanned at 36 months, so we did not include this time point in our analysis. The inclusion of only those subjects with scans at all time-points could have under-sampled people whose atrophy was progressing more quickly and were more likely to drop out of the study (Scahill et al., 2002). So, a sampling bias cannot be absolutely eliminated, and there may be sources of nonlinearity in the trajectory of atrophy that cannot be entirely modeled or explained.
Individual maps of atrophy rates (also known as “Jacobian maps”) were derived from a TBM analysis of MRI scans acquired over time. These maps represent the rates of tissue shrinkage (or CSF space expansion) at each voxel location in the brain.
We compared two registration methods to assess brain changes over time:
2.1 sKL-MI. (Yanovsky et al., 2009)
This method nonlinearly warps the follow-up scan to match the baseline scan of the same individual, driven by a mutual information cost function, and a regularizing term called the symmetrized Kullback-Leibler (sKL-MI) distance (Yanovsky, et al., 2009). This method was used to compute change over time in our earlier paper (Hua et al., 2010). While the penalty term (the symmetric Kullback-Leibler distance) is designed to be inverse consistent, there is no explicit constraint in this method to ensure inverse-consistency on the matching cost function.
2.2 ic-sKL-MI
An inverse consistent implementation of sKL-MI was implemented (by B.G.). Distinct from other implementations of inverse consistency, instead of reducing the inverse consistency error, we completely eliminate it, using the equivalent perturbation method introduced in Leow et al. (2007). In early work by Christensen and Johnson (2001), the inverse-consistency error of a nonlinear registration algorithm was penalized, but not reduced to zero, by defining the following energies (or costs to be minimized) on the forward and backward mappings:
Here (as in Leow et al., 2007), T (target) and S (source) are the images to be registered, both defined on a computational domain, Ω, h is the forward transform from the source to the target, g is the backward transform from the target to the source, R is the regularizer and λ and ρ are weighting terms. As noted by us in Leow et al. (2007) and by Avants et al. (2008), this will not entirely remove the inverse consistency error. Instead we consider an infinitesimal perturbation ξ applied to the inverse mapping, and solve for η, the perturbation in the forward mapping that preserves the fact that the forward-backward mapping pair h and h-1 stay inverses of each other. Thus, the composition of the two perturbations ought to approach the identity mapping in the limit:
As previously shown, η(x) = −D(h(x)) ξ (h(x)), where Dh is the Jacobian matrix of h with (i,j)th element ∂hi/∂xj, so we can then compute a forward equivalent of a body force in the backward direction, using only the forward mapping h, and not involving h-1. This circumvents numerical errors incurred when performing numerical inversion operations to go between h and h-1.
2.3 Mean template construction
All subjects' maps of brain change were registered to a mean deformation template (MDT) based on 40 subjects from the study, as in Hua et al. (2009). The MDT represented the average shape of 40 healthy elderly controls; the procedure to construct the MDT is detailed in (Hua et al., 2008a,b). The mean template does not affect the estimates of atrophy rates in each person. Average Jacobian maps were computed by taking the mean at each voxel of the Jacobian maps across subjects.
2.4 Sample size estimates (n80)
A power analysis was established by the ADNI Biostatistics Core to estimate the minimal sample size required to detect, with 80% power, a 25% reduction in the mean annual change, using a two-sided test and standard significance level (α=0.05) for a hypothetical two-arm study (treatment versus placebo). The estimated minimum sample size for each arm was computed with the formula below. Briefly, β denotes the estimated annual change (average of the group) and σD refers to the standard deviation of the rate of atrophy across subjects.
Here zα is the value of the standard normal distribution for which P[Z < zα]=α (Rosner, 1990). The sample size required to achieve 80% power was computed, denoted by n80. We note in passing that this is a linearization of the exact expression for statistical power.
2.5 Statistical analyses
We performed several statistical analyses to assess factors influencing the linearity of the brain changes over time, and the effect sizes of the resulting measures of atrophy. We assessed brain changes in anatomical and statistical regions of interest. A statistically-defined region of interest (stat-ROI) was based on voxels with significant atrophic rates over time (p < 0.001 or p<0.0001, uncorrected) within the temporal lobes. This was established in a non-overlapping training set of 20 AD patients (age at baseline: 74.8 ± 6.3 years; 7 men and 13 women) scanned at baseline and 12 months. The anatomical ROI included the temporal lobe gray matter, a region typically providing the highest statistical power for tracking AD progression (Jack et al., 1998). This procedure is detailed in (Chen et al., 2009, Hua et al., 2009, 2010). A numerical summary of the atrophic rate, in the temporal lobes, was computed by taking the arithmetic mean of Jacobian values within the corresponding stat-ROI or anatomical ROI (Hua et al., 2009, 2010), giving a single rate-of-atrophy score for each individual. An evidence for an offset at time zero (which may arise from the method and/or biological nonlinearity) was estimated by fitting a linear mixed effects model through (1) measures of cumulative atrophy at 6, 12, and 24 months but leaving out the data point at baseline, (2) measures of cumulative atrophy at 6, 12, and 24 months and the known data point at time zero (having a zero change at month zero is known), in the control group (n=152). The lmer and other statistical functions from the R statistical package (version 2.10.1: library (lme4)) were used to estimate the intercept (offset at month zero) and 95% confidence intervals.
We hypothesized that inverse-consistent registration would:
yield temporal trajectories of atrophy with a greatly reduced offset close to zero;
yield sample size estimates (n80) with substantial power, considerably better than those computed from our previously reported data by Thompson and Holland (2011), although somewhat lower than those computed using sKL-MI.
3. Results
3.1 Numerical inverse consistency
To show that our inverse-consistent registration algorithm ic-sKL-MI indeed created maps that are inverse-consistent, we made a map of the inverse consistency error, ICE = ‖x − h*h-1(x)‖ where h is the mapping from one time point to another, and h-1 is the mapping computed in reverse (i.e., by the algorithm applied to the same scans, but with the order of the scans switched). A typical map is shown in Figure 2(a), showing that the ICE is around 0.005mm or lower, throughout the brain, with higher values in the scalp or other non-brain regions where signals are not important and contrast is less consistently controlled over time. The backward mapping is within a few thousandths of a millimeter of the inverse of the forward mapping across the entire 3D volume of the brain. Since many voxels undergo very small deformations, it is also instructive to assess the relative inverse consistency error, or ICE/‖h‖. Figure 2(c) shows that relative error is well below 5% of the measured change and much less in most voxels.
Figure 2. Measures of inverse consistency.

(a) Map of inverse consistency error. The inverse consistency error is less than a few thousandths of a millimeter, except outside the brain, in a typical, representative mapping from a control individual scanned twice with a 12-month interval. (b) Map of ||Dh| − |D(inv(h−1)||, for the image in (a). On average, the error within the brain is on the order of 0.1% change, likely to be reduced during Jacobian integration over an ROI. Thus, ICE is unlikely to be the major factor contributing to the remaining nonlinearity in the data, which is very small and may reflect sampling, biological nonlinearities, or other factors. (c) Map of relative inverse consistency error, ICE/‖u‖. Relative error is under 5%, and much lower in the vast majority of the image. This upper bound on the inverse consistency error is well below 5% of the measured displacement all over the brain, regardless of whether the displacement is small or large.
As it is difficult to relate error in displacement fields to error in Jacobian determinants directly, we estimated the effect of ICE on Jacobians empirically. Figure 2(b) shows the map of ||Dh| − |D(inv(h−1)||; here, the outer brackets mean absolute value, and inner brackets mean determinant. Note that using the direct numerical inversion inv() creates additional numerical error, so this estimate is pessimistic. Still, the map shows that within the brain, absolute error is on the order of 0.1% change or less. When one integrates over a large ROI, this error is likely to be reduced substantially due to averaging effects.
3.2 Improved linearity of cumulative brain atrophy using inverse-consistent registration, with reduced offset
As shown in Figure 3, brain changes recovered by the ic-sKL-MI method show substantially reduced offsets. By extrapolating back from the 6-12 month interval, the offset in the change measures is very small – around 0.28% for the temporal lobe gray matter ROI, and statistical ROI (Figure 3), compared with the 1.2-1.4% offset for brain change measures computed with sKL-MI (Figure 1). Clearly, this is greatly reduced, and amounts to a displacement field error of a few thousandths of a millimeter in a 1-mm MRI voxel. As any biological sample is heterogeneous, a linearized plot through the mean atrophy rate data will not run through zero exactly.
Figure 3.
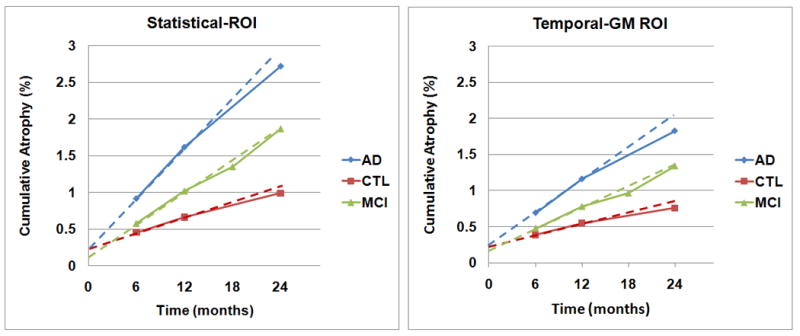
With inverse-consistent registration, the offset is greatly reduced, to around 0.1-0.3% for a statistical region of interest in the temporal lobes (left panel), and 0.15-0.25% for the temporal lobe gray matter (Temporal-GM; right panel). This offset is explainable in terms of statistical variability in the sample (Figure 4), and transitivity error, which is low (Figures 5 and 6). Cumulative atrophy in both ROIs is roughly linear. We do not expect numerical summaries in a pre-defined ROI to give entirely linear trajectories as the focus of atrophy defined at any one time point does not remain identical over time – it spreads out. For that reason, a statistical ROI based on the 1-year follow-up may catch greater atrophy over intervals that lie within that one year, and lesser ongoing atrophy thereafter; to boost statistical power, it is created with a deliberate selection approach to detect voxels with greatest atrophy occurring over one year. In ADNI, controls and AD patients are not scanned at the 18-month time-point.
In Figure 4, offsets are measured based on best linear fit to all the data points at 6, 12, and 24 months in the control group only (n=152), as their trajectory is thought to be linear. The fitted intercepts and the 95% confidence intervals based on control subjects are (a) statistical ROI: 0.29% [0.15, 0.44], (b) temporal lobe gray matter: 0.28% [0.15, 0.42], (c) statistical ROI including the known data point at baseline: 0.12% [0.05, 0.19], (d) temporal lobe gray matter including the known data point at baseline: 0.11% [0.04, 0.18].
Figure 4.

Cumulative atrophy shows a linear trend in controls (n=152) - the same data set of controls as used in Figure 3. The black line shows the best linear fit to all the data points using linear mixed effects model. The top panels are based on measures of cumulative atrophy at 6, 12, and 24 months inside the statistical ROI (a) and temporal lobe gray matter (b). Regressions in this first row leave out the known data point of zero change at baseline, to see what intercept would be inferred from the other data points. The bottom panels (c), (d) include the known data point at baseline (where the change is zero by definition) but do not force the line through the origin. Intercept estimates are (a) statistical ROI: 0.29% (95% CI [0.15, 0.44]), (b) temporal lobe gray matter: 0.28% (95% CI [0.15, 0.42]), (c) statistical ROI including the known data point at baseline: 0.12% (95% CI [0.05, 0.19]), (d) temporal lobe gray matter including the known data point at baseline: 0.11% (95% CI [0.04, 0.18]). The red dotted lines show the 95% confidence interval of the regression line. The plots are generated by R using the lme4 package. This plot demonstrates the heterogeneity of any biological sample. Some outliers may influence the intercept (see the lowest and highest points at 6 months).
3.3 Statistical power
Power estimates based on our inverse consistent measures are shown in Table 1. To demonstrate a 25% slowing of atrophy rates with 80% power, 62 AD and 129 MCI subjects would be required for a 2-year trial, and 91 AD and 192 subjects for a 1-year trial. These are 1.6-2.4 times higher than our previously estimated sample sizes, but not 5-16 times higher as alleged in the Thompson and Holland (2011) analysis. The difference is accounted for by using inverse-consistent registration to compute brain changes.
Table 1. Sample size estimates for drug trials.
Here we show the estimated sample sizes required to detect a 25% slowing in the atrophic rate, with 80% power, for AD and MCI subjects. Sample sizes are smaller for AD than MCI, and not very different for statistical versus standard ROIs. These are highly competitive with other methods.
| 24 months, using a statistical ROI* | 12 months, using a statistical ROI* | 24 months, Temporal Lobe Gray Matter | 12 months, Temporal Lobe Gray Matter | |
|---|---|---|---|---|
| AD (N=91) | 62 | 91 | 86 | 118 |
| MCI (N=188) | 129 | 192 | 161 | 251 |
implies using a single statistical ROI based on the 12-month change maps, thresholded at p<0.0001, uncorrected. The same statistical ROI was applied to all scans, for consistency. The interpretation of these estimates was heavily qualified in our prior papers; the confidence intervals show that they should not be considered precise figures.
As shown in Table 2, across the same set of subjects in AD, MCI, and CTL, longer intervals led to greater amount of atrophy measured in the statistical-ROI and temporal gray matter, resulting in smaller sample size estimates.
Table 2.
Numerical values of the cumulative atrophy, as a percentage, as a mean loss (x̄) - the negative sign is omitted here - and standard deviation (s). The 95% confidence interval (c) for the n80 sample size measure was estimated from 10,000 bootstrapped samples.
| 6-month | 12-month | 18-month | 24-month | ||||||||||
|---|---|---|---|---|---|---|---|---|---|---|---|---|---|
| x̄ | s | c | x̄ | s | c | x̄ | s | c | x̄ | s | c | ||
| AD | Stat-ROI | 0.9 | 1.0 | [178,588] | 1.6 | 1.0 | [68,146] |

|
2.7 | 1.3 | [46,90] | ||
| Temp-GM | 0.7 | 0.9 | [240,1039] | 1.2 | 0.8 | [86,203] | 1.8 | 1.1 | [62,167] | ||||
| MCI | Stat-ROI | 0.6 | 0.9 | [373,1122] | 1.0 | 0.9 | [146,265] | 1.4 | 1.1 | [129,260] | 1.9 | 1.3 | [98,200] |
| Temp-GM | 0.5 | 0.8 | [412,1326] | 0.8 | 0.8 | [190,382] | 1.0 | 0.9 | [166,384] | 1.3 | 1.1 | [115,287] | |
| CTL | Stat-ROI | 0.5 | 0.7 | [386,1548] | 0.7 | 0.8 | [226,882] |
|
1.0 | 0.8 | [130,314] | ||
| Temp-GM | 0.4 | 0.7 | [477,2254] | 0.6 | 0.8 | [297,1322] | 0.8 | 0.8 | [177,484] | ||||
3.4 Assessment of transitivity errors
As shown in Figure 5, we computed a map of the voxelwise transitivity errors. To define these, we label the 0, 12, and 24 month scans in a given subject as A, B, and C, respectively; we compute the deformation mappings between these time points: hAB, hAC and hBC. The transitivity error, at each point in the brain, is defined as the difference between the Jacobians of the direct mapping (from A to C) and the composed mapping (from A to C via B):
Figure 5. Transitivity error is small and sufficient to account for the remaining intercept of up to 0.3%.

Here we show maps of the average change over 2 years. Blue colors (top left) show cumulative atrophy of around 2-10% in AD, and red colors show ventricular expansion of around 10%. The transitivity error map is typically around 0.2-0.3%, accounting for under one tenth of the signal; regional summaries are shown in Figure 6. The transitivity error is generally positive, showing that the direct mapping (which is used to estimate atrophy) shows slightly less change than the composition of mappings from 0 to 12, and 12 to 24 months. This is natural, as there will be some errors associated with each of the components of the composed mappings. There may also be biological departure from perfect linearity in the anatomical deformations, making the direct mapping to the 2-year time point shorter than constructing the mapping via the 1-year time-point.
As shown in Figure 5, the transitivity error is small in all areas of the brain, around 20 times smaller than the estimate of the true change. We were able to confirm that the mean transitivity error was typically around 0.2-0.4%, regardless of whether a standard anatomical or statistical ROI is used (see Figure 6). This error accounts for most of the remaining offset in the data of around 0.28% in Figure 3. As this error is weakly correlated with the true biological change, subtracting it may even reduce the discriminative power of the measures.
Figure 6.

Transitivity Errors (TE) plotted versus the true change (true change = J(hAC)-TE) in both temporal lobe and statistical ROIs. The transitivity error (y-axis) is plotted on a scale 10 times smaller than the true change (x-axis). This error is typically a very small contributor to the overall change, with typical values of around 0.2%-0.3%, or 7-10% of the overall change. This small error accounts for the remaining offset in the data. Clearly, the TE is weakly correlated with the true change, so subtracting it may even reduce the discriminative power of the measures. It can be eliminated with highly CPU-intensive group-wise registration schemes (see Discussion).
4. Discussion
First, we are grateful to Thompson and Holland (2011) for pointing out the nonlinear offset of 1.2-1.4% in our previously reported atrophy rate measures. Although some of this offset may result from biological sources, we showed that the intercept from all sources (including biological departures from linearity) is only 0.28% when using inverse-consistent registration to estimate the brain changes. Inverse-consistency errors in our new measures of change were effectively zero throughout the brain (Figure 2). With these measures of change, our power estimates for clinical trials were competitive with others in the literature. To demonstrate a 25% slowing of atrophic rates with 80% power, 62 AD and 129 MCI subjects would be required for a 2-year trial, and 91 AD and 192 subjects for a 1-year trial. These are 1.6-2.4 times higher than our prior sample size estimates, but not 5-16 times higher as alleged in the Thompson and Holland (2011) analysis of our prior numeric summaries. Power was re-gained by using inverse-consistent registration to compute the brain changes.
Some re-interpretation of past results is warranted in the light of these new estimates, and we suggest that our new table (Table 2) should be consulted first, in order to appreciate the very wide range of the confidence intervals on these sample size estimates. Although the notion of inverse consistency is important, it is noteworthy how little the sample size estimates have changed relative to the very large known uncertainty of the estimator itself, which is given by its 95% CI. Any future clinical trial using this kind of estimate would be expected to base their power predictions on both the upper and lower confidence limits. Specifically, in almost all of our prior TBM papers, including those initially published in ADNI (Leow et al., 2006; Hua et al., 2008a, Hua et al., 2008b), we used a 3D inverse-consistent elastic registration method to measure change, known as 3DMI (Leow et al., 2005). As shown formally and with substantial empirical data in Leow et al. (2007), inverse consistency is numerically enforced. More recently, there were four published papers in which we changed our registration method to sKL-MI (Yanovsky et al., 2009), because it appeared to offer more desirable properties such as formal mathematical symmetry. An independent study by Tagare et al. (2006, 2009) noted that sKL, as we formulated it in (Yanovsky et al., 2009) is advantageous, as it is an inherently symmetric cost function. We reported sample size estimates from sKL-derived registrations in two papers: Hua et al. (2009) and (2010), so these estimates may need to be revised upwards. In addition, there is reference to sKL-derived power estimates in Kohannim et al. (2009) and Ho et al. (2010). Our new findings regarding registration asymmetry would suggest that the sample size estimates in those papers should be roughly doubled, while bearing in mind that there is still a 4-5 fold difference in the upper and lower confidence limits, reported here and in the past, so the measures should not be treated as if they are precise in any case.
4.1. Symmetry and inverse-consistency
The results of our registration methods are inverse-consistent, i.e., symmetrical: findings are the same regardless of the order of the images. In general, a registration algorithm will not automatically be symmetric; to achieve symmetry, it requires either equivalent perturbation methods (which we used), or a full space-time (4D) optimization for every pair of images (as is done by the SyN algorithm by Avants et al., 2008, for example).
4.2. Transitivity
Transitivity error is another source of error in maps of brain change. In our experiments, this contributes about 0.28% to the observed changes, or a few thousandths of a millimeter in a typical 1-mm MRI voxel. Further reducing transitivity errors requires elaborate registration schemes that include even more penalty functions to adjust the registrations based on more than two input images - such as registering sets of images in groups of three (Geng, 2007). Transform reconciliation (Woods et al., 1998), and group-wise registration methods (Leporé et al., 2008), compute a set of mappings between all N brains in a study, and use the internal consistency among mappings as a means to reduce errors, or simply to redistribute the mean error among all the mappings. In Leporé et al. (2008), we proposed a method called multi-atlas tensor-based morphometry; this uses groupwise registration to reduce the error and boost statistical power in a cross-sectional TBM study. At the expense of very high computational times, we mapped every brain in the study to all others, and used arithmetic relations among mappings to reduce errors. Such highly CPU-intensive groupwise registration methods are more appropriate for small studies, and not yet realistic to apply to datasets the size of ADNI. One promising groupwise registration method is hierarchical correspondence detection by clustering (Wu et al., 2010a,b). This identifies which correspondences in a set of subjects are robust, and uses them to guide anatomical correspondence detection among all subjects, and across time-points. A second way to achieve formally transitive registration is to use a registration target different from all brains in the study, and compute mappings between brains by concatenating the maps to this target and their inverses (Skrinjar et al., 2010). Such a method is formally transitive, yet borders on being exhaustive algorithmically and may result in more overall error in individual mappings.
4.3. Biological nonlinearity
By expecting linear trajectories for the measures of atrophy over time, as is implied by Thompson and Holland (2011), it is assumed that the atrophy rate remains constant, at least in aggregate, across a group. In 39 healthy controls (aged 31-84), a paper by another research group on a different sample, Scahill et al. (2003), found that rates of changes accelerated, especially after 70 years of age, in the ventricles (p<0.001) and hippocampi (p=0.01). At the time of writing (December 2010), to the best of our knowledge, there are no other voxel-based brain mapping studies from ADNI that use more than two time-points. Schuff et al. (2009) and McEvoy et al. (2009) published the only two studies we know of that examined more than two ADNI time-points. Schuff et al. (2009) examined hippocampal volume in 112 normal elderly, 226 MCI and 96 AD patients who all had at least three successive MRI scans at 0, 6 and 12 months. In both MCI and AD (p=0.0001), but not in normal controls, rates of hippocampal loss were slightly faster in the 6-12 than the 0-6 month interval. McEvoy et al. (2009) reported changes in various ROIs between 0-6 and 6-12 months. In that paper, if lines were drawn connecting the mean values at the 6 and 12 month time points, and extrapolated back to zero, many would not pass through zero (see Figure 7 in that paper). Depending on the ROI chosen, the changes in the second six months are between half and double the changes occurring over the first six months. This suggests caution in ascribing too much meaning to small intercepts that are extrapolated using linear assumptions, based on data that clearly depend on the sample of subjects assessed and the region chosen.
Longitudinal MRI studies at multiple time-points indicate that overall brain volume loss, in general (Chan et al., 2003; Carlson et al., 2008), and hippocampal volume loss, in particular (Ridha et al., 2006; Jack et al., 2008), may accelerate in patients with MCI and Alzheimer's disease, but many of these studies have follow up intervals as long as 10 years. As this acceleration effect is not detected in our data, people with accelerating atrophy may either (1) participate in ADNI in lower proportions or drop out in higher proportions than those with linear or decelerating atrophy, or (2) be less likely to have a full-time series of scans every 6 months for 2 years due to their rapidly accelerating disease progression. Analysis of later ADNI time-points with multiple methods should shed light on this unresolved question.
4.4. The Yushkevich and Tagare Effects
Yushkevich et al. (2010) noted one potential source of bias in longitudinal image analysis, arising from differences in interpolating baseline and follow-up images after global normalization. In our own registration pipelines (here and previously), this specific problem noted by Yushkevich et al. (2010) was not an issue, as our baseline and follow-up images were treated equivalently during re-alignment, re-sampling and interpolation. Related to our argument in Leow et al. (2007), Tagare et al. (2009) noted that almost all registration algorithms compute correspondences between images by summing up quantities in the coordinate system of one image (the source), the other (the target) or both. He notes that our original cost function, sKL-MI, introduced in Yanovsky et al. (2009), is formally symmetric, while many others - that are now widely used - are not. He proposed a numerical scheme to guarantee symmetry by computing all quantities (including the intensity matching term) in a coordinate system that is weighted using the Jacobian determinant. He also advocates using a specific differential form (a concept from exterior calculus) when computing registration cost functions, such as intensity correspondence and smoothness of the warp (cf. Cachier and Rey, 2000). We tried this in our nonlinear registration work by using the square-root of the Jacobian to weight volumetric integrals (Leow et al., 2007; cf. Noblet et al., 2008). We have not explored its empirical consequences here, but it may boost power in clinical applications of TBM. Extremely computationally demanding 4D methods have also been proposed, that use a subject's entire 4D time-series to infer a continuous evolution of shapes or “hyper-templates” from a set of observations of the same subject (Durrleman et al., 2009; Avants et al., 2010; Khan et al., 2010). When Lorenzi et al. (2010) analyzed ADNI data from 8 MCI subjects at 4 time-points, they noted extremely erratic trajectories for brain change (Fig. 3 of that paper) that they smoothed by fitting a velocity field through all the images. Use of a full time-series for hundreds of subjects is computationally difficult and has not been attempted on datasets the size of ADNI; it also requires re-processing of all time-points when a new scan comes in from one subject.
Summary
In addition to offering high power to assess factors influencing brain change, TBM provides 3D anatomical maps showing the region and rate of brain changes, which are not necessarily provided by other numeric summary methods. As noted by Scahill et al. (2002) in their early work on AD with fluid registration, having maps of changes is advisable for treatment trials, in case treatments show region-specific effects, or beneficial effects in regions not surveyed or anticipated when focusing on a volume measure for a pre-selected region. Therefore, it seems reasonable to use TBM for longitudinal estimation of atrophy, so long as possible confounds and sources of error are recognized when interpreting the estimated changes.
Acknowledgments
We thank Wes Thompson and Dominic Holland for noticing surprising aspects of our prior data that we address here. Data collection and sharing for this project was funded by the Alzheimer's Disease Neuroimaging Initiative (ADNI) (National Institutes of Health Grant U01 AG024904). ADNI is funded by the National Institute on Aging, the National Institute of Biomedical Imaging and Bioengineering, and through generous contributions from the following: Abbott, AstraZeneca AB, Bayer Schering Pharma AG, Bristol-Myers Squibb, Eisai Global Clinical Development, Elan Corporation, Genentech, GE Healthcare, GlaxoSmithKline, Innogenetics, Johnson and Johnson, Eli Lilly and Co., Medpace, Inc., Merck and Co., Inc., Novartis AG, Pfizer Inc, F. Hoffman-La Roche, Schering-Plough, Synarc, Inc., and Wyeth, as well as non-profit partners the Alzheimer's Association and Alzheimer's Drug Discovery Foundation, with participation from the U.S. Food and Drug Administration. Private sector contributions to ADNI are facilitated by the Foundation for the National Institutes of Health (www.fnih.org <http://www.fnih.org>). The grantee organization is the Northern California Institute for Research and Education, and the study is coordinated by the Alzheimer's Disease Cooperative Study at the University of California, San Diego. ADNI data are disseminated by the Laboratory of Neuro Imaging at the University of California, Los Angeles. This research was also supported by NIH grants P30 AG010129, K01 AG030514, and the Dana Foundation. Algorithm development and image analysis for this study was funded by grants to P.T. from the NIBIB (R01 EB007813, R01 EB008281, R01 EB008432), NICHD (R01 HD050735), and NIA (R01 AG020098).
This is a reply to the commentary Thompson WK, Holland D; Alzheimer's Disease Neuroimaging Initiative. Bias in tensor based morphometry Stat-ROI measures may result in unrealistic power estimates.Neuroimage. 2011 July 1; 57(1): 1-4. 21349340
Footnotes
We note for clarity that the corresponding author of this paper is Paul Thompson (UCLA School of Medicine), and we are responding to a letter by Wes Thompson (no relation) and Dominic Holland of UC San Diego.
Author Contributions: Author contributions were as follows: XH, BG, CB, PR, AL, AK, IY, AT, and PT performed the image analyses, algorithm developments and evaluations; CJ, NS, GE, KC, ER, and MW contributed substantially to the image and data acquisition, study design, quality control, calibration and pre-processing, databasing and image analysis. We thank Anders Dale for his contributions to the image pre-processing and the ADNI project. We thank Jason Stein, Neda Jahanshad, and Sarah Madsen for their comments on this manuscript.
Publisher's Disclaimer: This is a PDF file of an unedited manuscript that has been accepted for publication. As a service to our customers we are providing this early version of the manuscript. The manuscript will undergo copyediting, typesetting, and review of the resulting proof before it is published in its final citable form. Please note that during the production process errors may be discovered which could affect the content, and all legal disclaimers that apply to the journal pertain.
References
- Ashburner J. A fast diffeomorphic image registration algorithm. Neuroimage. 2007;38(1):95–113. doi: 10.1016/j.neuroimage.2007.07.007. 15. [DOI] [PubMed] [Google Scholar]
- Avants B, Cook PA, McMillan C, Grossman M, Tustison NJ, Zheng Y, Gee JC. Sparse unbiased analysis of anatomical variance in longitudinal imaging. Med Image Comput Comput Assist Interv. 2010;13(Pt 1):324–31. doi: 10.1007/978-3-642-15705-9_40. [DOI] [PMC free article] [PubMed] [Google Scholar]
- Braak H, Braak E. Neuropathological stageing of Alzheimer-related changes. Acta Neuropathol; (Berl) 1991;82(4):239–59. doi: 10.1007/BF00308809. [DOI] [PubMed] [Google Scholar]
- Cachier P, Rey D. Symmetrization of the Non-Rigid Registration Problem using Invertion-Invariant Energies: Application to Multiple Sclerosis. Proc of MICCAI 2000. 2000:472–481. October 2000. [Google Scholar]
- Carlson NE, Moore MM, Dame A, Howieson D, Silbert LC, Quinn JF, Kaye JA. Trajectories of brain loss in aging and the development of cognitive impairment. Neurology. 2008;70:828–33. doi: 10.1212/01.wnl.0000280577.43413.d9. [DOI] [PubMed] [Google Scholar]
- Chan D, Janssen JC, Whitwell JL, Watt HC, Jenkins R, Frost C, Rossor MN, Fox NC. Change in rates of cerebral atrophy over time in early-onset Alzheimer's disease: longitudinal MRI study. Lancet. 2003;362:1121–2. doi: 10.1016/S0140-6736(03)14469-8. [DOI] [PubMed] [Google Scholar]
- Chen K, Langbaum JBS, Fleisher AS, Reschke C, Lee W, Liu X, Ayutyanont N, Bandy D, Alexander GE, Thompson PM, Foster NL, Harvey DJ, De Leon M, Koeppe RA, Jagust WJ, Weiner MW, Reiman EM Alzheimer's Disease Neuroimaging Initiative (ADNI) Twelve-month metabolic declines in probable Alzheimer's disease and amnestic mild cognitive impairment assessed using an empirically pre-defined statistical region-of-interest: findings from the Alzheimer's Disease Neuroimaging Initiative. NeuroImage. 2010;51:654–64. doi: 10.1016/j.neuroimage.2010.02.064. March 2 [Epub ahead of print] [DOI] [PMC free article] [PubMed] [Google Scholar]
- Christensen GE. Inf Process Med Imaging. Springer-Verlag; 1999. Consistent Linear-Elastic Transformations for Image Matching; pp. 224–237. LCNS 1613. [Google Scholar]
- Christensen GE, Johnson H. Consistent Image Registration. IEEE Trans Med Imaging. 2001;20(7):568–582. doi: 10.1109/42.932742. [DOI] [PubMed] [Google Scholar]
- Christensen GE, He J. IEEE Proceedings of Mathematical Methods in Biomedical Image Analysis. Kauai: Hawaii; 2001. Consistent Nonlinear Elastic Image Registration; pp. 37–43. Dec. 2001. [Google Scholar]
- Christensen GE, Johnson HJ, Vannier MW. Synthesizing average 3D anatomical shapes. Neuroimage. 2006;32(1):146–58. doi: 10.1016/j.neuroimage.2006.03.018. [DOI] [PubMed] [Google Scholar]
- Chung MK, Worsley KJ, Paus T, Cherif C, Collins DL, Giedd JN, Rapoport JL, Evans AC. A unified statistical approach to deformation-based morphometry. Neuroimage. 2001;14(3):595–606. doi: 10.1006/nimg.2001.0862. [DOI] [PubMed] [Google Scholar]
- Durrleman S, Pennec X, Trouvé A, Gerig G, Ayache N. Spatiotemporal atlas estimation for developmental delay detection in longitudinal datasets. Med Image Comput Comput Assist Interv. 2009;12(Pt 1):297–304. doi: 10.1007/978-3-642-04268-3_37. [DOI] [PMC free article] [PubMed] [Google Scholar]
- Fox NC, Cousens S, Scahill R, Harvey RJ, Rossor MN. Using serial registered brain magnetic resonance imaging to measure disease progression in Alzheimer disease: power calculations and estimates of sample size to detect treatment effects. Arch Neurol. 2000;57(3):339–44. doi: 10.1001/archneur.57.3.339. [DOI] [PubMed] [Google Scholar]
- Fox NC, Scahill RI, Crum WR, Rossor MN. Correlation between rates of brain atrophy and cognitive decline in AD. Neurology. 1999;52(8):1687–9. doi: 10.1212/wnl.52.8.1687. [DOI] [PubMed] [Google Scholar]
- Freeborough PA, Fox NC. Modeling brain deformations in Alzheimer disease by fluid registration of serial 3D MR images. J Comput Assist Tomogr. 1998;22(5):838–43. doi: 10.1097/00004728-199809000-00031. [DOI] [PubMed] [Google Scholar]
- Geng X, Kumar D, Christensen GE. Transitive inverse-consistent manifold registration. Inf Process Med Imaging. 2005;19:468–79. doi: 10.1007/11505730_39. [DOI] [PubMed] [Google Scholar]
- Geng X. PhD thesis. University of Iowa; 2007. Transitive inverse-consistent image registration and evaluation. Available at: http://ir.uiowa.edu/etd/131. [Google Scholar]
- He J, Christensen GE. Large deformation inverse-consistent elastic image registration. Inf Process Med Imaging. 2003;18:438–49. doi: 10.1007/978-3-540-45087-0_37. [DOI] [PubMed] [Google Scholar]
- Hua X, Lee S, Hibar DP, Yanovsky I, Leow AD, Toga AW, Jack CR, Jr, Bernstein MA, Reiman EM, Harvey DJ, Kornak J, Schuff N, Alexander GE, Weiner MW, Thompson PM. Mapping Alzheimer's Disease Progression in 1309 MRI Scans: Power Estimates for Different Inter-Scan Intervals. Neuroimage. 2010;51(1):63–75. doi: 10.1016/j.neuroimage.2010.01.104. 15. Epub 2010 Feb 6. [DOI] [PMC free article] [PubMed] [Google Scholar]
- Hua X, Lee S, Yanovsky I, Leow AD, Chou YY, Ho AJ, Gutman B, Toga AW, Jack CR, Jr, Bernstein MA, Reiman EM, Harvey DJ, Kornak J, Schuff N, Alexander GE, Weiner MW, Thompson PM. Optimizing power to track brain degeneration in Alzheimer's disease and mild cognitive impairment with tensor-based morphometry: an ADNI study of 515 subjects. Neuroimage. 2009;48(4):668–81. doi: 10.1016/j.neuroimage.2009.07.011. [DOI] [PMC free article] [PubMed] [Google Scholar]
- Hua X, Leow AD, Lee S, Klunder AD, Toga AW, Lepore N, Chou YY, Brun C, Chiang MC, Barysheva M, Jack CR, Jr, Bernstein MA, Britson PJ, Ward CP, Whitwell JL, Borowski B, Fleisher AS, Fox NC, Boyes RG, Barnes J, Harvey D, Kornak J, Schuff N, Boreta L, Alexander GE, Weiner MW, Thompson PM. 3D characterization of brain atrophy in Alzheimer's disease and mild cognitive impairment using tensor-based morphometry. Neuroimage. 2008a;41(1):19–34. doi: 10.1016/j.neuroimage.2008.02.010. [DOI] [PMC free article] [PubMed] [Google Scholar]
- Hua X, Leow AD, Parikshak N, Lee S, Chiang MC, Toga AW, Jack CR, Jr, Weiner MW, Thompson PM. Tensor-based morphometry as a neuroimaging biomarker for Alzheimer's disease: an MRI study of 676 AD, MCI, and normal subjects. Neuroimage. 2008b;43(3):458–69. doi: 10.1016/j.neuroimage.2008.07.013. [DOI] [PMC free article] [PubMed] [Google Scholar]
- Jack CR, Jr, Petersen RC, Xu Y, O'Brien PC, Smith GE, Ivnik RJ, Tangalos EG, Kokmen E. Rate of medial temporal lobe atrophy in typical aging and Alzheimer's disease. Neurology. 1998;51:993–999. doi: 10.1212/wnl.51.4.993. [DOI] [PMC free article] [PubMed] [Google Scholar]
- Jack CR, Jr, Weigand SD, Shiung MM, Przybelski SA, O'Brien PC, Gunter JL, Knopman DS, Boeve BF, Smith GE, Petersen RC. Atrophy rates accelerate in amnestic mild cognitive impairment. Neurology. 2008;70:1740–52. doi: 10.1212/01.wnl.0000281688.77598.35. [DOI] [PMC free article] [PubMed] [Google Scholar]
- Johnson HJ, Christensen GE. Consistent landmark and intensity-based image registration. IEEE Trans Med Imaging. 2002;21(5):450–61. doi: 10.1109/TMI.2002.1009381. [DOI] [PubMed] [Google Scholar]
- Khan A, Trouvé A, Beg MF. Cross-sectional analysis of anatomical shape change over time via statistics on 4D within-subject flows. Proc MICCAI Workshop on Spatio-Temporal Image Analysis for Longitudinal and Time-Series Image Data. 2010 at: http://www.sci.utah.edu/∼gerig/MICCAI2010-SpatioTemporal/SpatioTempprogram.htm.
- Klein A, Andersson J, Ardekani BA, Ashburner J, Avants B, Chiang MC, Christensen GE, Collins DL, Hellier P, Hyun PSJ, Lepage C, Pennec X, Rueckert D, Thompson PM, Vercauteren T, Woods RP, Mann JJ, Parsey RV. Evaluation of 14 nonlinear Deformation Algorithms Applied to Human Brain MRI Registration. Neuroimage. 2009;46(3):786–802. doi: 10.1016/j.neuroimage.2008.12.037. [DOI] [PMC free article] [PubMed] [Google Scholar]
- Leow A, Huang SC, Geng A, Becker JT, Davis S, Toga AW, Thompson PM. Information Processing in Medical Imaging. Glenwood Springs; Colorado, USA: 2005. Inverse Consistent Mapping in 3D Deformable Image Registration: Its Construction and Statistical Properties; pp. 493–503. [DOI] [PubMed] [Google Scholar]
- Leow AD, Klunder AD, Jack CR, Jr, Toga AW, Dale AM, Bernstein MA, Britson PJ, Gunter JL, Ward CP, Whitwell JL, Borowski BJ, Fleisher AS, Fox NC, Harvey D, Kornak J, Schuff N, Studholme C, Alexander GE, Weiner MW, Thompson PM. Longitudinal stability of MRI for mapping brain change using tensor-based morphometry. Neuroimage. 2006;31(2):627–40. doi: 10.1016/j.neuroimage.2005.12.013. [DOI] [PMC free article] [PubMed] [Google Scholar]
- Leow AD, Yanovsky I, Chiang MC, Lee AD, Klunder AD, Lu A, Becker JT, Davis SW, Toga AW, Thompson PM. Statistical properties of Jacobian maps and the realization of unbiased large-deformation nonlinear image registration. IEEE Trans Med Imaging. 2007;26(6):822–32. doi: 10.1109/TMI.2007.892646. [DOI] [PubMed] [Google Scholar]
- Leow AD, Yanovsky I, Parikshak N, Hua X, Lee S, Toga AW, Jack CR, Jr, Bernstein MA, Britson PJ, Gunter JL, Ward CP, Borowski B, Shaw LM, Trojanowski JQ, Fleisher AS, Harvey D, Kornak J, Schuff N, Alexander GE, Weiner MW, Thompson PM. Alzheimer's disease neuroimaging initiative: a one-year follow up study using tensor-based morphometry correlating degenerative rates, biomarkers and cognition. Neuroimage. 2009;45(3):645–55. doi: 10.1016/j.neuroimage.2009.01.004. [DOI] [PMC free article] [PubMed] [Google Scholar]
- Leporé N, Brun CC, Chou YY, Lee AD, Barysheva M, de Zubicaray GI, Meredith M, McMahon K, Wright MJ, Toga AW, Thompson PM. Multi-Atlas Tensor-Based Morphometry and its Application to a Genetic Study of 92 Twins. Med Image Comput Comput Assist Interv Workshop on Mathematical Foundations of Computational Anatomy (MFCA); May 13 2008.2008. [Google Scholar]
- Lorenzen P, Davis B, Joshi S. Model based symmetric information theoretic large deformation multimodal image registration. Proceedings of the 2nd IEEE International Symposium on Biomedical Imaging: Macro to Nano (ISBI '04); April 2004; Arlington, Va, USA. 2004. pp. 720–723. [Google Scholar]
- Lorenzi M, Ayache N, Frisoni G, Pennec X. 4D registration of serial brain's MR images: a robust measure of changes applied to Alzheimer's disease. Proc MICCAI Workshop on Spatio-Temporal Image Analysis for Longitudinal and Time-Series Image Data. 2010 at: http://www.sci.utah.edu/∼gerig/MICCAI2010-SpatioTemporal/SpatioTempprogram.htm.
- Morra JH, Tu Z, Apostolova LG, Green AE, Avedissian C, Madsen SK, Parikshak N, Hua X, Toga AW, Jack CR, Jr, Schuff N, Weiner MW, Thompson PM. Automated 3D mapping of hippocampal atrophy and its clinical correlates in 400 subjects with Alzheimer's disease, mild cognitive impairment, and elderly controls. Hum Brain Mapp. 2009a;30(9):2766–88. doi: 10.1002/hbm.20708. [DOI] [PMC free article] [PubMed] [Google Scholar]
- Morra JH, Tu Z, Apostolova LG, Green AE, Avedissian C, Madsen SK, Parikshak N, Toga AW, Jack CR, Jr, Schuff N, Weiner MW, Thompson PM. Automated mapping of hippocampal atrophy in 1-year repeat MRI data from 490 subjects with Alzheimer's disease, mild cognitive impairment, and elderly controls. Neuroimage. 2009b;45(1 Suppl):S3–15. doi: 10.1016/j.neuroimage.2008.10.043. [DOI] [PMC free article] [PubMed] [Google Scholar]
- McEvoy L, Fennema-Notestine C, Roddey JC, Hagler DJ, Holland D, Karow DS, Pung CJ, Brewer JB, Dale AM. Alzheimer Disease: Quantitative Structural Neuroimaging for Detection and Prediction of Clinical and Structural Changes in Mild Cognitive Impairment. Radiology. 2010;251(1):195–205. doi: 10.1148/radiol.2511080924. 2009 April. [DOI] [PMC free article] [PubMed] [Google Scholar]
- Noblet V, Heinrich C, Heitz F, Armspach JP. Symmetric Nonrigid Image Registration: Application to Average Brain Templates Construction. Proc MICCAI 2008; Lecture Notes in Computer Science. 2008;5242/2008:897–904. doi: 10.1007/978-3-540-85990-1_108. [DOI] [PubMed] [Google Scholar]
- Ridha BH, Barnes J, Bartlett JW, Godbolt A, Pepple T, Rossor MN, Fox NC. Tracking atrophy progression in familial Alzheimer's disease: a serial MRI study. Lancet Neurol. 2006;5:828–34. doi: 10.1016/S1474-4422(06)70550-6. [DOI] [PubMed] [Google Scholar]
- Rogelj P, Kovacic S. Symmetric image registration. Medical Image Analysis. 2006;10(3):484–493. doi: 10.1016/j.media.2005.03.003. June 2006. Special Issue on The Second International Workshop on Biomedical Image Registration (WBIR'03) [DOI] [PubMed] [Google Scholar]
- Rosner B. Fundamentals of Biostatistics. PWS-Kent Publishing Company; Boston: 1990. [Google Scholar]
- Scahill RI, Schott JM, Stevens JM, Rossor MN, Fox NC. Mapping the evolution of regional atrophy in Alzheimer's disease: unbiased analysis of fluid-registered serial MRI. Proc Natl Acad Sci U S A. 2002;99(7):4703–7. doi: 10.1073/pnas.052587399. [DOI] [PMC free article] [PubMed] [Google Scholar]
- Scahill RI, Frost C, Jenkins R, Whitwell JL, Rossor MN, Fox NC. A longitudinal study of brain volume changes in normal aging using serial registered magnetic resonance imaging. Arch Neurol. 2003;60(7):989–94. doi: 10.1001/archneur.60.7.989. [DOI] [PubMed] [Google Scholar]
- Schuff N, Woerner N, Boreta L, Kornfield T, Shaw LM, Trojanowski JQ, Thompson PM, Jack CR, Jr, Weiner MW. MRI of hippocampal volume loss in early Alzheimer's disease in relation to ApoE genotype and biomarkers. Brain. 2009;132(4):1067–77. doi: 10.1093/brain/awp007. [DOI] [PMC free article] [PubMed] [Google Scholar]
- Škrinjar O, Bistoquet A, Tagare H. Symmetric and transitive registration of image sequences. Int J Biomed Imaging 2008. 2008;2008:686875. doi: 10.1155/2008/686875. Jan. 2008. [DOI] [PMC free article] [PubMed] [Google Scholar]
- Škrinjar O, Tagare H. Symmetric, transitive, geometric deformation and intensity variation invariant nonrigid image registration. Proceedings of the 2nd IEEE International Symposium on Biomedical Imaging: Macro to Nano (ISBI '04); April 2004; Arlington, VA, USA. 2004. pp. 920–923. [Google Scholar]
- Smith AD. Imaging the progression of Alzheimer pathology through the brain. Proc Natl Acad Sci U S A. 2002;99(7):4135–7. doi: 10.1073/pnas.082107399. [DOI] [PMC free article] [PubMed] [Google Scholar]
- Tagare H, Groisser D, Škrinjar O. A geometric theory of symmetric registration. Proceedings of the Conference on Computer Vision and Pattern Recognition Workshop (CVPRW '06);; June 2006; New York, NY, USA. 2006. p. 73. [Google Scholar]
- Tagare H, Groisser D, Škrinjar O. Symmetric Non-rigid Registration: A Geometric Theory and Some Numerical Techniques. J Math Imaging and Vision. 2009;34(1):61–88. [Google Scholar]
- Tagare H. The Geometry of Non-rigid Registration. UCLA Dept. of Mathematics Image Processing Seminar; 2010. Oct. 15, 2010. [Google Scholar]
- Thompson PM, Hayashi KM, de Zubicaray G, Janke AL, Rose SE, Semple J, Herman D, Hong MS, Dittmer SS, Doddrell DM, Toga AW. Dynamics of gray matter loss in Alzheimer's disease. J Neurosci. 2003;23(3):994–1005. doi: 10.1523/JNEUROSCI.23-03-00994.2003. [DOI] [PMC free article] [PubMed] [Google Scholar]
- Thompson WK, Holland D. Bias in Tensor-Based Morphometry Stat-ROI Measures May Result in Unrealistic Power Estimates. Neuroimage. 2011 doi: 10.1016/j.neuroimage.2010.11.092. in press. [DOI] [PMC free article] [PubMed] [Google Scholar]
- Vercauteren T, Pennec X, Perchant A, Ayache N. Symmetric Log-Domain Diffeomorphic Registration: A Demons-based Approach. Proceedings of the 11th International Conference on Medical Image Computing and Computer Assisted Intervention (MICCAI 2008); September 6 - 10 2008; New York, NY. 2008. [DOI] [PubMed] [Google Scholar]
- Whitwell JL, Przybelski SA, Weigand SD, Knopman DS, Boeve BF, Petersen RC, Jack CR., Jr 3D maps from multiple MRI illustrate changing atrophy patterns as subjects progress from mild cognitive impairment to Alzheimer's disease. Brain. 2007;130(Pt 7):1777–86. doi: 10.1093/brain/awm112. [DOI] [PMC free article] [PubMed] [Google Scholar]
- Woods RP, Grafton ST, Watson JD, Sicotte NL, Mazziotta JC. Automated image registration: II. Intersubject validation of linear and nonlinear models. J Comput Assist Tomogr. 1998;22(1):153–65. doi: 10.1097/00004728-199801000-00028. [DOI] [PubMed] [Google Scholar]
- Wu G, Wang Q, Jia H, Shen D. Groupwise registration by hierarchical anatomical correspondence detection. Med Image Comput Comput Assist Interv. 2010;13(Pt 2):684–91. doi: 10.1007/978-3-642-15745-5_84. [DOI] [PMC free article] [PubMed] [Google Scholar]
- Wu G, Wang Q, Jia H, Shen D. Registration of longitudinal image sequences with implicit template and spatial-temporal heuristics. Med Image Comput Comput Assist Interv. 2010;13(Pt 2):618–25. doi: 10.1007/978-3-642-15745-5_76. [DOI] [PMC free article] [PubMed] [Google Scholar]
- Yanovsky I, Leow AD, Lee S, Osher SJ, Thompson PM. Comparing registration methods for mapping brain change using tensor-based morphometry. Medical Image Analysis. 2009;13(5):679–700. doi: 10.1016/j.media.2009.06.002. [DOI] [PMC free article] [PubMed] [Google Scholar]
- Yushkevich PA, Avants BB, Das SR, Pluta J, Altinay M, Craige C. Bias in estimation of hippocampal atrophy using deformation-based morphometry arises from asymmetric global normalization: an illustration in ADNI 3 T MRI data. Neuroimage. 2010;50(2):434–45. doi: 10.1016/j.neuroimage.2009.12.007. [DOI] [PMC free article] [PubMed] [Google Scholar]