


Abstract
T-REX (Tree and reticulogram REConstruction) is a web server dedicated to the reconstruction of phylogenetic trees, reticulation networks and to the inference of horizontal gene transfer (HGT) events. T-REX includes several popular bioinformatics applications such as MUSCLE, MAFFT, Neighbor Joining, NINJA, BioNJ, PhyML, RAxML, random phylogenetic tree generator and some well-known sequence-to-distance transformation models. It also comprises fast and effective methods for inferring phylogenetic trees from complete and incomplete distance matrices as well as for reconstructing reticulograms and HGT networks, including the detection and validation of complete and partial gene transfers, inference of consensus HGT scenarios and interactive HGT identification, developed by the authors. The included methods allows for validating and visualizing phylogenetic trees and networks which can be built from distance or sequence data. The web server is available at: www.trex.uqam.ca.
INTRODUCTION
Phylogenetic trees, i.e. evolutionary trees, additive trees or phylogenies, are the basic structures traditionally used to represent differences between species, and then to analyze those differences statistically (1). Evolutionary relationships among species or other types of taxa can be inferred according to similarities and differences in their genetic or morphological characteristics. Phylogenetic trees can be reconstructed by distance-based methods (2) or by character-based methods (3). The use of distance-based methods is generally, but not necessarily, a two-step process, where distances are first estimated from character data and then a tree is inferred from the estimated distances. The character-based methods, which include Bayesian inference, maximum likelihood and maximum parsimony, rely on the explicit assumption that a set of sequences evolved from a common ancestor by a process of mutation and selection without mixing (e.g. without recombination events).
It is well known, however, that several complex evolutionary mechanisms cannot be adequately described by a phylogenetic tree model (4). Thus, phylogenetic networks should be used when reticulation events, such as hybridization, horizontal gene transfer (HGT), recombination or gene duplication followed by gene loss, have influenced species evolution (5,6). A reticulogram, i.e. reticulated cladogram, is an undirected phylogenetic network capable of portraying reticulate patterns of relationships among organisms (7). Reticulograms have been employed to characterize various phylogenetic and biogeographic mechanisms including hybridization between species, comprising allopolyploidy in plants, microevolution of local populations within a species, historical biogeography events and, finally, homoplasy, which is the portion of phylogenetic similarity resulting from evolutionary convergence (7,8).
An HGT network consists of a traditional phylogenetic, i.e. species, tree with a set of directed branches representing horizontal, i.e. lateral, transfers of the given gene. HGT involves a direct transfer of genetic material from one lineage to another. Bacteria and archaea have developed sophisticated mechanisms of the acquisition of new genes via HGT as an effective way of adaptation to varying environmental conditions (9–12). Two models of HGT have been described in the literature (13). First, and the most popular of them, is the traditional model of complete HGT (14,15). This model assumes that the transferred gene either displaces the orthologous gene of the recipient genome or, when the orthologue is absent in the recipient, is incorporated into the recipient genome as a new gene. The second model is that of partial gene transfer, which involves the formation of mosaic genes (16). A mosaic gene consists of interspersed blocks of sequences having different evolutionary histories but found combined in the resulting allele following HGT and intragenic recombination events (11,17).
In this article, we present the T-REX (Tree and reticulogram REConstruction) web server designed to help evolutionary biologists and bioinformatics researchers build, visualize and validate phylogenetic trees, reticulograms and HGT networks. This is a continuation of the T-REX project started in 2001 with the release of the Windows version of the T-REX package (18) whose development stopped in 2006. The most known existing web servers dedicated to the inference and validation of phylogenetic trees are the following: Phylogeny.fr (19), RAxML (20) and PhyML (21) web servers, Phylemon (22) as well as different web server versions of the PHYLIP package (23). While the tree inference methods are provided by many dedicated web servers, the reconstruction of reticulograms and HGT networks is offered only by T-REX. It is worth noting that the most known software intended to detect HGT events, but not available via web services, are the following: LatTrans (24), HorizStory (25), Efficient Evaluation of Edit Paths (26) and PhyloNet package including RIATA-HGT (27).
MATERIALS AND METHODS
The T-REX web server allows users to perform several popular methods of phylogenetic analysis as well as some new phylogenetic applications for inferring, drawing and validating phylogenetic trees and networks, which we have developed. The latest web server version of T-REX includes the following applications:
Methods for the visualization and interactive manipulation of phylogenetic trees using hierarchical vertical, hierarchical horizontal, radial and axial types of tree drawing (28). For instance, the Newick Viewer application allows users to visualize a tree coded by its Newick string.
An application for drawing phylogenetic trees, allowing for saving them in the Newick format. This program requires the support of the Canvas program by the user’s browser. Canvas is supported by many web browsers including Internet Explorer (starting from version 9.0), Firefox (starting from version 2.0) and Safari (staring from version 3.1). A detailed user guide specifying how to create or remove node(s) and branch(es) of a phylogenetic tree is supplied for this application.
Methods for inferring and validating phylogenetic trees using distances: traditional Neighbor Joining (NJ, 29), NINJA fast large-scale NJ implementation (30), BioNJ (31), UNJ (32), ADDTREE (33), MW (34), FITCH (23) and Circular order reconstruction (35), maximum parsimony (MS): MS methods from PHYLIP (23) and maximum likelihood (ML): the latest versions of PHYML (36) and RAxML (20) as well as ML methods from PHYLIP (23). For most of the available algorithms, T-REX also carries out bootstrap resampling to assess support of the tree branches. Here, we will give more details on the methods developed by our research group. Circular order reconstruction method (35) builds a phylogeny using a circular order of taxa associated with a given matrix of evolutionary distances. This fitting method was inspired by Yushmanov’s (37) article, which introduced the concept of circular orders of taxa corresponding to the clockwise scanning of leaves of a phylogenetic tree. The MW (Method of Weights) procedure searches for the best phylogenetic tree, in the least-squares sense, with respect to the given distance and weight matrices. This method allows for arbitrary weights which may be chosen according to one of the traditional weighting models (34). The tree obtained by any of the seven available distance-based methods is then polished using the procedure of quadratic approximation of its branch lengths [see (28) in the unweighted case and (34) in the weighted case], which is carried out to improve the value of the least-squares criterion while avoiding negative branch lengths.
Methods for reconstructing phylogenetic trees from a distance matrix containing missing values, i.e. incomplete matrices. The following four fitting methods are available: Triangles method by Guénoche and Leclerc (38), Ultrametric procedure for the estimation of missing values by Landry et al. (39) followed by NJ, Additive procedure for the estimation of missing values by Landry et al. (39) followed by NJ, and the Modified Weighted least-squares method (MW*) by Makarenkov and Lapointe (40). The MW* method assigns the weight of 1 to the existing entries, the weight of 0.5 to the estimated entries and the weight of 0 when the entry estimation is impossible. The simulations described in (40) showed that the MW* method clearly outperforms the Triangles, Ultrametric and Additive procedures.
-
A method for inferring reticulograms from distance matrices. The reticulogram reconstruction program first builds a supporting phylogenetic tree using one of the existing tree inferring methods. Following this, a reticulation branch that minimizes the least-squares or the weighted least-squares objective function is added to the tree (or network starting from Step 2) at each step of the algorithm (7). Two statistical criteria, Q1 and Q2, have been proposed to measure the gain in fit provided by each reticulation branch:
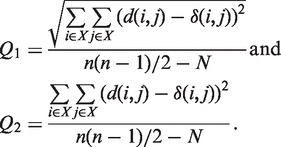
(1) The numerator of these functions is the square root of the sum (or the sum itself) of the quadratic differences between the values of the given evolutionary distance δ and the corresponding reticulogram estimates d, n is the number of taxa in the considered set X and N is the number of branches in the reticulogram, i.e. total of the phylogenetic tree branches and reticulation branches. The minimum of Q1 or Q2 can define a stopping rule for the addition of reticulation branches. A predefined number of reticulation branches, K, can also be added to the supporting tree. The web server version of T-REX also provides the possibility of inferring the supporting tree using one distance matrix and then for adding reticulation branches using another distance matrix. Such an algorithm can be applied for depicting morphological or genetic similarities among given species or for identifying HGT events by using the first distance matrix to infer the species tree and the second matrix (containing the gene-related distances) to infer the reticulation branches representing putative HGTs (7,8).
-
Complete and partial HGT detection and validation methods. The HGT-Detection program aims to determine an optimal, i.e. minimum-cost, scenario of HGTs while proceeding by a gradual reconciliation of the given species and gene trees (12). This algorithm was shown to be faster and generally more effective than the LatTrans (24) and RIATA-HGT (27) techniques. Statistical validation of the obtained gene transfers by bootstrapping can be performed. The HGT bootstrap scores of the predicted gene transfers are obtained by taking into account the uncertainty of the gene tree as well as the number of occurrences of the selected transfers in all minimum-cost HGT scenarios found for the given species tree and the generated gene tree replicates (12,16). The following formula is used to compute the bootstrap score HGT_BS of the transfer t obtained while reconciling the species tree T and the gene tree T’:
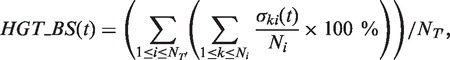
(2) where
 is equal to 1 if the transfer t is a part of the minimum-cost scenario k for the gene tree replicate
  and equal to 0, otherwise, NT’ is the number of gene tree replicates, i.e. number of HGT bootstrap replicates, generated from re-sampled gene sequences and Ni is the number of minimum-cost scenarios obtained when carrying out the algorithm with the species tree replicate T, which is assumed to be fixed, and the gene tree Ti’. HGT Consensus, Parallel and Interactive versions of the HGT-Detection algorithm are also available. The Consensus version of the algorithm yields a consensus HGT scenario obtained for a given species tree and a set of gene trees. The Parallel version allows the user to speed up the HGT computation by executing the program on a 32-processor Linux cluster, whereas the Interactive version allows the user to pre-define some HGTs and then accept, reject or change the direction of each transfer proposed by the HGT-Detection algorithm during the program execution. A version of the program allowing for identifying Partial HGT scenarios, when only a part of the gene is acquired by the host allele through intragenic recombination, is also provided (16). Note that the results of the HGT detection algorithms depend on the position of the species and gene tree roots. The user can select the tree roots by checking the appropriate check boxes prior to launching the computation.
 MAFFT (41) and MUSCLE (42) algorithms, which are among the most widely used multiple sequence alignment tools, are available with slow and fast pairwise alignment options.
Most common Sequence to Distance transformations. The following popular substitution models of DNA and amino acids evolution allowing for estimating evolutionary distances from sequence data have been included to T-REX: Uncorrected distance, Jukes–Cantor (43), K80 – two parameters (44), T92 (45), Tajima–Nei (46), Jin–Nei gamma (47), Kimura protein (48), LogDet (49), F84 (50), WAG (51), JTT (52) and LG (53).
Computation of the Robison and Foulds (RF) topological distance. This program computes the RF topological distance (54), which is a well-known measure of the tree similarity, between the first tree and all the following trees specified by the user. The trees can be supplied in the Newick or Distance matrix formats. An optimal algorithm described in (55) is carried out to compute the RF metric.
Newick to Distance matrix and Distance matrix to Newick format conversion. This application allows the user to convert a phylogenetic tree from the Newick format to the Distance matrix format and vice versa.
Random phylogenetic tree generation program. This application generates k random phylogenetic trees with n leaves, i.e. species or taxa, and an average branch length l using the random tree generation procedure described by Kuhner and Felsenstein (56), where the variables k, n and l are defined by the user. The branch lengths of trees follow an exponential distribution. The branch lengths are multiplied by 1 + ax, where the variable x is obtained from an exponential distribution (P(x > k) = exp(−k)), and the constant a is a tuning factor accounting for the deviation intensity (as recommended in (57), the value of a was set to 0.8). The random trees generated by this procedure have depth of O(log (n)).
RESULTS
The three main types of results provided by the T-REX web server are the following:
A phylogenetic tree drawing (Figure 1), fitting statistics and resulting tree coded in the Newick format. Fitting statistics include the fitted tree distance matrix, list of tree branches with their lengths and, if computed, their bootstrap scores. For all distance-based methods, the values of the (weighted) least-squares coefficient, (weighted) average absolute difference, (weighted) maximum absolute difference and the total length of the obtained tree are also provided. The tree presented in Figure 1 was obtained using the NJ inferring method (29). It illustrates phylogenetic relationships for a group of nine vertebrate species.
A reticulogram drawing (Figure 2) and fitting statistics. Fitting statistics include the fitted reticulogram distance matrix and list of reticulogram branches with their lengths. If the reticulogram reconstruction is performed, T-REX also provides the values of the least-squares criterion as well as the values of the selected stopping criterion Q1 or Q2 for the supporting tree topology and for each reticulation branch added to the supporting tree. Figure 2 shows an example of a reticulogram (7,8) depicting phylogenetic relationships for the same group of nine vertebrate species. The reticulation branches linking the pairs of species (bird – mammal) and (lizard – turtle) suggest that the connected species are more closely phylogenetically related to each other than it is depicted by the traditional phylogenetic tree model. The presented network was obtained by adding a predefined number of reticulation branches, K = 2, to the supporting phylogenetic tree inferred by NJ (29).
An HGT network in which gene transfers are indicated by dashed arrows (Figure 3). Numbers on transfers indicate their order of inference (except for partial HGT detection). HGT bootstrap scores, if computed, are indicated between parentheses and the affected intervals, for Partial HGT detection only, are indicated between brackets. The output file also contains the values of the bipartition dissimilarity (12), Robinson and Foulds topological distance (54) and least-squares coefficient which characterize the proximity between the considered species and gene trees (these statistics are provided at each step of the HGT detection algorithm), list of HGT branches with their bootstrap scores and affected intervals (for Partial HGT detection only). The HGT Consensus algorithm allows the user to infer a consensus HGT scenario. The Interactive version of the HGT-Detection program allows the user to specify some gene transfers as well as to validate all the transfers proposed by the algorithm. Figure 3 shows an example of an HGT network depicting horizontal transfers of the gene rpl12e for the group of 14 species originally considered by Matte-Taillez et. al. [see Figure 1a in (58)] and subsequently reanalyzed in (12). Five gene transfers were inferred for this example using the standard version of the HGT-Detection algorithm (12). The bootstrap analysis was also carried out for this data set to assess the robustness of the obtained HGTs.
Figure 1.

An example of a phylogenetic tree (hierarchical view) showing phylogenetic relationships for a group of nine vertebrate species.
Figure 2.

An example of a reticulogram (axial view) showing phylogenetic relationships for a group of nine vertebrate species.
Figure 3.

An example of a HGT network showing horizontal transfers of the gene rpl12e inferred for the group of 14 species originally considered by Matte-Taillez et al. [see Figure 1a in (58)]. Five gene transfers are indicated by dashed arrows. Numbers on transfers designate their order of inference. Bootstrap scores of the obtained transfers are indicated between parentheses.
The T-REX input data can be in the three following formats: Newick, PHYLIP and FASTA. All graphical results provided by the T-REX server can be saved in the SVG (Scalable Vector Graphics) format and then opened and modified (e.g. prepared for a publication or presentation) in the user’s preferred graphics editor. All numerical results are given in the text format.
CONCLUSION
In this article, we described the T-REX web server developed to facilitate the inference, validation and visualization of phylogenetic trees and networks. T-REX includes several new and classical methods of phylogenetic analysis. The methods we designed are the following: Reconstruction of phylogenetic trees from distance data according to the least-squares, weighted least-squares and circular order criteria; reconstruction of phylogenetic trees from distance matrices containing missing values using a weighted least-squares approach; computation of the Robinson and Foulds topological distance using an optimal algorithm; reticulogram inference that can be carried out according to several stopping rules; and finally, identification of complete HGT events, including their validation by bootstrap and compilation of the consensus and interactive HGT scenarios as well as partial HGT detection (when any part of the given gene can be incorporated in the recipient allele via intragenic recombination). All these methods have been shown to be effective in the analysis of various traditional, i.e. tree-like, and reticulate, i.e. network-like, evolutionary patterns and could become the methods of choice for the community of evolutionary biologists and bioinformatics researchers.
FUNDING
Natural Sciences and Engineering Research Council of Canada [NSERC-249644-2011]; Nature and Technologies Research Funds of Quebec [FQRNT; individual stipends to A.B. and A.B.D.]. Funding for open access charge: Natural Sciences and Engineering Research Council of Canada [NSERC-249644-2011].
Conflict of interest statement. None declared.
ACKNOWLEDGEMENTS
The authors thank Philippe Casgrain, Abdoulaye Baniré Diallo, Olivier Gascuel, Alain Guénoche, Joseph Felsenstein, Pierre-Alexandre Landry, François-Joseph Lapointe, Bruno Leclerc, Pierre Legendre, Etienne Lord and Abdellah Mazouzi for providing us with the source code of their methods and/or for their helpful comments. The authors also thank Editor Gary Benson and three anonymous referees for their helpful comments and suggestions.
REFERENCES
- 1.Felsenstein J. Inferring Phylogenies. Sinauer Associates: Sunderland, MA; 2004. [Google Scholar]
- 2.Sneath PHA, Sokal RR. In: Numerical taxonomy — The Principles and Practice of Numerical Classification. Freeman WH, editor. San Francisco, CA; 1973. [Google Scholar]
- 3.Hennig W. In: Phylogenetic Systematics. Dwight Davis D, Zangerl Rainer, translators. Urbana, IL: University of Illinois Press; 1966. [Google Scholar]
- 4.Legendre P. Special section on reticulate evolution. J. Classif. 2000;17:153–195. [Google Scholar]
- 5.Huson DH, Bryant D. Application of phylogenetic networks in evolutionary studies. Mol. Biol. Evol. 2006;23:254–267. doi: 10.1093/molbev/msj030. [DOI] [PubMed] [Google Scholar]
- 6.Huson DH, Rupp R, Scornavacca C. Cambridge University Press; 2011. Phylogenetic networks: concepts, algorithms and applications. [Google Scholar]
- 7.Legendre P, Makarenkov V. Reconstruction of biogeographic and evolutionary networks using reticulograms. Syst. Biol. 2002;51:199–216. doi: 10.1080/10635150252899725. [DOI] [PubMed] [Google Scholar]
- 8.Makarenkov V, Legendre P. From a phylogenetic tree to a reticulated network. J. Comput. Biol. 2004;11:195–212. doi: 10.1089/106652704773416966. [DOI] [PubMed] [Google Scholar]
- 9.Doolittle WF. Phylogenetic classification and the universal tree. Science. 1999;284:2124–2129. doi: 10.1126/science.284.5423.2124. [DOI] [PubMed] [Google Scholar]
- 10.Gogarten JP, Doolittle WF, Lawrence JG. Prokaryotic evolution in light of gene transfer. Mol. Biol. Evol. 2002;19:2226–2238. doi: 10.1093/oxfordjournals.molbev.a004046. [DOI] [PubMed] [Google Scholar]
- 11.Zhaxybayeva O, Lapierre P, Gogarten JP. Genome mosaicism and organismal lineages. Trends Genet. 2004;20:254–260. doi: 10.1016/j.tig.2004.03.009. [DOI] [PubMed] [Google Scholar]
- 12.Boc A, Philippe H, Makarenkov V. Inferring and validating horizontal gene transfer events using bipartition dissimilarity. Syst. Biol. 2010;59:195–211. doi: 10.1093/sysbio/syp103. [DOI] [PubMed] [Google Scholar]
- 13.Makarenkov V, Kevorkov D, Legendre P. Applied Mycology and Biotechnology. Vol. 6. International Elsevier Series; 2006. Phylogenetic Network Reconstruction Approaches. Bioinformatics, pp. 61–97. [Google Scholar]
- 14.Maddison WP. Gene trees in species trees. Syst. Biol. 1997;46:523–536. [Google Scholar]
- 15.Page RDM, Charleston MA. Trees within trees: phylogeny and historical associations. Trends Ecol. Evol. 1998;13:356–359. doi: 10.1016/s0169-5347(98)01438-4. [DOI] [PubMed] [Google Scholar]
- 16.Boc A, Makarenkov V. Towards an accurate identification of mosaic genes and partial horizontal gene transfers. Nucleic Acids Res. 2011;39:e144. doi: 10.1093/nar/gkr735. [DOI] [PMC free article] [PubMed] [Google Scholar]
- 17.Hollingshead SK, Becker R, Briles DE. Diversity of PspA: mosaic genes and evidence for past recombination in Streptococcus pneumoniae. Infect. Immun. 2000;68:5889–5900. doi: 10.1128/iai.68.10.5889-5900.2000. [DOI] [PMC free article] [PubMed] [Google Scholar]
- 18.Makarenkov V. T-Rex: reconstructing and visualizing phylogenetic trees and reticulation networks. Bioinformatics. 2001;17:664–668. doi: 10.1093/bioinformatics/17.7.664. [DOI] [PubMed] [Google Scholar]
- 19.Dereeper A, Guignon V, Blanc G, Audic S, Buffet S, Chevenet F, Dufayard J-F, Guindon S, Lefort V, Lescot M, et al. Phylogeny.fr: Robust phylogenetic analysis for the non-specialist. Nucleic Acids Res. 2008;36:W465–W469. doi: 10.1093/nar/gkn180. [DOI] [PMC free article] [PubMed] [Google Scholar]
- 20.Stamatakis A, Hoover P, Rougemont J. A rapid bootstrap algorithm for the RAxML web-servers. Syst. Biol. 2008;75:758–771. doi: 10.1080/10635150802429642. [DOI] [PubMed] [Google Scholar]
- 21.Guindon S, Dufayard JF, Lefort V, Anisimova M, Hordijk W, Gascuel O. New algorithms and methods to estimate maximum-likelihood phylogenies: assessing the performance of PhyML 3.0. Syst. Biol. 2010;59:307–321. doi: 10.1093/sysbio/syq010. [DOI] [PubMed] [Google Scholar]
- 22.Sánchez R, Serra F, Tárraga J, Medina I, Carbonell J, Pulido L, de María A, Capella-Gutíerrez S, Huerta-Cepas J, Gabaldón T, et al. Phylemon 2.0: a suite of web-tools for molecular evolution, phylogenetics, phylogenomics and hypotheses testing. Nucleic Acids Res. 2011;39:W470–W474. doi: 10.1093/nar/gkr408. [DOI] [PMC free article] [PubMed] [Google Scholar]
- 23.Felsenstein J. PHYLIP—Phylogeny inference package (Version 3.6) Cladistics. 1989;5:164–166. [Google Scholar]
- 24.Hallett M, Lagergren J. Efficient algorithms for lateral gene transfer problems. In: El-Mabrouk N, Lengauer T, Sankoff D, editors. Proceedings of the Fifth Annual International Conference on Research in Computational Biology. New-York: ACM Press; 2001. pp. 149–156. [Google Scholar]
- 25.MacLeod D, Charlebois RL, Doolittle F, Bapteste E. Deduction of probable events of lateral gene transfer through comparison of phylogenetic trees by recursive consolidation and rearrangement. BMC Evol. Biol. 2005;5:27. doi: 10.1186/1471-2148-5-27. [DOI] [PMC free article] [PubMed] [Google Scholar]
- 26.Beiko RG, Hamilton N. Phylogenetic identification of lateral genetic transfer events. BMC Evol. Biol. 2006;6:15. doi: 10.1186/1471-2148-6-15. [DOI] [PMC free article] [PubMed] [Google Scholar]
- 27.Than C, Ruths D, Nakhleh L. PhyloNet: a software package for analyzing and reconstructing reticulate evolutionary relationships. BMC Bioinf. 2008;9:322. doi: 10.1186/1471-2105-9-322. [DOI] [PMC free article] [PubMed] [Google Scholar]
- 28.Barthélemy J-P, Guénoche A. Trees and Proximity Representations. New York: Wiley; 1991. [Google Scholar]
- 29.Saitou N, Nei M. The neighbor-joining method: a new method for reconstructing phylogenetic trees. Mol. Biol. Evol. 1987;4:406–425. doi: 10.1093/oxfordjournals.molbev.a040454. [DOI] [PubMed] [Google Scholar]
- 30.Wheeler TJ. Large-scale neighbor-joining with NINJA. In: Salzberg S, Warnow T, editors. Proceedings of the 9th Workshop on Algorithms in Bioinformatics. Verlag, Berlin: Springer; 2009. pp. 375–389. [Google Scholar]
- 31.Gascuel O. BIONJ: an improved version of the NJ algorithm based on a simple model of sequence data. Mol. Biol. Evol. 1997;14:685–695. doi: 10.1093/oxfordjournals.molbev.a025808. [DOI] [PubMed] [Google Scholar]
- 32.Gascuel O. Concerning the NJ algorithm and its unweighted version UNJ. In: Mirkin B, McMorris FR, Roberts F, Rzhetsky A, editors. Mathematical Hierarchies and Biology. DIMACS Series in Discrete Mathematics and Theoretical Computer Science. Providence, RI: American Mathematical Society; 1997. pp. 149–171. [Google Scholar]
- 33.Sattath S, Tversky A. Additive similarity trees. Psychometrika. 1977;42:319–345. [Google Scholar]
- 34.Makarenkov V, Leclerc B. An algorithm for the fitting of a tree metric according to a weighted least-squares criterion. J. Classif. 1999;16:3–26. [Google Scholar]
- 35.Makarenkov V, Leclerc B. Tree metrics and their circular orders: some uses for the reconstruction and fitting of phylogenetic trees. In: Mirkin B, McMorris FR, Roberts F, Rzhetsky A, editors. Mathematical Hierarchies and Biology. DIMACS Series in Discrete Mathematics and Theoretical Computer Science. Providence, RI: American Mathematical Society; 1997. pp. 183–208. [Google Scholar]
- 36.Guindon S, Gascuel O. A simple, fast and accurate algorithm to estimate large phylogenies by maximum likelihood. Syst. Biol. 2003;52:696–704. doi: 10.1080/10635150390235520. [DOI] [PubMed] [Google Scholar]
- 37.Yushmanov SV. Construction of a tree with p leaves from 2p-3 elements of its distance matrix (in Russian) Matematicheskie Zametki. 1984;35:877–887. [Google Scholar]
- 38.Guénoche A, Leclerc B. The triangles method to build X-trees from incomplete distance matrices. RAIRO Operat. Res. 2001;35:283–300. [Google Scholar]
- 39.Landry PA, Lapointe F-J, Kirsch JAW. Estimating phylogenies from distance matrices: additive is superior to ultrametric estimation. Mol. Biol. Evol. 1996;13:818–823. [Google Scholar]
- 40.Makarenkov V, Lapointe F-J. A weighted least-squares approach for inferring phylogenies from incomplete distance matrices. Bioinformatics. 2004;20:2113–2121. doi: 10.1093/bioinformatics/bth211. [DOI] [PubMed] [Google Scholar]
- 41.Katoh K, Kuma K, Toh H, Miyata T. MAFFT version 5: improvement in accuracy of multiple sequence alignment. Nucleic Acids Res. 2005;33:511–518. doi: 10.1093/nar/gki198. [DOI] [PMC free article] [PubMed] [Google Scholar]
- 42.Edgar RC. MUSCLE: multiple sequence alignment with high accuracy and high throughput. Nucleic Acids Res. 2004;32:1792–1797. doi: 10.1093/nar/gkh340. [DOI] [PMC free article] [PubMed] [Google Scholar]
- 43.Jukes TH, Cantor CR. Evolution of protein molecules. In: Munro HN, editor. Mammalian Protein Metabolism. New York: Academic Press; 1969. pp. 21–123. [Google Scholar]
- 44.Kimura M. A simple method for estimating evolutionary rates of base substitutions through comparative studies of nucleotide sequences. J. Mol. Evol. 1980;16:111–120. doi: 10.1007/BF01731581. [DOI] [PubMed] [Google Scholar]
- 45.Tamura K. Estimation of the number of nucleotide substitutions when there are strong transition-transversion and G+C content biases. Mol. Biol. Evol. 1992;9:678–687. doi: 10.1093/oxfordjournals.molbev.a040752. [DOI] [PubMed] [Google Scholar]
- 46.Tajima F, Nei M. Estimation of evolutionary distance between nucleotide sequences. Mol. Biol. Evol. 1984;1:269–285. doi: 10.1093/oxfordjournals.molbev.a040317. [DOI] [PubMed] [Google Scholar]
- 47.Jin L, Nei M. Limitations of the evolutionary parsimony method of phylogenetic analysis. Mol. Biol. Evol. 1990;7:82–102. doi: 10.1093/oxfordjournals.molbev.a040588. [DOI] [PubMed] [Google Scholar]
- 48.Kimura M. Cambridge: Cambridge University Press; 1983. The neutral theory of molecular evolution. [Google Scholar]
- 49.Lockhart PJ, Steel MA, Hendy MD, Penny D. Recovering evolutionary trees under a more realistic model of sequence evolution. Mol. Biol. Evol. 1994;11:605–612. doi: 10.1093/oxfordjournals.molbev.a040136. [DOI] [PubMed] [Google Scholar]
- 50.Felsenstein J. Evolutionary trees from DNA sequences: a maximum likelihood approach. J. Mol. Evol. 1981;17:368–376. doi: 10.1007/BF01734359. [DOI] [PubMed] [Google Scholar]
- 51.Whelan S, Goldman N. A general empirical model of protein evolution derived from multiple protein families using a maximum-likelihood approach. Mol. Biol. Evol. 2001;18:691–699. doi: 10.1093/oxfordjournals.molbev.a003851. [DOI] [PubMed] [Google Scholar]
- 52.Jones DT, Taylor WR, Thornton JM. The rapid generation of mutation data matrices from protein sequences. Comput. Appl. Biosci. 1992;8:275–282. doi: 10.1093/bioinformatics/8.3.275. [DOI] [PubMed] [Google Scholar]
- 53.Le SQ, Gascuel O. LG: an improved, general amino-acid replacement matrix. Mol. Biol. Evol. 2008;25:1307–1320. doi: 10.1093/molbev/msn067. [DOI] [PubMed] [Google Scholar]
- 54.Robinson DR, Foulds LR. Comparison of phylogenetic trees. Math. Biosci. 1981;53:131–147. [Google Scholar]
- 55.Makarenkov V, Leclerc B. An optimal way to compare additive trees using circular orders. J. Comp. Biol. 2000;7:731–744. doi: 10.1089/106652701446170. [DOI] [PubMed] [Google Scholar]
- 56.Kuhner M, Felsenstein J. A simulation comparison of phylogeny algorithms under equal and unequal evolutionary rates. Mol. Biol. Evol. 1994;11:459–468. doi: 10.1093/oxfordjournals.molbev.a040126. [DOI] [PubMed] [Google Scholar]
- 57.Guindon S, Gascuel O. Efficient biased estimation of evolutionary distances when substitution rates vary across sites. Mol. Biol. Evol. 2002;19:534–543. doi: 10.1093/oxfordjournals.molbev.a004109. [DOI] [PubMed] [Google Scholar]
- 58.Matte-Tailliez O, Brochier C, Forterre P, Philippe H. Archaeal phylogeny based on ribosomal proteins. Mol. Biol. Evol. 2002;19:631–639. doi: 10.1093/oxfordjournals.molbev.a004122. [DOI] [PubMed] [Google Scholar]