


Abstract
Complex biological functions emerge through intricate protein–protein interaction networks. An important class of protein–protein interaction corresponds to peptide-mediated interactions, in which a short peptide stretch from one partner interacts with a large protein surface from the other partner. Protein–peptide interactions are typically of low affinity and involved in regulatory mechanisms, dynamically reshaping protein interaction networks. Due to the relatively small interaction surface, modulation of protein–peptide interactions is feasible and highly attractive for therapeutic purposes. Unfortunately, the number of available 3D structures of protein–peptide interfaces is very limited. For typical cases where a protein–peptide structure of interest is not available, the PepSite web server can be used to predict peptide-binding spots from protein surfaces alone. The PepSite method relies on preferred peptide-binding environments calculated from a set of known protein–peptide 3D structures, combined with distance constraints derived from known peptides. We present an updated version of the web server that is orders of magnitude faster than the original implementation, returning results in seconds instead of minutes or hours. The PepSite web server is available at http://pepsite2.russelllab.org.
INTRODUCTION
Protein–protein interactions play a key role in the regulation of all cellular functions. A subset of protein–protein interactions of particular interest are those mediated by short linear peptides (∼3–10 amino acids), mostly residing in intrinsically disordered regions of proteins and often having a conserved sequence pattern, in which case they are termed short linear motifs (SLiMs) (1). Peptide-mediated interactions often regulate biological processes that require dynamic and specific responses (2). Examples of such processes include protein localization (3), endocytosis (4), post-translational modifications (5) and signaling pathways (6). The importance of peptide-mediated interactions is further demonstrated by their involvement in several human diseases, such as cherubism (7), cancer (8) and viral infections (9,10). Moreover, it has been shown that protein–peptide interactions can be modulated by chemicals or synthetic peptides for therapeutic purposes (11–13). Therefore, the ability to accurately identify and describe protein–peptide interactions in detail bears tremendous potential in furthering our understanding of complex cellular regulatory mechanisms, as well as enabling rational modulation of protein–protein interactions for therapeutic purposes.
There are several known SLiMs deposited in public databases [ELM (14), MnM (15), PROSITE (16)]. These databases, however, cover only a fraction of the estimated number of peptides and motifs actually used in the cells (17). Methods to identify new instances of known motifs, include ELM (14), Prosite (16), ADAN (18) and iELM (Weatheritt et al., 2012, in this special edition), whereas others focus on finding or providing functional context for motifs [e.g. SLiMPred (19), SLiMFinder (20), DiLiMoT (21), PRATT (22) and SLiMSearch (23)]. These methods focus mainly on the peptide motif and provide little or no information regarding the protein–peptide interface. Docking has been successfully used to predict protein–peptide interfaces for short peptides of up to four residues (24). For more typical peptide lengths (5–10 residues) and unknown binding site, docking is less feasible due to the large search space of peptide conformations and binding sites to be explored. Other approaches for predicting protein–peptide interfaces perform well with larger peptides, but limit their predictions to interactions involving certain well-characterized domains [e.g. SH3 (25), WW (26) and PDZ (27)]. Finally, there are several methods available (28) that identify functional sites on protein structures, e.g. Rate4site (29), or predict sites for generic or chemical ligand binding, e.g. SiteHound (30). These methods, however, are tailored to identifying either chemical ligand sites or general functional sites and are, therefore, limited in their performance toward predicting peptide-binding sites [see, e.g. ‘Discussion’ section in (31)].
To address the lack of a generic tool to predict binding of any linear peptide onto any protein structure, we previously developed the PepSite method (31). Using a large collection of protein–peptide interactions of known structure, the preferred binding environment of each peptide residue type is calculated and encoded in a so-called spatial position-specific scoring matrix (S-PSSM). Given a user-provided protein structure, PepSite scans the protein surface with the S-PSSMs and generates candidate binding sites for peptide residues. Finally, a peptide sequence of interest can be matched against the predicted residue binding sites, subject to certain distance constraints, resulting in approximate predicted peptide structures bound to the protein surface. Results from PepSite can be combined with a method such as FlexPepDock (32,33), which computes an atomic model for the peptide given an approximate binding site. A web server providing access to the initial version of PepSite has been available for the last 3 years. In this article, we present a new web server based on PepSite 2, a complete rewrite of the software in the C programming language. PepSite 2 typically generates results in seconds, as opposed to minutes or even hours required by the initial implementation. The new PepSite version opens up many possibilities, such as exploration of entire proteomes in large scale, in silico protein–peptide discovery experiments.
MATERIALS AND METHODS
Spatial position-specific scoring matrices
The PepSite approach leverages 3D structural information of protein–peptide interactions to predict new instances of peptide-binding sites given a protein surface. A data set of 405 protein–peptide complexes of known 3D structure was previously collected and used to train and validate the method (31). For each supported peptide residue type (currently all 20 standard residues plus phosphorylated Ser, Thr and Tyr), the S-PSSM capturing its preferred binding environment is constructed. Each protein, heavy atom is mapped to one of the 14 custom-defined atom types, and a 3D grid is constructed for each combination of peptide residue type and protein atom type. Examples of atom types include oxygen from a carbonyl group, aromatic carbon, etc. [see (31) for details]. As a first step, relative abundances for the 14 atom types on protein surfaces are calculated from a representative set of 100 protein structures, thus defining a background distribution. The representative set is defined by taking a random sample from a set of representative structures clustered at 30% sequence identity retrieved from the PDB via its REST web service interface (34). Protein surface atoms are defined as those with positive solvent accessibility scores calculated with NACCESS 2.1.1 (http://www.bioinf.manchester.ac.uk/naccess/).
For a given peptide residue type r (e.g. Pro), construction of the S-PSSM proceeds as follows. Each instance of residue r in peptides in the training set is structurally superposed to a reference r side chain using PINTS (35), and the same transformation matrix is applied to the coordinates of the corresponding interacting proteins with STAMP (36). The result is a 3D cloud of protein atoms around a reference r side chain that characterizes the preferred protein environment that interacts with r residues in peptides. For each protein atom type i (i = 1, …, 14), a 3D grid centered at the reference r side chain is generated, with each voxel v defined as log-odds score, i.e.
where ni,observed is the observed number of atoms of type i in voxel v and ni,expected is the expected number of atoms of type i given by the relative abundance of atom type i in the background distribution times the total number of protein atoms in voxel v. Each grid contains 64 voxels with a volume of 9 Å each, as previously described (31).
Prediction of hot spots
Given a protein structure of interest, preferred sites for amino acid binding (‘hot binding spots’ or simply ‘hot spots’) are predicted as follows. Atomic solvent accessibility scores are calculated with NACCESS 2.1.1 and surface points are defined as the coordinates of protein atoms with positive accessibility scores. Approximate surface normals are calculated for each surface point by connecting its position to the geometric center of protein atoms within 6 Å. For each surface point s, each set of S-PSSMs is placed along the approximate normal. Each protein atom j of type i(j) that falls within the S-PSSMs is assigned to a voxel v(j) and receives a score Sr,i(j),v(j) for each supported peptide residue type r. An aggregate score is computed for each peptide residue type r as ∑j Sr,i(j),v(j), where the sum is computed over all protein atoms that fall within the S-PSSMs. The distance and orientation of each S-PSSM with respect to the surface atom s are then sampled as to maximize ∑j Sr,i(j),v(j). Thus, for peptide residue type r, a score capturing its binding propensity is calculated for each surface point s. Surface points are then pruned by enforcing a minimum separating distance and avoiding clashes with the protein structure, keeping the points with the highest score. Finally, predicted hot spots are given by the top-scoring surface points, with the hot spot coordinates given by the center of the corresponding S-PSSMs.
Prediction of peptide-binding sites
Provided a list of predicted hot spots, obtained as described above, and a query sequence, PepSite employs a recursive backtracking algorithm to find all partial matches conforming to defined distance constraints. Concretely, if a peptide query is PLWPR, PepSite will exhaustively explore all possible combinations of the predicted hot spots for Pro, Leu, Trp and Arg, building an approximate 3D model of the peptide bound to the protein surface of interest, allowing for partial matches. For instance, a match could consist of PL-P-, in which three residues were assigned coordinates and scores of predicted hot spots, and the distance between all the pairs of matched residues lie within ranges usually seen in peptide structures.
The distance constraints are defined as follows. For each supported peptide residue type r, a distribution of the distance between its ‘active center’ (a subset of the side chain) and its Cα atom is calculated from the training set, with mean denoted by  Furthermore, Cα–Cα distance distributions are also calculated for peptide residue pairs (k, k+1), (k, k+2), etc. with mean denoted by
  Matches calculated by PepSite have the property that for every pair of matched residues (i,j), with residue types r(i) and r(j), the distance between their corresponding hot spot coordinates
  satisfies
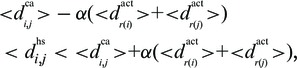 |
where α is a free parameter. Minimum and maximum number of residues to be matched are also imposed based on known protein–peptide complexes; the minimum number of matched residues is currently set to 2, whereas the maximum is currently set to minimum (6, 1 + 0.67 L), where L is the query length (L = 5 for the PLWPR example above).
The overall raw score of a match is obtained by summing the hot spot score for each matched peptide residue (hot spot scores are described in the previous section). Considering the example above of a PL-P- match, the raw score corresponds to the first matched Pro hot spot score, plus the matched Leu hot spot score, plus the second matched Pro hot spot score. With the aim to make the scores of matches with different size comparable, P-values are calculated as follows. For each peptide length, raw scores are calculated by running PepSite on random peptide sequences against representative protein structures, obtained as described earlier in the text. The raw score distribution for each peptide length is then fitted to a Gumbel distribution. When matches are generated by PepSite in response to a query of interest, raw scores are converted to P-values using the corresponding fitted Gumbel distribution. Extensive benchmarks can be found in the original publication (31).
THE PEPSITE WEB SERVER
The PepSite web server can be accessed at http://pepsite2.russelllab.org. It is free and open to all and there is no login requirement. In a typical use of the server, a user queries for a peptide sequence and a protein structure, specified either via a protein data bank (PDB) code and chain or by uploading a structure in PDB format. The calculated peptide-binding spots are displayed both as a table, ordered by statistical significance, and through an interactive molecular visualization. Predicted peptide-binding sites can also be downloaded in PDB format. Molecular visualizations are generated by default using Jmol (http://www.jmol.org/), a popular Java viewer. In addition, experimental support for WebGL-based visualizations generated using VMD (37) and X3DOM (http://www.x3dom.org/) will be added in the near future.
Example application
To illustrate the use of the PepSite server, let us consider a protein–peptide interaction of interest without an available structure. Menin is a ubiquitously expressed protein with many interacting partners, thus implicated in a range of biological processes (38). In particular, menin is a critical oncogenic cofactor of mixed lineage leukemia (MLL) fusion proteins, required for their leukemogenic activity and loss of the highly specific menin–MLL interaction disrupts the oncogenic potential (39,40). Thus, modulation of this interaction is an attractive target for acute leukemias with MLL rearrangements (38). It has been determined that two short fragments of MLL interact with menin, with the first (MBM1, residues 4–15) representing the high-affinity binding motif (41). As the structure of the menin–MBM1 interface is not available, one can use PepSite to predict the MBM1-binding site using as inputs the MBM1 peptide sequence and the recently solved Nematostella vectensis crystal structure (38). The predicted binding site lies in a large hydrophobic pocket from menin (Figure 1). Indeed, this pocket has been previously hypothesized to be the binding site for the MLL peptide, a hypothesis further supported by a series of mutagenesis experiments (38). The coarse-grained model of the menin–MBM1 binding interface generated by PepSite could be further refined using, e.g. FlexPepDock (32,33), and the resulting atomic model could then be used to rationally design a competitive inhibitor of the menin–MLL interaction for therapeutic purposes.
Figure 1.

Top prediction of an MLL peptide (residues 4–15, RWRFPARP according to UniProt accession Q9Y6P1) bound to a menin structure from N. vectensis (PDB 3RE2, chain A) (38). The menin structure is displayed either as a cartoon (A) or as a surface (B). Image generated with VMD (37).
The PepSite API
PepSite can also be run programmatically via a simple REST web service interface. The peptide sequence and PDB code and chain are encoded in the URL request, and results may be retrieved in plain text or PDB format. Protein structures may also be specified by way of a UniProt accession or identifier, in which case PepSite will attempt to map the request to a suitable PDB structure (see online documentation for details). The iELM web server (http://i.elm.eu.org; Weatheritt et al., 2012, in this special edition), which predicts protein–peptide interactions involving linear motifs annotated in ELM (14), makes use of the PepSite API.
CONCLUSION
The PepSite web server allows users to predict peptide-binding sites, given a peptide sequence and a 3D structure of the receptor protein. The new version is orders of magnitude faster, with results visualized typically in a few seconds, thus allowing users to explore a range of hypothesis interactively, such as progressively mutating the peptide sequence and determining the effect on the predictions. The PepSite API allows the server to be accessed programmatically, which means PepSite can now be easily integrated into bioinformatics pipelines, in particular as part of large-scale in silico interaction discovery experiments. Several improvements are being implemented in order to increase the input flexibility, such as allowing users to enter linear motifs instead of complete peptide sequences, or restrict the search to a subset of the protein structure. Improvements to molecular visualizations are also being implemented, including a WebGL-based option for modern web browsers. Another feature under development is the ability to scan overlapping windows of a protein sequence to determine the most likely peptide stretch responsible for an interaction of interest, as previously suggested (31).
FUNDING
CellNetworks Cluster of Excellence (EXC81); European Community’s Seventh Framework Programme FP7/2009 [agreement no: 241955, SYSCILIA]; European Molecular Biology Organization (fellowship to L.G.T.); Alexander von Humboldt Foundation (fellowship to S.L.). Funding for open access charge: CellNetworks Cluster of Excellence (EXC81).
Conflict of interest statement. None declared.
ACKNOWLEDGEMENTS
The authors thank Matthew Betts for fruitful discussions.
REFERENCES
- 1.Davey NE, Van Roey K, Weatheritt RJ, Toedt G, Uyar B, Altenberg B, Budd A, Diella F, Dinkel H, Gibson TJ. Attributes of short linear motifs. Mol. Biosyst. 2012;8:268–281. doi: 10.1039/c1mb05231d. [DOI] [PubMed] [Google Scholar]
- 2.Diella F, Haslam N, Chica C, Budd A, Michael S, Brown NP, Travé G, Gibson TJ. Understanding eukaryotic linear motifs and their role in cell signaling and regulation. Front. Biosci. 2008;13:6580–6603. doi: 10.2741/3175. [DOI] [PubMed] [Google Scholar]
- 3.Wen W, Meinkotht JL, Tsien RY, Taylor SS. Identification of a signal for rapid export of proteins from the nucleus. Cell. 1995;82:463–473. doi: 10.1016/0092-8674(95)90435-2. [DOI] [PubMed] [Google Scholar]
- 4.Boll W, Rapoport I, Brunner C, Modis Y, Prehn S, Kirchhausen T. The μ2 subunit of the clathrin adaptor AP-2 binds to FDNPVY and YppØ sorting signals at distinct sites. Traffic. 2002;3:590–600. doi: 10.1034/j.1600-0854.2002.30808.x. [DOI] [PubMed] [Google Scholar]
- 5.Miller ML, Jensen LJ, Diella F, Jørgensen C, Tinti M, Li L, Hsiung M, Parker SA, Bordeaux J, Sicheritz-Ponten T, et al. Linear motif atlas for phosphorylation-dependent signaling. Sci. Signal. 2008;1:ra2. doi: 10.1126/scisignal.1159433. [DOI] [PMC free article] [PubMed] [Google Scholar]
- 6.Scott JD, Pawson T. Cell signaling in space and time: where proteins come together and when they're apart. Science. 2009;326:1220–1224. doi: 10.1126/science.1175668. [DOI] [PMC free article] [PubMed] [Google Scholar]
- 7.Guettler S, LaRose J, Petsalaki E, Gish G, Scotter A, Pawson T, Rottapel R, Sicheri F. Structural basis and sequence rules for substrate recognition by Tankyrase explain the basis for cherubism disease. Cell. 2011;147:1340–1354. doi: 10.1016/j.cell.2011.10.046. [DOI] [PubMed] [Google Scholar]
- 8.Maclaine NJ, Hupp TR. How phosphorylation controls p53. Cell Cycle. 2011;10:916–921. doi: 10.4161/cc.10.6.15076. [DOI] [PubMed] [Google Scholar]
- 9.Soni V, Cahir-McFarland E, Kieff E. LMP1 TRAFficking activates growth and survival pathways. Adv. Exp. Med. Biol. 2007;597:173–187. doi: 10.1007/978-0-387-70630-6_14. [DOI] [PubMed] [Google Scholar]
- 10.Dahiya A, Gavin MR, Luo RX, Dean DC. Role of the LXCXE binding site in Rb function. Mol. Cell Biol. 2000;20:6799–6805. doi: 10.1128/mcb.20.18.6799-6805.2000. [DOI] [PMC free article] [PubMed] [Google Scholar]
- 11.Vassilev LT, Vu BT, Graves B, Carvajal D, Podlaski F, Filipovic Z, Kong N, Kammlott U, Lukacs C, Klein C, et al. In vivo activation of the p53 pathway by small-molecule antagonists of MDM2. Science. 2004;303:844–848. doi: 10.1126/science.1092472. [DOI] [PubMed] [Google Scholar]
- 12.Yang Y, Ludwig RL, Jensen JP, Pierre SA, Medaglia MV, Davydov IV, Safiran YJ, Oberoi P, Kenten JH, Phillips AC, et al. Small molecule inhibitors of HDM2 ubiquitin ligase activity stabilize and activate p53 in cells. Cancer Cell. 2005;7:547–559. doi: 10.1016/j.ccr.2005.04.029. [DOI] [PubMed] [Google Scholar]
- 13.Kadaveru K, Vyas J, Schiller MR. Viral infection and human disease–insights from minimotifs. Front. Biosci. 2008;13:6455–6471. doi: 10.2741/3166. [DOI] [PMC free article] [PubMed] [Google Scholar]
- 14.Dinkel H, Michael S, Weatheritt RJ, Davey NE, Van Roey K, Altenberg B, Toedt G, Uyar B, Seiler M, Budd A, et al. ELM–the database of eukaryotic linear motifs. Nucleic Acids Res. 2012;40:D242–D251. doi: 10.1093/nar/gkr1064. [DOI] [PMC free article] [PubMed] [Google Scholar]
- 15.Rajasekaran S, Balla S, Gradie P, Gryk MR, Kadaveru K, Kundeti V, Maciejewski MW, Mi T, Rubino N, Vyas J, et al. Minimotif miner 2nd release: a database and web system for motif search. Nucleic Acids Res. 2009;37:D185–D190. doi: 10.1093/nar/gkn865. [DOI] [PMC free article] [PubMed] [Google Scholar]
- 16.Sigrist CJA, Cerutti L, de Castro E, Langendijk-Genevaux PS, Bulliard V, Bairoch A, Hulo N. PROSITE, a protein domain database for functional characterization and annotation. Nucleic Acids Res. 2010;38:D161–D166. doi: 10.1093/nar/gkp885. [DOI] [PMC free article] [PubMed] [Google Scholar]
- 17.Neduva V, Linding R, Su-Angrand I, Stark A, de Masi F, Gibson TJ, Lewis J, Serrano L, Russell RB. Systematic discovery of new recognition peptides mediating protein interaction networks. PLoS Biol. 2005;3:e405. doi: 10.1371/journal.pbio.0030405. [DOI] [PMC free article] [PubMed] [Google Scholar]
- 18.Encinar JA, Fernandez-Ballester G, Sánchez IE, Hurtado-Gomez E, Stricher F, Beltrao P, Serrano L. ADAN: a database for prediction of protein–protein interaction of modular domains mediated by linear motifs. Bioinformatics. 2009;25:2418–2424. doi: 10.1093/bioinformatics/btp424. [DOI] [PubMed] [Google Scholar]
- 19.Mooney C, Pollastri G, Shields DC, Haslam NJ. Prediction of short linear protein binding regions. J. Mol. Biol. 2012;415:193–204. doi: 10.1016/j.jmb.2011.10.025. [DOI] [PubMed] [Google Scholar]
- 20.Davey NE, Edwards RJ, Shields DC. Estimation and efficient computation of the true probability of recurrence of short linear protein sequence motifs in unrelated proteins. BMC Bioinformatics. 2010;11:14. doi: 10.1186/1471-2105-11-14. [DOI] [PMC free article] [PubMed] [Google Scholar]
- 21.Neduva V, Russell RB. DILIMOT: discovery of linear motifs in proteins. Nucleic Acids Res. 2006;34:W350–W355. doi: 10.1093/nar/gkl159. [DOI] [PMC free article] [PubMed] [Google Scholar]
- 22.Jonassen I, Collins JF, Higgins DG. Finding flexible patterns in unaligned protein sequences. Protein Sci. 1995;4:1587–1595. doi: 10.1002/pro.5560040817. [DOI] [PMC free article] [PubMed] [Google Scholar]
- 23.Davey NE, Haslam NJ, Shields DC, Edwards RJ. SLiMSearch 2.0: biological context for short linear motifs in proteins. Nucleic Acids Res. 2011;39:W56–W60. doi: 10.1093/nar/gkr402. [DOI] [PMC free article] [PubMed] [Google Scholar]
- 24.Hetényi C, van der Spoel D. Efficient docking of peptides to proteins without prior knowledge of the binding site. Protein Sci. 2002;11:1729–1737. doi: 10.1110/ps.0202302. [DOI] [PMC free article] [PubMed] [Google Scholar]
- 25.Tong AHY, Drees B, Nardelli G, Bader GD, Brannetti B, Castagnoli L, Evangelista M, Ferracuti S, Nelson B, Paoluzi S, et al. A combined experimental and computational strategy to define protein interaction networks for peptide recognition modules. Science. 2002;295:321–324. doi: 10.1126/science.1064987. [DOI] [PubMed] [Google Scholar]
- 26.Dalby PA, Hoess RH, DeGrado WF. Evolution of binding affinity in a WW domain probed by phage display. Protein Sci. 2000;9:2366–2376. doi: 10.1110/ps.9.12.2366. [DOI] [PMC free article] [PubMed] [Google Scholar]
- 27.Wiedemann U, Boisguerin P, Leben R, Leitner D, Krause G, Moelling K, Volkmer-Engert R, Oschkinat H. Quantification of PDZ domain specificity, prediction of ligand affinity and rational design of super-binding peptides. J. Mol. Biol. 2004;343:703–718. doi: 10.1016/j.jmb.2004.08.064. [DOI] [PubMed] [Google Scholar]
- 28.Ghersi D, Sanchez R. Beyond structural genomics: computational approaches for the identification of ligand binding sites in protein structures. J. Struct. Funct. Genomics. 2011;12:109–117. doi: 10.1007/s10969-011-9110-6. [DOI] [PMC free article] [PubMed] [Google Scholar]
- 29.Capra JA, Singh M. Predicting functionally important residues from sequence conservation. Bioinformatics. 2007;23:1875–1882. doi: 10.1093/bioinformatics/btm270. [DOI] [PubMed] [Google Scholar]
- 30.Hernandez M, Ghersi D, Sanchez R. SITEHOUND-web: a server for ligand binding site identification in protein structures. Nucleic Acids Res. 2009;37:W413–W416. doi: 10.1093/nar/gkp281. [DOI] [PMC free article] [PubMed] [Google Scholar]
- 31.Petsalaki E, Stark A, García-Urdiales E, Russell RB. Accurate prediction of peptide binding sites on protein surfaces. PLoS Comput. Biol. 2009;5:e1000335. doi: 10.1371/journal.pcbi.1000335. [DOI] [PMC free article] [PubMed] [Google Scholar]
- 32.London N, Raveh B, Cohen E, Fathi G, Schueler-Furman O. Rosetta FlexPepDock web server–high resolution modeling of peptide-protein interactions. Nucleic Acids Res. 2011;39:W249–W253. doi: 10.1093/nar/gkr431. [DOI] [PMC free article] [PubMed] [Google Scholar]
- 33.Raveh B, London N, Zimmerman L, Schueler-Furman O. Rosetta FlexPepDock ab-initio: simultaneous folding, docking and refinement of peptides onto their receptors. PLoS ONE. 2011;6:e18934. doi: 10.1371/journal.pone.0018934. [DOI] [PMC free article] [PubMed] [Google Scholar]
- 34.Berman HM, Westbrook J, Feng Z, Gilliland G, Bhat TN, Weissig H, Shindyalov IN, Bourne PE. The protein data bank. Nucleic Acids Res. 2000;28:235–242. doi: 10.1093/nar/28.1.235. [DOI] [PMC free article] [PubMed] [Google Scholar]
- 35.Stark A, Russell RB. Annotation in three dimensions. PINTS: patterns in non-homologous tertiary structures. Nucleic Acids Res. 2003;31:3341–3344. doi: 10.1093/nar/gkg506. [DOI] [PMC free article] [PubMed] [Google Scholar]
- 36.Russell RB, Barton GJ. Multiple protein sequence alignment from tertiary structure comparison: assignment of global and residue confidence levels. Proteins. 1992;14:309–323. doi: 10.1002/prot.340140216. [DOI] [PubMed] [Google Scholar]
- 37.Humphrey W, Dalke A, Schulten K. VMD: visual molecular dynamics. J. Mol. Graph. 1996;14:33–38. doi: 10.1016/0263-7855(96)00018-5. [DOI] [PubMed] [Google Scholar]
- 38.Murai MJ, Chruszcz M, Reddy G, Grembecka J, Cierpicki T. Crystal structure of menin reveals binding site for mixed lineage leukemia (MLL) protein. J. Biol. Chem. 2011;286:31742–31748. doi: 10.1074/jbc.M111.258186. [DOI] [PMC free article] [PubMed] [Google Scholar]
- 39.Yokoyama A, Somervaille TCP, Smith KS, Rozenblatt-Rosen O, Meyerson M, Cleary ML. The menin tumor suppressor protein is an essential oncogenic cofactor for MLL-associated leukemogenesis. Cell. 2005;123:207–218. doi: 10.1016/j.cell.2005.09.025. [DOI] [PubMed] [Google Scholar]
- 40.Caslini C, Yang Z, El-Osta M, Milne TA, Slany RK, Hess JL. Interaction of MLL amino terminal sequences with menin is required for transformation. Cancer Res. 2007;67:7275–7283. doi: 10.1158/0008-5472.CAN-06-2369. [DOI] [PMC free article] [PubMed] [Google Scholar]
- 41.Grembecka J, Belcher AM, Hartley T, Cierpicki T. Molecular basis of the mixed lineage leukemia-menin interaction: implications for targeting mixed lineage leukemias. J. Biol. Chem. 2010;285:40690–40698. doi: 10.1074/jbc.M110.172783. [DOI] [PMC free article] [PubMed] [Google Scholar]