

Abstract
Natural killer (NK) cells are essential for healthy aging. NK cell activation is controlled by MHC class I-specific CD94/NKG2 receptors and killer immunoglobulin-like receptors (KIR). To assess NK cytotoxic function in isolation from MHC receptor engagement, we measured the ability of purified NK cells to kill mouse P815 target cells in the presence of anti-CD16 mAb. CD16-mediated cytotoxicity did not change with age, indicating that NK activation and cytotoxic granule release remained functional. We then investigated MHC class I receptor expression on NK cells. There was an age related decrease in CD94 and NKG2A expression and a reciprocal age related increase in KIR expression. NKG2A expression also declined with age on CD56+ T cells. CD94/NKG2A receptor function was proportional to expression, indicating that NK cell inhibitory signaling pathways were intact. NKG2A and KIR expression were complementary, suggesting that CD94/NKG2A function could substitute for inhibitory KIR function during polyclonal NK cell development in both young and elderly adults. The distinct roles of CD94/NKG2A and KIR receptors suggest that shifting MHC class I receptor expression patterns reflect age related changes in NK cell and CD56+ T cell turnover and function in vivo.
Keywords: Natural killer, Aging, Receptor, MHC class I, KIR, CD94, NKG2A, Cytotoxicity, NKT
1. Introduction
Natural killer (NK) cells are antigen-nonspecific lymphocytes that rapidly respond to infected and aberrant cells (Trinchieri, 1989). NK cells kill abnormal cells and orchestrate subsequent adaptive T and B lymphocyte immune responses. NK activation is governed by a balance of signals from stimulatory receptors and MHC class I-specific inhibitory receptors (Lanier et al., 1997). NK cells respond to virus infected cells and cancer cells that have down regulated MHC class I molecules because NK stimulatory receptor signals are no longer balanced by inhibitory receptor signals. The most important MHC class I-specific receptors, CD94/NKG2 and KIR, are expressed by most NK cells and a minority of T cells. CD94/NKG2 receptors are heterodimers composed of an invariant CD94 chain that is paired with NKG2A, NKG2C, NKG2E, and possibly other NKG2 family members (Borrego et al., 2002). NKG2A is inhibitory and NKG2C and NKG2E are stimulatory (Borrego et al., 2002). Both stimulatory and inhibitory CD94/NKG2 heterodimers bind to the nonclassical MHC class I molecule, HLA-E. Individual NK cells may express either inhibitory or stimulatory NKG2 family members. KIR molecules are encoded by a large gene family and the number of KIR genes shows considerable genetic variation (Carrington and Norman, 2003). The KIR family also includes both inhibitory and stimulatory members, although the ligand specificity of stimulatory KIR is controversial. Individual NK cells may express from one to several KIR genes in a nearly random pattern that is controlled by DNA methylation of individual KIR alleles (Chan et al., 2003; Santourlidis et al., 2002; Valiante et al., 1997).
People with severe NK cell deficiency suffer from increased infections and may be susceptible to certain tumors (Ballas et al., 1990; Biron et al., 1989). Aging also is associated with risk of serious infection and cancer (Pawelec et al., 2003), so it is appropriate to question whether NK cell function is impaired in aging. Most studies of NK cells and aging have focused on overall NK cell number and global NK cytotoxic activity, with little regard for specific NK subsets. Depressed NK function in the elderly is associated with an increased incidence of pneumonia and infectious disease deaths (Ogata et al., 2001). NK cell number increases with healthy aging (Ligthart et al., 1989), but changes in NK function are less clear. Several groups found that NK-mediated cytotoxicity rose with aging (Krishnaraj and Svanborg, 1992; Ligthart et al., 1989). However, some have reported that NK activity declined with aging when it was measured on a per cell basis (Facchini et al., 1987; Mariani et al., 1998; Mariani et al., 1994) and others found that cytokine-stimulated NK cytotoxicity toward certain tumor cells declined with aging (Kutza and Murasko, 1994). Scattered and sometimes conflicting evidence suggests that NK cells may exhibit phenotypic changes with aging. For example, the elderly may have higher proportions of CD56dim and CD57+ NK cells (Borrego et al., 1999; Krishnaraj and Svanborg, 1992; Plackett et al., 2004; Sansoni et al., 1993). Based on a limited number of studies with mixed results, KIR+ NK cells may increase with age (Mariani et al., 1994; Mariani et al., 1997). Interpretation of these studies is confounded by considerable KIR genetic variation (Carrington and Norman, 2003). In addition, most anti-KIR mAb bind to both stimulatory and inhibitory family members and these two types of KIR molecules may be regulated separately. Therefore, the reported decline in NK cell reactivity based on cytotoxicity assays may be due either to changes in inhibitory and stimulatory receptor expression or to changes in the intrinsic ability of NK cells to become stimulated and carry out cytotoxicity effector function.
Aging is associated with a clear-cut decline in T cell number and T cell function (Tarazona et al., 2000). During aging, T cells acquire expression of molecules usually associated with NK cells, including CD16, CD56, CD57, and CD94. T cells with NK associated markers are found in much smaller numbers in young adults and are not identical to the regulatory NKT cells that express the highly restricted Vα24 TCR (Tarazona et al., 2000). Studies have shown that T cells with NK associated markers from elderly subjects are hyporesponsive to antigen stimulation (Tarazona et al., 2000). It is not clear whether or not the hyporeactive T cells express elevated levels of MHC-specific inhibitory receptors.
In the current study we investigated possible age related changes in receptors for MHC class I molecules. We tested whether aging affected NK activation in the absence of MHC receptor engagement. We also measured whether there were age related changes in CD94, NKG2A, and KIR expression on conventional NK cells (CD3−CD56+), conventional T cells (CD3+CD56−) or T cells with NK markers (CD3+CD56+). Finally, we investigated CD94/NKG2A and KIR function in NK activation.
2. Materials and methods
2.1. Study subjects
Fifteen young (ages 21–30) and 15 elderly (ages over 65) subjects were recruited via community advertisements and from the local senior citizen center. Subjects were screened by telephone interview to exclude those with conditions previously demonstrated to affect NK cells. Exclusion criteria included history of immunologic illness, current use of immunomodulatory medications (e.g., systemic steroids), regular consumption of two or more alcoholic beverages per day (28 g ethanol), morbid obesity (body mass index > 40), and score within the depressed range (score > 15) on the Center for Epidemiological Studies Depression Scale (CES-D). Blood samples (155 mL) were obtained as close as possible to 08:00 h. Blood was assessed for erythrocyte folate and serum Vitamin B12 by the University of Iowa Hospital Laboratories and for lymphocyte analysis, as described below. One elderly male (subject 12) had low Vitamin B12 (46 pg/mL), but was not excluded because it is not an established exclusion criterion (Ligthart et al., 1984). Values for this subject are denoted by diamonds in the scatter plots. One elderly female subject was excluded from analysis because her peripheral blood contained a population of clonally expanded NK cells with aberrant lineage marker expression (MBM, manuscript in preparation). All significant age and gender related associations cited below also were statistically significant when this subject was included in our analysis (data not shown).
2.2. Reagents
Anti-CD3-FITC, anti-CD3-biotin, anti-CD3-Cy5PE, anti-CD14-Cy5PE, anti-CD19-Cy5PE, anti-CD56-PE, anti-CD56-APC, anti-NKG2A-PE (Z199), and various labeled and unlabeled anti-KIR mAb were obtained from Beckman Coulter (Fullerton, CA), including EB6-PE, GL183-PE, and KIR p70-PE. Anti-KIR mAb, NKB1-biotin (DX9) and GL183-FITC were obtained from Pharmingen (San Diego, CA). Anti-CD94-biotin mAb was obtained from Ancell Corp. (Bayport, MN). Mouse isotype control mAb were purchased from Beckman Coulter, Pharmingen, Southern Biotech (Birmingham, AL) and R&D Systems (Minneapolis, MN). HP-3E4 anti-KIR ascites was provided by Dr. Miguel López-Botet (Universidad Pompeu Fabra). The 3G8 anti-CD16 and 5.133 anti-KIR hybridomas were provided by Dr. Bice Perussia (Thomas Jefferson University) and Dr. Marco Colonna (Washington University, St. Louis), respectively.
2.3. Cell isolation and enrichment
Peripheral blood mononuclear cells (PBMC) were isolated by density gradient centrifugation on Histopaque-1077 cell separation medium (Sigma, St. Louis, MO) as described (Moore et al., 2003). NK cells were enriched as described (Moore et al., 2003). Briefly, blood was incubated with antibody complexes bispecific for glycophorin A and leukocyte CD3, CD4, CD19, CD36 or CD66b (Rosette-Sep™, StemCell, Vancouver, British Columbia, Canada). Erythrocyte–leukocyte rosettes were removed by centrifugation through a Ficoll density gradient (Sigma-Aldrich, St. Louis, MO). This technique routinely produced 85–90% CD56+ cells.
2.4. Flow cytometry
To reduce flow cytometry background, monocytes and B cells in the PBMC population were excluded using Cy5PE labeled anti-CD14 and anti-CD19 mAb. Three flow cytometry strategies were used to assess NK and T cell surface expression. In the first strategy, anti-CD3 and anti-CD56 mAb were used to define four subsets: conventional T cells (CD3+CD56−), conventional NK cells (CD3−CD56+), CD56+ T cells (CD3+CD56+), and quadruple negative (QN) cells (CD3−CD14−CD19−CD56−). Binding of an anti-KIR mAb cocktail (Table 1), anti-CD94, and anti-NKG2A were assessed separately on each of the four populations. The second strategy was similar to the first strategy, except that anti-CD56 mAb was eliminated. Using pairs of separately labeled anti-KIR mAb (EB6/DX9 and GL183/HP3E4), KIR expression was assessed on all T cells, including both conventional T cells and CD56+ T cells, and on all non-T, non-monocyte, non-B cells (CD3−, CD14−, CD19−) that included both NK and QN cells. In the third strategy, antibodies to CD3, CD14, and CD19 were all Cy5PE labeled and used to exclude the T cells, monocytes, and B cells. The remaining NK and QN cells were assessed with combinations of anti-receptor mAb labeled with two or three separate fluorochromes (GL183/DX9/EB6, GL183/DX9/NKG2A, and anti-KIR cocktail/CD94). Stained cells were analyzed on a FACSCalibur flow cytometer (BD Biosciences, San Jose, CA) and data was analyzed using FlowJo software (TreeStar, San Carlos, CA).
Table 1.
KIR mAb specificity
| mAb | KIR specificitya |
|---|---|
| GL183b | 2DL2, 2DL3, 2DS2 |
| EB6b | 2DL1, 2DS1 |
| KIR p70b, DX9 | 3DL1 |
| HP-3E4 | 2DL1, 2DL2, 2DL3, 2DS4, 2DS5 |
| 5.133 | 3DL1, 3DL2, 2DS4 |
Reference (Campbell and Colonna, 2000).
Used in flow cytometry anti-KIR mAb cocktail.
2.5. Cytotoxicity assay
Enriched NK cells and 51Cr labeled mouse P815 target cells were incubated together at effector:target ratios of 24:1, 6:1, 1.5:1, and 0.38:1 in V-bottom microtiter plates for 5 h, alone or with various antibody combinations. The antibodies included 3G8 anti-CD16 mAb, anti-KIR mAb cocktail (EB6, GL183, and 5.133), Z199 anti-NKG2A mAb, and control IgG mAb. Cytotoxicity data were expressed as lytic units (LU20), which were calculated using the exponential fit equation (Trinchieri, 1989). LU20 are inversely related to the number of NK cells needed to cause 20% cytotoxicity. When calculating percentage inhibition by anti-NKG2A mAb, negative inhibition was counted as zero.
2.6. Statistical analysis
Descriptive data are presented in the form of raw means (Table 2) as well as adjusted means superimposed on scatter plots showing individual values (Figs. 4 and 6). Assessments of age and gender were made using two-way ANOVA. The interaction between age and gender was also assessed in these models. The means superimposed on the scatter plots in the relevant figures are least squares means. Therefore, the reported means for the two age groups have been adjusted for gender, and likewise, the reported means for gender have been adjusted for age. A reduced main effects model using age and gender was fit in calculating the means in the absence of a significant interaction. All p-values reported are based on comparing the adjusted means, and all are two-sided. A per-comparison Type I error rate (as opposed to an experiment-wise error rate) was set at 5%. In cases where an interaction between age and gender was found, the scatter plots will reflect this by plots of the data over the four comparison groups (young female, young male, elderly female, and elderly male) with superimposed p-values corresponding to the significant comparisons found (see Fig. 6). Associations between various levels of expression and either inhibition or stimulation parameters were assessed using multiple linear regression adjusting for age. Data are reported as slopes with corresponding p-values indicating strength of the association adjusted for age (Fig. 5). Regression diagnostics of the 2-way ANOVA models as well as the multiple linear regression models to assess associations revealed no apparent lack of fit or violation of model assumptions.
Table 2.
NK receptor expression on T cells
| Percentage of conventional T cellsa
|
Percentage of CD56+ T cellsa
|
||||||
|---|---|---|---|---|---|---|---|
| KIR | EB6 | CD94 | NKG2A | KIR | CD94 | NKG2A | |
| Young females | 1.9 | 1.2 | 3.8 | 2.3 | 17.5 | 36.2 | 21.0 |
| Young males | 2.1 | 0.4 | 6.2 | 4.7 | 34.1 | 55.2 | 31.7 |
| Elderly females | 1.8 | 0.4 | 4.2 | 2.2 | 23.1 | 37.5 | 15.0 |
| Elderly males | 2.1 | 0.9 | 4.4 | 2.0 | 18.4 | 28.9 | 9.1 |
Shown is the mean percentage of cells that express the marker indicated below.
Fig. 4.

NK cell NKG2A expression decreased and KIR expression increased with age. NK cells were gated and the percentage of receptor positive cells was quantified as illustrated in Fig. 1. Shown are individual and mean age group values without gender correction. The young (Y) and elderly (E) subjects differed significantly in the percentage of conventional CD3−CD56+ NK cells that expressed cell surface NKG2A (A) and KIR (B). Differences were significant with or without correction for gender interaction.
Fig. 6.
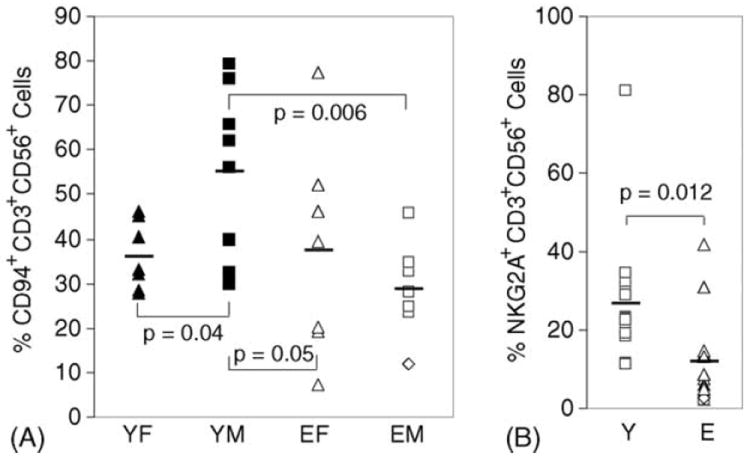
CD94 and NKG2A expression showed age and gender interactions on CD56+ T cells. CD56+CD3+ cells were gated and anti-receptor mAb staining was quantified as illustrated in Fig. 1. Shown are individual and mean age group values without correction for age or gender interaction. The statistically significant differences were based on correction for age and gender interaction. (A) Young males (YM) had significantly higher percentage of CD56+ T cells that expressed CD94. (B) Young (Y) and elderly (E) adult subjects differed significantly in the percentage of CD56+ T cells that expressed cell surface NKG2A.
Fig. 5.

Correlation between MHC receptor expression and mAb-mediated NK cytotoxicity. For all figures the putative linear relationship was tested using gender-corrected values, but uncorrected values are shown for individual young females (YF), young males (YM), elderly females (EF), and elderly males (EM). Values for subject 12 are shown as diamonds. (A) The percentage NK cells expressing NKG2A correlated linearly with anti-NKG2A mAb inhibition of CD16-mediated cytotoxicity. Cytotoxicity of 51Cr labeled mouse P815 cells by purified NK cells was measured in the presence of 3G8 anti-CD16 mAb in combination with either control IgG mAb or Z199 anti-NKG2A mAb. Anti-NKG2A inhibition of CD16-mediated cytotoxicity was calculated in comparison to cytotoxicity of anti-CD16 and control IgG mAb. (B) The percentage NK cells expressing NKG2A correlated inversely with the percentage NK cells expressing KIR. (C) The percentage NK cells expressing KIR did not correlate with KIR-mediated cytotoxicity. Cytotoxicity of 51Cr labeled mouse P815 cells by purified NK cells was measured in the absence of mAb or in the presence of anti-KIR mAb cocktail, EB6, GL183, and 5.133. KIR stimulation is expressed as lytic units. (D) The percentage NK cells expressing NKG2A correlated linearly with KIR-mediated cytotoxicity, measured as in (C).
3. Results
3.1. CD3 and CD56 cell surface expression in the peripheral blood lymphocytes
Using flow cytometry, we defined four NK and T cell related populations: CD3+CD56− conventional T cells, CD3−CD56+ conventional NK cells, CD3+CD56+ T cells with NK markers, and CD14−CD19−CD3−CD56− quadruple negative (QN) cells that did not express conventional monocyte, B cell, T cell, or NK cell markers (Fig. 1). The QN cells included CD16+CD56− NK cells, NK cell precursors, and uncharacterized cells (data not shown). Compared with young adults, elderly subjects had a lower percentage of peripheral blood conventional T cells and total CD3+ T cells (Fig. 2). In compensation, elderly subjects had an increased percentage of non-T subsets, including conventional NK cells and QN cells. The decreased percentage of T cells and increased percentage of NK cells in the elderly subjects confirms previous work and serves to validate the current study population (Tarazona et al., 2000).
Fig. 1.

Flow cytometry gating strategy. Peripheral blood mononuclear cells from a young subject (top) and an elderly subject (bottom) were stained with Cy5 PE labeled anti-CD14 and anti-CD19, FITC labeled anti-CD3, APC labeled anti-CD56, and PE labeled anti-NKG2A mAb as described in Section 2. Left panel: After CD14+ monocytes and CD19+ B cells were excluded, CD3 and CD56 staining on a logarithmic scale revealed four major T and NK related populations. Right panel: NKG2A expression on CD3−CD56+ conventional NK cells. The bar indicates staining that is above background.
Fig. 2.

The proportion of NK, T, and related cells in peripheral blood. Major T, NK, and related populations were quantified as illustrated in Fig. 1. Compared with young adult subjects (inner ring), elderly subjects (outer ring) had lower percentages of CD3+CD56− conventional T cells (T, p ≤ 0.0001) and CD3+ total T cells (T and NKT, p ≤ 0.0006) and a higher percentage of CD3−CD14−CD19−CD56− quadruple negative (QN, p ≤ 0.008) cells. The age differences were significant whether or not subject 12 was included in the analysis and the most conservative of the p-values are shown. Elderly subjects also had a higher percentage of CD3−CD56+ conventional NK cells (p = 0.052 with subject 12 included and p = 0.033 with subject 12 excluded).
3.2. NK cells from elderly subjects respond normally to CD16 crosslinking
NK activation is governed by a balance of signals from stimulatory receptors and MHC class I-specific inhibitory receptors (Lanier et al., 1997). To assess NK cytotoxic function while avoiding possible age related differences in MHC-specific receptor expression, we activated purified NK cells by selectively crosslinking the CD16 receptor. CD16 crosslinking activates NK cells to kill 51Cr-labeled P815 target cells. Using this assay, we observed a wide range of CD16-mediated cytotoxic responses (Fig. 3), but no age related (p = 0.97) or gender related (p = 0.99) differences. P815 cells were never killed in the absence of mAb (data not shown), indicating that cytotoxicity required CD16 activation. Consistent with other findings (Facchini et al., 1987; Mariani et al., 1998; Mariani et al., 1994), this result shows that there is no age related decline in ability to kill target cells in response to CD16 crosslinking.
Fig. 3.

NK CD16-mediated cytotoxicity did not vary with age or gender. Enriched NK cells were incubated with 3G8 anti-CD16 mAb and 51Cr labeled mouse P815 target cells. Shown are the cytotoxicity values expressed as lytic units for each subject and the mean value without adjustment. One elderly male was not tested due to an insufficient purified NK cell yield.
3.3. Age related changes in NK CD94/NKG2A expression
Because we did not find an inherent defect in NK activation, we examined two MHC class I-specific receptor families that are expressed in a stochastic pattern, CD94/NKG2 and KIR. We found a significant age related reduction in the mean percentage of conventional NK cells that expressed CD94 (p = 0.03), from 70% to 58% (data not shown). Both stimulatory and inhibitory CD94/NKG2 heterodimers are detected by anti-CD94 mAb. To specifically examine whether inhibitory CD94/NKG2A receptors changed with aging, we measured NKG2A on conventional NK cells. Like CD94, NKG2A expression significantly declined with age (Fig. 4A). Therefore, during aging, fewer NK cells express the inhibitory CD94/NKG2A receptor complex.
3.4. CD94/NKG2A receptors are inhibitory regardless of age
We wished to determine whether the CD94/NKG2A heterodimers were functional. To test this, we measured the CD16-mediated cytotoxicity of purified NK cells toward P815 target cells in the presence of either control IgG or anti-NKG2A mAb. Anti-NKG2A mAb is expected to inhibit CD16-mediated cytotoxicity. In both age groups there was a strong linear relationship between NKG2A expression and the percent inhibition mediated by anti-NKG2A mAb (Fig. 5A). This finding suggests that the CD94/NKG2A inhibitory receptor was functional in both young and elderly adults.
3.5. Age related changes in NK KIR expression
Like CD94/NKG2 receptors, KIR may be stimulatory or inhibitory and have a stochastic expression pattern on NK cells. To approximate overall KIR expression on conventional NK cells, we used a cocktail of three anti-KIR mAb that were labeled with the same fluorescent tag (Table 1). The cocktail is capable of detecting six distinct KIR proteins, including both stimulatory and inhibitory KIR. In contrast to CD94/NKG2A expression, we found a significant age related increase in the percentage of NK cells that expressed KIR (Fig. 4B). There was no significant gender interaction (data not shown).
We also measured expression of various KIR subsets using anti-KIR mAb alone and in combination. Binding of individual anti-KIR mAb (GL183, EB6, DX9, and HP-3E4) was assessed on CD3−CD14−CD19−CD56+ NK cells as described in Section 2.4. In addition, we stained cells with Cy5PE-labeled anti-CD3, -CD14, and -CD19 to exclude T, monocyte, and B cells. The nonexcluded cells were predominantly NK cells (data not shown). This allowed us to assess seven patterns of KIR expression using combinations of GL183, EB6, and DX9 mAb labeled with different fluorescent tags. None of the individual or combined anti-KIR mAb showed significant age related variation except GL183+EB6+ double positive staining, which was increased in the elderly subjects (p = 0.04). KIR expression is limited by the subject’s KIR genotype, which varies in KIR gene number and identity (Carrington and Norman, 2003). This introduces the possibility that chance assortment of KIR genotypes may have obscured age related expression patterns. Indeed, the anti-KIR cocktail staining results had significantly less data dispersal than did individual anti-KIR mAb staining results (data not shown). Overall, our findings indicate that a greater percentage of NK cells express KIR during aging. The age related change may be due to increased expression of stimulatory KIR, inhibitory KIR, or both.
3.6. NK cell inhibitory receptor co-expression
NK clones express at least one inhibitory KIR or CD94/NKG2A receptor for self MHC class I molecules (Valiante et al., 1997). This finding is consistent with the hypothesis that functional inhibitory receptor expression allows developing NK cells to avoid negative selection. A prediction of this hypothesis is that CD94/NKG2A can replace inhibitory KIR expression. Although this was confirmed using NK clones, lymphocyte cloning involves selective pressures that favor cells with particular MHC class I-specific receptors (Young et al., 2001). Therefore, we sought to test whether CD94/NKG2A could substitute for inhibitory KIR expression in polyclonal peripheral blood NK cells that had not been cultured. A major prediction of the hypothesis is that fewer CD94/NKG2A+ NK cells express KIR than do CD94/NKG2A− NK cells. When we compared the percentage of NK cells that expressed NKG2A and KIR, we found a significant negative correlation between NKG2A and KIR expression (Fig. 5B) that included all four age and gender groups (data not shown). Although the anti-KIR cocktail did not exclusively bind inhibitory KIR (Table 1), this result is consistent with the hypothesis that NK cell CD94/NKG2A expression can substitute for inhibitory KIR expression.
We compared the amount of KIR-induced cytotoxicity with the percentage of NK cells that expressed KIR molecules. Crosslinking stimulatory KIR with mAb causes cytotoxicity of P815 cells (Moretta et al., 1995). Crosslinking inhibitory KIR or co-crosslinking both stimulatory and inhibitory KIR on the same NK cell produces no cytotoxicity. Therefore, the amount of cytotoxicity mediated by anti-KIR mAbs will reflect the percentage of NK cells that express one or more stimulatory KIR unopposed by inhibitory KIR bound by the same mAb cocktail. We found no significant relationship between the percentage of NK cells that expressed cell surface KIR and the level of cytotoxicity induced by anti-KIR mAb (Fig. 5C). The slope of the line was nearly flat and the association was not statistically significant. We favor the interpretation that KIR expression is not random and that stimulatory KIR are often co-expressed with inhibitory KIR, as has been reported for NK clones (Valiante et al., 1997). In contrast to this lack of correlation, there was a significant positive relationship between the percentage of NK cells that expressed cell surface NKG2A and the level of cytotoxicity induced by anti-KIR mAb. When NKG2A was expressed on many NK cells, anti-KIR mAb triggered relatively high levels of cytotoxicity (Fig. 5D). Both young and elderly subjects contributed to this trend. These findings indicate that polyclonal peripheral blood NK cells which express inhibitory NKG2A are more likely to express stimulatory KIR unopposed by inhibitory KIR. This finding is consistent with the hypothesis that either CD94/NKG2A or inhibitory KIR can help NK cells avoid negative selection during development.
3.7. Age and gender related changes in T cell KIR and CD94/NKG2A expression
Aging is characterized by increasing numbers of T cells that express NK-related receptors (Tarazona et al., 2000). We wished to examine whether KIR and CD94/NKG2A receptor expression on T cells changed with age. Consistent with other reports, KIR expression was much lower on conventional CD3+CD56− T cells than on NK cells (Table 2, Fig. 4). With one exception, there were no age or gender trends. Although EB6 anti-KIR mAb binding showed an age and gender interaction that reached statistical significance (data not shown), the biological significance of small changes in this minor T cell population is not clear. CD94 expression was higher than KIR expression on conventional T cells, although these levels were low in comparison to levels on NK cells. CD94 and NKG2A expression on CD3+CD56− conventional T cells did not show age or gender trends.
By definition CD3+CD56+ cells are T cells with NK-related markers and, as expected, this population expressed considerably more KIR, CD94, and NKG2A than did conventional T cells (Table 2). CD56+ T cells showed a complex age and gender related change in which young males had significantly more CD94+ cells than the three other age and gender groups (Fig. 6A). CD56+ T cell NKG2A expression showed a highly significant age associated decline, without a significant gender component (Fig. 6B). The percentage CD56+ T cells that expressed NKG2A in elderly subjects were less than half of that in young subjects (Table 2). Thus, both NK cells and CD56+ T cells lost inhibitory NKG2A expression with age. However, unlike NK cells, the CD56+ T cells did not gain KIR expression with age (Table 2 and data not shown).
4. Discussion
The previously reported age related decline in NK function could be due to changes in NK receptor expression or to changes in intracellular signaling molecules and cytotoxic granules. To bypass the question of variable MHC class I receptor expression, we stimulated NK cells by antibody crosslinking the CD16 receptor. CD16 is a well-known signaling molecule and CD16 density per NK cell does not change with age (Mariani et al., 1998). We found that CD16-induced cytotoxicity did not significantly vary with age or gender. This finding is consistent with reports that antibody dependent cellular cytotoxicity, a measure of CD16 signaling, did not differ between young and elderly subjects (Mariani et al., 1998; Plackett et al., 2004; Sansoni et al., 1993). The level of perforin, a key component of cytotoxic granules, may decline with age in NK cells (Rukavina et al., 1998), although this is controversial (Mariani et al., 1996). Regardless of perforin levels, our results show that cytotoxic mechanisms were sufficiently robust for NK cells from both young and elderly subjects to lyse P815 target cells. Although we have not directly measured NK cytotoxicity of human target cells or in response to crosslinking receptors other than CD16, our results do not support the hypothesis that NK cells in the elderly have intrinsic defects in intracellular signaling pathways or cytotoxic granule release. Therefore, we turned our attention to two receptor gene families that encode receptors for MHC class I molecules. CD94/NKG2 and KIR receptors may be either stimulatory or inhibitory and substantially regulate NK activation (Borrego et al., 2002). These receptors also were of interest because they are expressed in a stochastic pattern on human NK cells and could therefore be subject to regulation not found for other gene families (Chan et al., 2003; Santourlidis et al., 2002; Valiante et al., 1997).
We found that KIR expression increased with age. The age related change in KIR expression was detected with a cocktail of three anti-KIR mAb, but not with individual anti-KIR mAb. This may be due to the fact that individuals differ widely in the number of KIR genes available (Carrington and Norman, 2003) and reflects previously reported inconsistent associations of age and KIR expression using various anti-KIR mAb (Mariani et al., 1994; Mariani et al., 1997). Despite considerable genetic variation in the number and identity of KIR genes, it should be noted that survival to old age did not correlate with KIR genotype or any particular KIR gene (Maxwell et al., 2004). This indicates that most individuals have a KIR repertoire that is sufficient to maintain good health for many decades. Increased KIR expression in the elderly was balanced by decreased CD94/NKG2A expression. Although CD94/NKG2A expression was reported to be stable in five subjects studied over 13 months (Shilling et al., 2002), stability has not been tested over the long intervals that separated our young adult and elderly subjects. Our finding of a significant inverse relationship between NKG2A expression and KIR expression is similar to that reported in a study of sibling pairs (Shilling et al., 2002). Together, the current and previously reported results reinforce the concept, established in NK clones, that either CD94/NKG2A or inhibitory KIR can help developing NK cells avoid negative selection (Valiante et al., 1997).
It has long been recognized that T cell function declines with age. Correlating with this age associated decline in T cell function, more T cells express markers associated with NK cells, including CD56 and CD94 (Plackett et al., 2004; Sansoni et al., 1993; Tarazona et al., 2000). NK associated markers may be expressed by several distinct groups of T cells with contrasting functional states. NKT cells denote a small T cell subset with NK associated markers that express a distinct Vα24-JαQ T cell receptor with specificity for α-galactosyl ceramide bound to CD1d antigen presenting molecules (Prussin and Foster, 1997). These NKT cells have powerful immunoregulatory properties and secrete both IFN-γ and IL-4 in large amounts. CD8 T cells that have been recently activated also express CD56 and other NK associated markers (Pittet et al., 2000). These T cells exhibit robust cytotoxic activity and often account for the majority of virus-specific cytotoxicity in peripheral blood lymphocytes. Aging is characterized by an accumulation of hyporeactive, apoptosis-resistant T cells that express NK associated markers (Tarazona et al., 2000). Therefore, CD56+ T cells belong to distinct lineages and exhibit multiple functional states. Little is known about the distribution of MHC class I-specific receptors in these cells. In our study CD56+ T cells showed an age related decrease in NKG2A expression, the inhibitory co-receptor partner of CD94. Although CD56+ T cells decreased NKG2A expression with age, they did not increase KIR expression. This observation suggested the hypothesis that CD56+ T cells have a relative paucity of inhibitory receptors in elderly people. This hypothesis was further supported by the observation that among the CD94+CD56+ T cells, only 36.2% co-expressed NKG2A in the elderly compared to 59.5% in young adults (data not shown). This contrasted with 75.8% NKG2A co-expression by CD94+ NK cells, a frequency that did not differ between the age groups (data not shown). Therefore, the elderly appeared to have a greater ratio of stimulatory to inhibitory CD94/NKG2 receptors on CD56+ T cells. The shift to stimulatory receptors may be an adaptive response to allow the elderly to compensate for their overall decline in T cell function. However, we cannot exclude the possibility that CD56+ T cells in the elderly may change the balance of inhibitory and stimulatory KIR expression to make up for the loss in NKG2A expression. It will be important to characterize the activation potential of NK cells and CD56+ T cells that express KIR and CD94/NKG2A receptors.
There are several limitations to this work. First, the sample size is small and associations with moderate effect sizes may not have reached significance. As for all studies in human populations, results should be regarded as tentative until they are confirmed in an independent study population. Second, KIR bound by most of our mAb may be either stimulatory or inhibitory. Although our KIR-mediated cytotoxicity experiments suggested that the age related decrease in inhibitory CD94/NKG2A complexes is balanced by a compensatory increase in inhibitory KIR expression, it will be important to directly test this hypothesis. Third, our findings are correlative, and understanding of the causal mechanisms involved awaits further experimentation. It will be particularly important to investigate whether the changes in receptor expression reflect a change in gene expression programs by NK subsets that are numerically stable or a shift in the distribution of the NK subpopulations.
Stochastic KIR expression in NK cells is controlled by DNA methylation (Chan et al., 2003; Santourlidis et al., 2002). DNA methylation declines with aging and is deficient in some elderly subjects (Jacob et al., 1998; Wilson and Jones, 1983). These findings suggest that increased KIR expression in aging may be secondary to defects in DNA methylation. NKG2 expression also is stochastic, but DNA methylation control of NKG2 expression has not been reported. Even if NKG2A expression is regulated by DNA methylation, the reported methylation deficiency in elderly subjects may not equally affect all genes and all cell types. It is not clear whether correction of methylation deficiency in elderly subjects will shift the balance of CD94/NKG2A and KIR expression. Vitamin B12 is important for maintaining DNA methylation levels (Cooney, 1993). We note that one elderly subject with a low Vitamin B12 level had a CD94/NKG2A and KIR balance on NK cells that was similar to that of other elderly subjects (Fig. 4). This elderly subject, however, had relatively low CD94 and NKG2A expression on CD56+ T cells (Fig. 6, diamonds).
Inhibitory signaling through CD94/NKG2A and KIR molecules appear to be equivalent in many settings (Borrego et al., 2002) and the “rule” that mature NK cell clones must express at least one inhibitory receptor for self MHC class I molecules is satisfied by either CD94/NKG2A or KIR molecules (Valiante et al., 1997). However, CD94/NKG2 and KIR receptors clearly are not equivalent. CD94/NKG2A and KIR molecules recognize distinct MHC molecules and CD94/NKG2 receptors are expressed earlier than other MHC class I-specific receptors in mouse and human NK development in vivo and in vitro (Borrego et al., 2002; Mingari et al., 1997; Sivakumar et al., 1999). These receptors are not expressed equivalently by NK subsets. CD56dim NK cells may express CD94/NKG2A, KIR, or both receptors. In contrast, nearly all CD56bright NK cells express CD94/NKG2A and few express KIR molecules (Cooper et al., 2001). KIR expression appears to be essential for avoidance of T cell activation induced cell death in several settings (Ugolini et al., 2001; Young et al., 2001). In other settings, CD94 and/or NKG2A engagement promoted apoptosis of human NK cells (Ida et al., 1997) or prevented apoptosis of mouse NK and T cells (Gunturi et al., 2003). The changing balance of KIR and CD94/NKG2A expression with age may be either a cause or a consequence of distinct patterns of NK maturation and survival in the elderly. These hypotheses should be investigated by turnover and senescence studies. Interactions between MHC class I molecules and either CD94/NKG2 or KIR receptors have a powerful influence on the outcome of autoimmune diseases, transplantation, infectious diseases, and cancer (Carrington and Norman, 2003; Gunturi et al., 2003). It is tempting to speculate that the changing balance of NK receptor expression in the elderly may influence susceptibility to infectious, inflammatory, and neoplastic diseases.
Acknowledgments
This work was supported by NIH R01 DE11139, the Carver Foundation, the University of Iowa General Clinical Research Center, and the University of Kentucky Cancer Center. We thank Dr. Linda G. Snetselaar for help with study design, Colleen Fullenkamp and Dr. Phyllis Stumbo for help with donor recruitment and data collection, and Drs. Miguel López-Botet, Bice Perussia, and Marco Colonna for providing antibodies.
References
- Ballas ZK, Turner JM, Turner DA, Goetzman EA, Kemp JD. A patient with simultaneous absence of “classical” natural killer cells (CD3−, CD16+, and NKH1+) and expansion of CD3+, CD4−, CD8− NKH1+ subset. J Allergy Clin Immunol. 1990;85:453–459. doi: 10.1016/0091-6749(90)90155-w. [DOI] [PubMed] [Google Scholar]
- Biron CA, Byron KS, Sullivan JL. Severe herpesvirus infections in an adolescent without natural killer cells. N Engl J Med. 1989;320:1731–1735. doi: 10.1056/NEJM198906293202605. [DOI] [PubMed] [Google Scholar]
- Borrego F, et al. NK phenotypic markers and IL2 response in NK cells from elderly people. Exp Gerontol. 1999;34(2):253–265. doi: 10.1016/s0531-5565(98)00076-x. [DOI] [PubMed] [Google Scholar]
- Borrego F, et al. Structure and function of major histocompatibility complex (MHC) class I specific receptors expressed on human natural killer (NK) cells. Mol Immunol. 2002;38(9):637–660. doi: 10.1016/s0161-5890(01)00107-9. [DOI] [PubMed] [Google Scholar]
- Campbell KS, Colonna M. Appendix I: antibodies to human natural killer cell receptors. In: Campbell KS, Colonna M, editors. Natural Killer Cell Protocols: Cellular and Molecular Methods Methods in Molecular Biology. Humana Press; Tototowa, NJ: 2000. [Google Scholar]
- Carrington M, Norman P. The KIR Gene Cluster. National Library of Medicine (US), National Center for Biotechnology Information; Bethesda, MD: 2003. p. 48. http://ncbi.nlm.nih.gov/entrez/query.fcgi?db=Books. [Google Scholar]
- Chan HW, et al. DNA methylation maintains allele-specific KIR gene expression in human natural killer cells. J Exp Med. 2003;197:245–255. doi: 10.1084/jem.20021127. [DOI] [PMC free article] [PubMed] [Google Scholar]
- Cooney CA. Are somatic cells inherently deficient in methylation metabolism? A proposed mechanism for DNA methylation loss, senescence and aging. Growth Dev Aging. 1993;57:261–273. [PubMed] [Google Scholar]
- Cooper MA, Fehniger TA, Caligiuri MA. The biology of human natural killer-cell subsets. Trends Immunol. 2001;22:633–640. doi: 10.1016/s1471-4906(01)02060-9. [DOI] [PubMed] [Google Scholar]
- Facchini A, et al. Increased number of circulating Leu 11+ (CD 16) large granular lymphocytes and decreased NK activity during human ageing. Clin Exp Immunol. 1987;68:340–347. [PMC free article] [PubMed] [Google Scholar]
- Gunturi A, Berg RE, Forman J. Preferential survival of CD8 Tand NK cells expressing high levels of CD94. J Immunol. 2003;170:1737–1745. doi: 10.4049/jimmunol.170.4.1737. [DOI] [PubMed] [Google Scholar]
- Ida H, Robertson MJ, Voss S, Ritz J, Anderson P. CD94 ligation induces apoptosis in a subset of IL-2-stimulated NK cells. J Immunol. 1997;159(5):2154–2160. [PubMed] [Google Scholar]
- Jacob RA, et al. Moderate folate depletion increases plasma homocysteine and decreases lymphocyte DNA methylation in postmenopausal women. J Nutr. 1998;128:1204–1212. doi: 10.1093/jn/128.7.1204. [DOI] [PubMed] [Google Scholar]
- Krishnaraj R, Svanborg A. Preferential accumulation of mature NK cells during human immunosenescence. J Cell Biochem. 1992;50(4):386–391. doi: 10.1002/jcb.240500407. [DOI] [PubMed] [Google Scholar]
- Kutza J, Murasko DM. Effects of aging on natural killer cell activity and activation by interleukin-2 and IFN-alpha. Cell Immunol. 1994;155(1):195–204. doi: 10.1006/cimm.1994.1112. [DOI] [PubMed] [Google Scholar]
- Lanier LL, Corliss B, Phillips JH. Arousal and inhibition of human NK cells. Immunol Rev. 1997;155:145–154. doi: 10.1111/j.1600-065x.1997.tb00947.x. [DOI] [PubMed] [Google Scholar]
- Ligthart GJ, et al. Admission criteria for immunogerontological studies in man: the SENIEUR protocol. Mech Ageing Dev. 1984;28:47–55. doi: 10.1016/0047-6374(84)90152-0. [DOI] [PubMed] [Google Scholar]
- Ligthart GJ, Schuit HR, Hijmans W. Natural killer cell function is not diminished in the healthy aged and is proportional to the number of NK cells in the peripheral blood. Immunology. 1989;68(3):396–402. [PMC free article] [PubMed] [Google Scholar]
- Mariani E, et al. Age-dependent decreases of NK cell phosphoinositide turnover during spontaneous but not Fc-mediated cytolytic activity. Int Immunol. 1998;10:981–989. doi: 10.1093/intimm/10.7.981. [DOI] [PubMed] [Google Scholar]
- Mariani E, Monaco MC, Cattini L, Sinoppi M, Facchini A. Distribution and lytic activity of NK cell subsets in the elderly. Mech Ageing Dev. 1994;76:177–187. doi: 10.1016/0047-6374(94)91592-x. [DOI] [PubMed] [Google Scholar]
- Mariani E, et al. Perforins in human cytolytic cells: the effect of age. Mech Ageing Dev. 1996;92:195–209. doi: 10.1016/s0047-6374(96)01829-5. [DOI] [PubMed] [Google Scholar]
- Mariani E, et al. CD158a and b workshop: distribution of p58 molecules on peripheral blood lymphocytes during aging. In: Kishimoto T, et al., editors. Leukocyte Typing VI. Garland Publishing, Inc.; New York: 1997. pp. 304–306. [Google Scholar]
- Maxwell LD, Ross OA, Curran MD, Rea IM, Middleton D. Investigation of KIR diversity in immunosenecence and longevity within the Irish population. Exp Gerontol. 2004;39(8):1223–1232. doi: 10.1016/j.exger.2004.05.003. [DOI] [PubMed] [Google Scholar]
- Mingari MC, et al. Interleukin-15-induced maturation of human natural killer cells from early thymic precursors: Selective expression of CD94/NKG2-A as the only HLA class I-specific inhibitory receptor. Eur J Immunol. 1997;27:1374–1380. doi: 10.1002/eji.1830270612. [DOI] [PubMed] [Google Scholar]
- Moore MB, Kurago ZB, Fullenkamp CF, Lutz CT. Squamous cell carcinoma cells differentially stimulate NK cell effector functions: the role of IL-18. Cancer Immunol Immunother. 2003;52:107–115. doi: 10.1007/s00262-002-0361-8. [DOI] [PMC free article] [PubMed] [Google Scholar]
- Moretta A, et al. Existence of both inhibitory (p58) and activatory (p50) receptors for HLA-C molecules in human natural killer cells. J Exp Med. 1995;182:875–884. doi: 10.1084/jem.182.3.875. [DOI] [PMC free article] [PubMed] [Google Scholar]
- Ogata K, et al. Association between natural killer cell activity and infection in immunologically normal elderly people. Clin Exp Immunol. 2001;124(3):392–397. doi: 10.1046/j.1365-2249.2001.01571.x. [DOI] [PMC free article] [PubMed] [Google Scholar]
- Pawelec G, Ouyang Q, Wagner W, Biol D, Wikby A. Pathways to a robust immune response in the elderly. Immunol Allergy Clin North Am. 2003;23(1):1–13. doi: 10.1016/s0889-8561(02)00075-9. [DOI] [PubMed] [Google Scholar]
- Pittet MJ, Speiser DE, Valmori D, Cerottini J-C, Romero P. Cutting edge: cytolytic effector function in human circulating CD8+ T cells closely correlates with CD56 surface expression. J Immunol. 2000;164(3):1148–1152. doi: 10.4049/jimmunol.164.3.1148. [DOI] [PubMed] [Google Scholar]
- Plackett TP, Boehmer ED, Faunce DE, Kovacs EJ. Aging and innate immune cells. J Leukoc Biol. 2004;76(2):291–299. doi: 10.1189/jlb.1103592. [DOI] [PubMed] [Google Scholar]
- Prussin C, Foster B. TCR Va24 and Vb11 coexpression defines a human NK1 T cell analog containing a unique Th0 subpopulation. J Immunol. 1997;159(12):5862–5870. [PubMed] [Google Scholar]
- Rukavina D, et al. Age-related decline of perforin expression in human cytotoxic T lymphocytes and natural killer cells. Blood. 1998;92:2410–2420. [PubMed] [Google Scholar]
- Sansoni P, et al. Lymphocyte subsets and natural killer cell activity in healthy old people and centenarians. Blood. 1993;82(9):2767–2773. [PubMed] [Google Scholar]
- Santourlidis S, et al. Crucial role of DNA methylation in determination of clonally distributed killer cell Ig-like receptor expression patterns in NK cells. J Immunol. 2002;169:4253–4261. doi: 10.4049/jimmunol.169.8.4253. [DOI] [PubMed] [Google Scholar]
- Shilling HG, et al. Genetic control of human NK cell repertoire. J Immunol. 2002;169:239–247. doi: 10.4049/jimmunol.169.1.239. [DOI] [PubMed] [Google Scholar]
- Sivakumar PV, et al. Cutting edge: expression of functional CD94/NKG2A inhibitory receptors on fetal NK1.1+Ly-49− cells: a possible mechanism of tolerance during NK cell development. J Immunol. 1999;162(12):6976–6980. [PubMed] [Google Scholar]
- Tarazona R, et al. Increased expression of NK cell markers on T lymphocytes in aging and chronic activation of the immune system reflects the accumulation of effector/senescent T cells. Mech Ageing Dev. 2000;121:77–88. doi: 10.1016/s0047-6374(00)00199-8. [DOI] [PubMed] [Google Scholar]
- Trinchieri G. Biology of natural killer cells. Adv Immunol. 1989;47:187–376. doi: 10.1016/S0065-2776(08)60664-1. [DOI] [PMC free article] [PubMed] [Google Scholar]
- Ugolini S, et al. Involvement of inhibitory NKRs in the survival of a subset of memory-phenotype CD8+ T cells. Nat Immunol. 2001;2(5):430–435. doi: 10.1038/87740. [DOI] [PubMed] [Google Scholar]
- Valiante NM, et al. Functionally and structurally distinct NK cell receptor repertoires in the peripheral blood of two human donors. Immunity. 1997;7:739–751. doi: 10.1016/s1074-7613(00)80393-3. [DOI] [PubMed] [Google Scholar]
- Wilson VL, Jones PA. DNA methylation decreases in aging but not in immortal cells. Science. 1983;220:1055–1057. doi: 10.1126/science.6844925. [DOI] [PubMed] [Google Scholar]
- Young NT, Uhrberg M, Phillips JH, Lanier LL, Parham P. Differential expression of leukocyte receptor complex-encoded Ig-like receptors correlates with the transition from effector to memory CTL. J Immunol. 2001;166:3933–3941. doi: 10.4049/jimmunol.166.6.3933. [DOI] [PubMed] [Google Scholar]