

SUMMARY
Pigment pattern variation across species or populations offers a tractable framework in which to investigate the evolution of development. Juvenile threespine sticklebacks (Gasterosteus aculeatus) from marine and freshwater environments exhibit divergent pigment patterns that are associated with ecological differences. Juvenile marine sticklebacks have a silvery appearance, whereas sticklebacks from freshwater environments exhibit a pattern of vertical bars. We investigated both the developmental and molecular basis of this population-level variation in pigment pattern. Time course imaging during the transition from larval to juvenile stages revealed differences between marine and freshwater fish in spatial patterns of chromatophore differentiation as well as in pigment amount and dispersal. In freshwater fish, melanophores appear primarily within dark bars whereas iridophores appear within light bars. By contrast, in marine fish, these chromatophores are interspersed across the flank. In addition to spatially segregated chromatophore differentiation, pigment amount and dispersal within melanophores varies spatially across the flank of freshwater, but not marine fish. To gain insight into the molecular pathways that underlie the differences in pigment pattern development, we evaluated differential gene expression in the flanks of developing fish using high throughput cDNA sequencing (RNA-seq) and quantitative PCR. We identified several genes that were differentially expressed across dark and light bars of freshwater fish, and between freshwater and marine fish. Together, these experiments begin to shed light on the process of pigment pattern evolution in sticklebacks.
INTRODUCTION
The neural crest is a transient cell population that forms during vertebrate development, giving rise to a diverse variety of tissue types, including pigment cells, neurons, glia, bone and cartilage (LeDouarin 1999; Hall 2009). The molecular mechanisms underlying neural crest development are deeply conserved among vertebrates (Sauka-Spengler and Bronner-Fraser 2006; Baker 2008). Despite this conservation of key molecular pathways, divergence in the development of neural crest derivatives has been a major contributor to the evolution of the vertebrate clade (Gans and Northcutt 1983; Baker 2008), as well as to variation among vertebrate species (Schneider and Helms 2003; Albertson and Kocher 2006; Jeffery 2009).
The diversity of pigment patterns in closely related species provides a conspicuous example of neural crest evolution and permits dissection of the molecular mechanisms contributing to divergence in neural crest derivatives. Variation in vertebrate pigment patterns has been associated with differences in the development and function of neural crest derived pigment cells (Hoekstra 2006; Parichy 2006). In principle, alterations to several processes could yield variant pigment patterns across species (Kelsh 2004; Hoekstra 2006; Protas and Patel 2008). These processes fall under the two broad categories of developmental patterning (including cell proliferation, differentiation, migration, and death) and pigment synthesis and expression (Hoekstra 2006). Previous work has highlighted both of these mechanisms as playing a role in pigment pattern evolution across vertebrates (reviewed in Hoekstra 2006; Hubbard et al. 2010; Manceau et al. 2010).
Fish pigment patterns present an interesting opportunity to study the mechanisms of neural crest evolution. Unlike mammals, which have a single pigment cell type, fish have multiple neural crest derived pigment cell types, or chromatophores, which each express a different type of pigment (Kelsh et al. 2009). Black melanophores produce melanin, yellow xanthophores and red erythorophores manufacture pteridine pigments, and silvery iridophores contain guanine platelets that reflect light. Fish pigmentation can also be regulated by the aggregation or dispersal of pigment granules within chromatophores (Fujii 1993). Previous research in fish has shown that alterations of developmental mechanisms, including chromatophore differentiation, death and migration, underlie patterning differences in laboratory mutants (Kelsh et al. 1996; Parichy et al. 1999; Parichy, Mellgren et al. 2000; Parichy, Ransom et al. 2000; Iwashita et al. 2006; Watanabe et al. 2006; Budi et al. 2008) as well as differences between closely related species or populations (Parichy 2006; Miller et al. 2007; Roberts et al. 2009). Additionally, differences in pigment synthesis or melanosome biogenesis can play a role in generating altered pigment patterns in laboratory mutants (Koga et al. 1995; Kelsh et al. 1996; Fukamachi et al. 2001; Fukamachi et al. 2004; Page-McCaw et al. 2004; Lamason et al. 2005; Schonthaler et al. 2005; Navarro et al. 2008) and in the wild (Protas et al. 2006; Gross et al. 2009).
In this study, we sought to investigate the developmental and molecular processes that underlie divergence in pigment patterns between threespine stickleback fish (Gasterosteus aculeatus) from marine and freshwater populations. Juvenile marine sticklebacks possess a uniform distribution of melanophores and iridophores, whereas juvenile freshwater sticklebacks exhibit alternating dark and light bars (Greenwood et al. 2011). We used time course imaging to compare the development of these divergent pigment patterns and found that differences in both chromatophore addition and pigment amount and/or dispersal play a role in pigment pattern divergence. To gain insight into the molecular pathways that contribute to pattern differences, we used high-throughput sequencing of cDNA; i.e. RNA-seq (Mortazavi et al. 2008) and quantitative PCR (qPCR) to identify genes that are differentially expressed in tissue from freshwater and marine fish as well as in tissue from dark vs. light bars of freshwater fish. This approach revealed expression differences of genes in several known pigmentation pathways as well as genes that have not previously been implicated in pigment development.
MATERIALS AND METHODS
Time course imaging of pigment pattern development
Wild caught freshwater sticklebacks were collected from Hotel Lake, British Columbia, and anadromous marine sticklebacks were collected from the Little Campbell River, British Columbia, under a fish collection permit from the British Columbia Ministry of Environment (permit numbers NA/SU07-31839 and NA/SU08-42033). All fish were treated in accordance with the guidelines of the Institutional Animal Care and Use Committee at the Fred Hutchinson Cancer Research Center (protocol number 1575).
Wild-caught sticklebacks were used to establish crosses by in vitro fertilization in the laboratory for developmental studies. Individual fish (Hotel Lake n=30; Little Campbell Marine n=20) were isolated in 296 ml containers on the day of hatch. Fish were lightly anesthetized in 0.0125% MS-222 (Argent Chemical Laboratories, Redmond, WA, USA) and each fish was photographed once per day for 11 days, then every other day through 49 days post hatch (dph). Once each day, water was changed and fish were fed brine shrimp nauplii.
Photographs of fish were taken using a CoolPix 4500 camera (Nikon Inc., Melleville NY, USA) mounted on a stereomicroscope (Nikon SMZ1500, Nikon Inc., Melleville NY, USA). To track the appearance, migration and death of melanophores, we created image stacks of photos of individual fish across days. We selected five fish at random from each population and created image stacks from the day of hatching through 49 dph using the layers feature in Adobe Photoshop CS4 software (Adobe Systems, San Jose, CA, USA). Each image was individually resized as necessary to compensate for growth of the fish across days. For each selected fish, cropped image stacks were then used to generate a movie depicting an image series using iMovie software (Apple, Cupertino, CA, USA).
Quantification of pigment pattern development
The time course image series of five fish from each population were used to quantify the spatial pattern of melanophore and iridophore addition across the flank (Fig. 1). We sampled a region of the flank, centered on the midline, encompassing 14 segments wide and the equivalent of two segment-widths high. The anterior boundary of the sampled region was at the level of the second dorsal spine. Note that the images in Figure 1 depict a smaller region of the flank than what was actually quantified. Within the sampled region, we tracked the number and position of all individual melanophores that differentiated between 9 and 19 dph. Differentiation of melanophores was defined by the appearance of a new cell with obvious melanin pigment. To assess a role for melanophore cell death and migration, we also tracked the position and movement of melanophores that were extant on day 9.
Fig. 1.
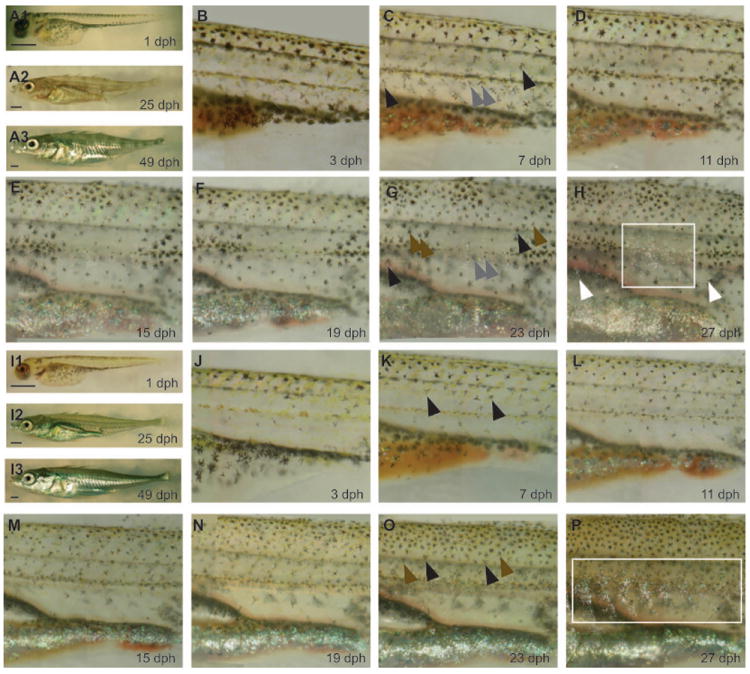
Development of pigment patterns in juvenile marine and freshwater sticklebacks. Photographs of pigment patterns at 1 dph, 25 dph and 49 dph in a freshwater fish (A1, A2, A3) and a marine fish (I1, I2, I3). Scale bar = 1 mm. Repeated imaging of pigment pattern development at 4 day intervals from 3-27 dph in a freshwater fish (B-H) and a marine fish (J-P). Images have been resized to compensate for growth of the fish across days, and not all quantified segments are shown (see Methods). Note that the position of this freshwater fish was slightly tilted dorsally in panel F, giving the appearance of a smaller flank. (C, G) Arrowheads indicate examples of melanophores that were added to dark bars during the imaging period (brown), and melanophores that were present throughout the imaging period, which either remain relatively large and pigmented in dark bars (black) or appear smaller and less pigmented in light bars (grey). (K,O) Arrowheads indicate melanophores present throughout (black) or newly added (brown) during the imaging period. (H, P) White boxes show regions that contain high densities of iridophores, which are concentrated in light bars of the freshwater fish but evenly distributed across the flank of marine fish; white arrowheads in H show scattered iridophores found in dark bars.
We also quantified the spatial distribution of iridophore addition. The cell borders of iridophores are not visibly defined, so we used individual reflective guanine platelets as a proxy for iridophore differentiation. There were no obvious iridophores on the flank on day 9. To obtain a measure of spatial variation in iridophore differentiation between day 9 and day 19, we only quantified the platelets present on day 19 and did not measure the number of iridophore platelets on each day. Visibility and appearance of iridophore platelets depends heavily on the angle of incident light, which could have varied across fish. However, our analysis was concerned with variability in iridophore number within an individual fish, and this was not obviously affected by light level.
Cross-correlation analysis in R Statistical Software (http://www.r-project.org/) was used to assess the relationship between the pattern of iridophore and melanophore addition per body segment for each of the five randomly selected fish from each population. We then compared the average cross correlation function for marine and freshwater fish in R using a nonparametric Kruskal-Wallis test.
Manipulation of pigment dispersal using yohimbine
We used the alpha-2 adrenergic antagonist, yohimbine, to cause pigment dispersal in the melanophores of lake fish (Iwashita et al. 2006). Before treatment, three Hotel Lake juveniles were anesthetized and photographed as above. These fish were then immersed in a solution of 10 μM yohimbine-HCl (Sigma, St. Louis, MO, USA) for 30 min, and then anesthetized and photographed again. To quantify differences in cell size and pigment level before and after treatment, we used ImageJ software (http://rsbweb.nih.gov/ij/). We measured the cross-sectional diameter of five randomly selected melanophores from light and dark bars. To assess differences in melanization, we also calculated the average grey value of dark and light bar melanophores following yohimbine treatment. Data are presented as mean ± S.E.M.
RNA-seq screen to identify molecular correlates of pigment pattern differences
Tissue from light bars and dark bars of lake fish was collected at 21 dph (average = 12.1 mm standard length), 35 dph (average = 14.8 mm), and 56 dph (average = 20.3 mm). To avoid cross-contamination, we removed tissue from either dark or light bars from an individual freshwater fish. Tissue was dissected from two to three bars per fish. We collected an equivalent portion of tissue from marine flanks at a single time point of 21 dph. The tissue samples contained skin as well as underlying muscle to act as a carrier, because the dissected skin was otherwise extremely small. For each time point and tissue sample, 5-18 fish were pooled for RNA extraction (Table S1). Total RNA was isolated using Trizol (Invitrogen, Carlsbad, CA, USA).
We used Illumina sequencing technology (Illumina, San Diego, CA, USA) to perform RNA-seq on five different samples: 21 dph light bar, 21 dph dark bar, 21 dph marine, 35/56 dph light bar, and 35/56 dph dark bar (Table S1). For all 21 dph samples, an equivalent amount of RNA was combined from two independent RNA preps. Each 21 dph sample was run on a separate lane in one sequencing run. In an independent sequencing run, we sequenced samples that were a mix of RNA preps collected at 35 and 56 dph. Specifically, for light or dark bars, we combined tissue from one 35 dph RNA prep and two 56 dph RNA preps in the following proportion: 25% of the 35 dph prep and 37.5% of each 56 dph prep (Table S1). Each 35/56 dph sample was run on a separate lane in one sequencing run.
We subjected all samples to library construction using the mRNA-Seq Sample Preparation Kit (Illumina, San Diego, CA, USA). This yielded Illumina-ready cDNA libraries with an average size of 300 bp. Libraries were quantified using a Bioanalyzer 2100 (Agilent Technologies, Santa Clara, CA, USA). Samples were run on a GenomeAnalyzer II (Illumina, San Diego, CA, USA) for 72 cycles, yielding reads of 80-100 bp. The number of reads passing manufacturer quality filtering criteria that were obtained for each sample were as follows: 21 dph dark (25,006,681); 21 dph light (10,061,211); 21 dph marine (24,982,956); 35/56 dph dark (10,275,927); 35/56 dph light (4,716,427).
Reads were aligned to the stickleback genome (Broad S1, Feb 2006) using default settings in the Burrows-Wheeler Aligner (BWA) software (Li and Durbin 2009). The percentage of reads aligning for each sample were as follows: 21 dph dark (56.5%); 21 dph light (58.4%); 21 dph marine (56.5%); 35/56 dph dark (38.7%); 35/56 dph light (33.9%). Gene annotations for Ensembl predicted genes were retrieved from Biomart (http://www.biomart.org). For each sample, the number of hits to each Ensembl predicted gene was normalized by the median predicted transcript length and overall number of reads per sample by calculating the reads per kilobase per million mapped reads (RPKM) (Mortazavi et al. 2008). We used a threshold of 2 RPKM as a minimum cutoff for inclusion of a gene in further analysis.
We calculated log-transformed fold-expression ratios for dark/light (at both 21 dph and 35/56 dph) or freshwater/marine (at 21 dph; freshwater = average of dark and light). We then calculated Z-scores to determine the significance of gene expression differences for all genes (Cheadle et al. 2003).
Quantitative PCR
Independent samples were isolated from new 21 dph marine and freshwater fish as described above. We generated five independent RNA preps for each of marine, freshwater dark bar and freshwater light bar tissue. Total RNA was treated with DNAse I (Invitrogen, Carlsbad, CA, USA) to remove genomic DNA contamination. Treated RNA was subjected to first strand cDNA synthesis using an oligo dT primer (Superscript III, Invitrogen, Carlsbad, CA, USA).
Primers were designed across intron/exon boundaries using Primer Express (Applied Biosystems, Carlsbad, CA, USA). Primer sequences are shown in Table S2. We used hypoxanthine phosphoribosyltransferase I (Hprt1) as a reference gene. This gene was previously shown to be a good reference gene across multiple tissues in sticklebacks (Hibbeler et al. 2008) and was expressed at similar levels in all RNA-seq samples in our experiment.
Quantitative PCR (qPCR) reactions were run on a 7900HT Real-Time PCR System (Applied Biosystems, Carlsbad, CA, USA) with the following cycling conditions: 50°C for 2 min, 95°C for 10 min, and 40 cycles of 95°C for 15 sec, 60°C for 1 min. Reactions included 1 μM of each primer, 2X SybrGreen PCR Master Mix (Applied Biosystems, Carlsbad, CA, USA), and 7.5 ng cDNA (RNA equivalent). Efficiency was calculated for each primer pair based on a standard curve made from serial dilutions of a standard sample, which was a combination of cDNA from all 15 samples (freshwater light bar, n = 5; freshwater dark bar, n = 5; marine, n = 5). The standard curve was composed of samples of 75, 37.5, 7.5, 3.75 and 0.75 ng cDNA (RNA equivalent). All samples (15 experimental and 6 standard curve) were run in triplicate. All reactions yielded a single product as determined by melt curve analysis. We also included no cDNA and no reverse transcriptase samples as negative controls.
We calculated the relative expression of each gene in each sample using an efficiency-based method (Pfaffl 2001). The efficiency of each primer pair was calculated from the standard curve using the formula: E = 10̂(1/slope). Relative expression for each sample was calculated with the equation: EHprt1^CTHprt1/Egene^CTgene × 100, where CT = cycle threshold. Resulting values are relative expression as a percentage of Hprt1 expression levels.
We used one-tailed Mann-Whitney tests in SPSS 13.0 Software (SPSS, Inc., Chicago, IL, USA) to compare gene expression levels in freshwater vs. marine or dark vs. light bar samples.
Whole mount in situ hybridization
A template for the candidate gene Pmel was amplified from cDNA using the following primers: forward primer 5’- GGC AAA GAC AAG TTC ATC CCT CT-3’ and reverse primer 5’- TGG GTC TGA AGT CGA TGT TGT TT-3’. The resulting 1571 bp product was subcloned into pCR4-TOPO vector (Invitrogen, Carlsbad, CA, USA). DIG-labeled sense and antisense RNA probes were generated using a Maxiscript Kit (Ambion, Austin, TX, USA) and DIG-labeling mix (Roche Diagnostics, Mannheim, Germany) and were hydrolyzed to approximately 600 bp before use. The sense probe showed no hybridization signal.
Hotel Lake fish were collected at 14 dph, fixed overnight in 4% formaldehyde, and stored in methanol at -20°C until use. Whole mount in situ hybridization was performed as previously described (Shapiro et al. 2004; Miller et al. 2007), except that hybridization was carried out at 65°C and signal was detected using BM purple (Roche Diagnostics, Mannheim, Germany).
RESULTS
Differences in pigment pattern development between marine and freshwater sticklebacks
Both marine and freshwater sticklebacks exhibit a similar pattern at hatching (Fig. 1A, I). This pattern consists of melanophores along the dorsal and ventral surface, with scattered melanophores present along the midline. Over the course of several days, melanophores and xanthophores appear across the flank, and both marine and freshwater fish show a relatively uniform distribution of these pigment cell types by approximately 7-9 dph (Fig. 1C, K). However, by approximately 15 dph, marine and freshwater patterns are obviously divergent (Fig. 1E, M), with freshwater fish exhibiting an alternating pattern of light and dark pigmented bars.
The pattern typical of freshwater fish could be generated through multiple developmental mechanisms (cell addition, migration or death) as well as differences in the amount or dispersal of pigment. To determine which processes are involved in creating this pattern, we repeatedly imaged pigment patterns during the development of individual freshwater and marine fish (Fig. 1, Movies S1, S2). On marine flanks, xanthophores, melanophores and iridophores continue to appear evenly throughout the imaging period (Fig. 1J-P, Movie S1). At around 11 dph, the pigment pattern of freshwater fish begins to diverge from that of marines (Fig. 1D, L). Within regions that eventually become dark bars, the melanophores present at 11 dph persist and retain dark pigmentation (Fig. 1D-H). Additionally, nascent melanophores appear within dark bars (Fig. 1D-H, Movie S2). By contrast, in regions that become light bars, extant melanophores gradually become smaller and pigment appears lighter. In addition, iridophores, but few new melanophores, appear within light bar regions (Fig. 1H, Movie S2).
To quantify the differential appearance of melanophores and iridophores across the flank of marine and freshwater fish, we recorded the position of new melanophores and new iridophore platelets that appeared between 9 and 19 dph and quantified the number that appeared per body segment (Fig. 2). This analysis revealed an inverse correlation between the appearance of iridophores and melanophores in body segments of freshwater fish. That is, regions that showed high numbers of differentiating melanophores showed correspondingly lower numbers of iridophore platelets. However, there was no such association in marine fish, where both iridophores and melanophores appeared evenly across the flank. This observation was quantified using a cross-correlation analysis of five individuals from each population, which showed that the pattern of iridophore and melanophore addition in freshwater fish is negatively correlated (R = -0.53 ± 0.075), whereas the pattern in marine fish is uncorrelated (R = -0.05 ± 0.11). The average cross-correlation coefficient (R) was significantly different across populations (Kruskal-Wallis chi-squared = 5.8, P < 0.016).
Fig. 2.
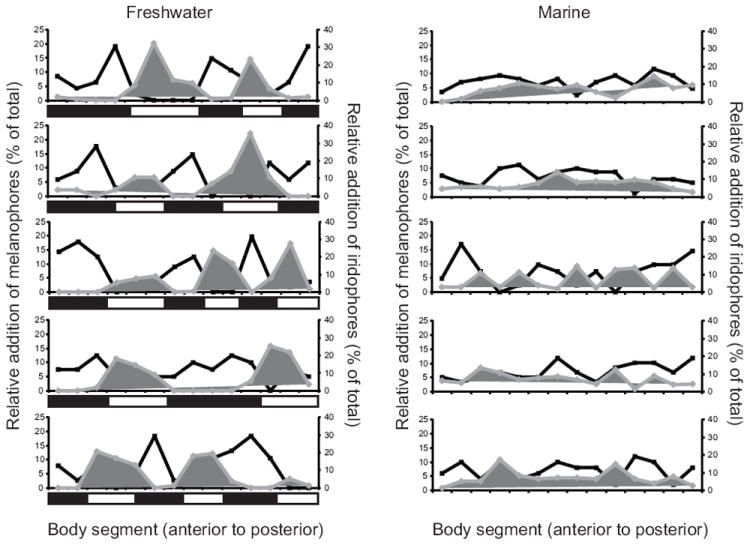
Patterning of melanophore and iridophore addition in marine and freshwater sticklebacks. The percentage of the total melanophores (black lines) or iridophore platelets (gray lines) that appeared between 9 and 19 dph are shown as a function of the body segment in which they appeared. Each graph represents a different fish. Freshwater fish are shown on the left and marine fish on the right. The rectangles below each freshwater graph depict the location of dark vs. light bars; the position and size of dark and light bars is variable across fish.
We saw little evidence of a role for cell death in shaping the barred pigment pattern. Across five freshwater fish, only four out of 502 melanophores that were present on day 9 within the sampled region disappeared over the course of 10 days of development. Furthermore, these melanophores were found in both light and dark bars. Because we visualized pigment development at 48-hour intervals, we cannot rule out the possibility that melanophores could have differentiated and subsequently disappeared within this interval. However, we can rule out the possibility that the selective disappearance of melanophores within light bars plays a role in the generation of the barred pattern.
The extent of migration of individual melanophores was not substantial: melanophores were typically located within 1-2 cell bodies of their original location relative to other cells. Because we found minimal evidence for migration of differentiated cells, we did not quantitatively assess the extent of migration during development.
The melanophores within light bars typically appear smaller and more punctate than those in dark bar regions, which could be attributed to differences in the amount and/or dispersal of melanin within individual cells, or to differences in relative cell size. To address this question, we bathed skin from freshwater fish in the alpha-2 adrenergic antagonist yohimbine, which causes pigment dispersal within melanophores. Before treatment, many light bar melanophores appear as punctate spots, but following yohimbine treatment these cells exhibit a similar stellate shape to cells in dark bars, showing that their pigment has been dispersed (Fig. 3). Before pigment dispersal, dark bar melanophores appear twice as large as those in light bars (relative diameter of melanophores in dark/light bars = 2 ± 0.09), but they are a similar size following yohimbine treatment (relative diameter of melanophores in dark/light bars = 1.01 ± 0.01), suggesting that apparent size differences are due to differences in pigment dispersal across melanophores from dark and light bars. In addition, the amount of melanin per cell following pigment dispersal appears substantially less in melanophores from light bars than in cells from dark bars (Fig. 3). Quantification of the extent of melanization in yohimbine treated fish shows that melanophores in dark bars are 1.35 ± 0.05 fold darker than those in light bars. Thus, both the amount of melanin and the extent of pigment dispersal (but not cell size) differ in melanophores from dark and light bars.
Fig. 3.
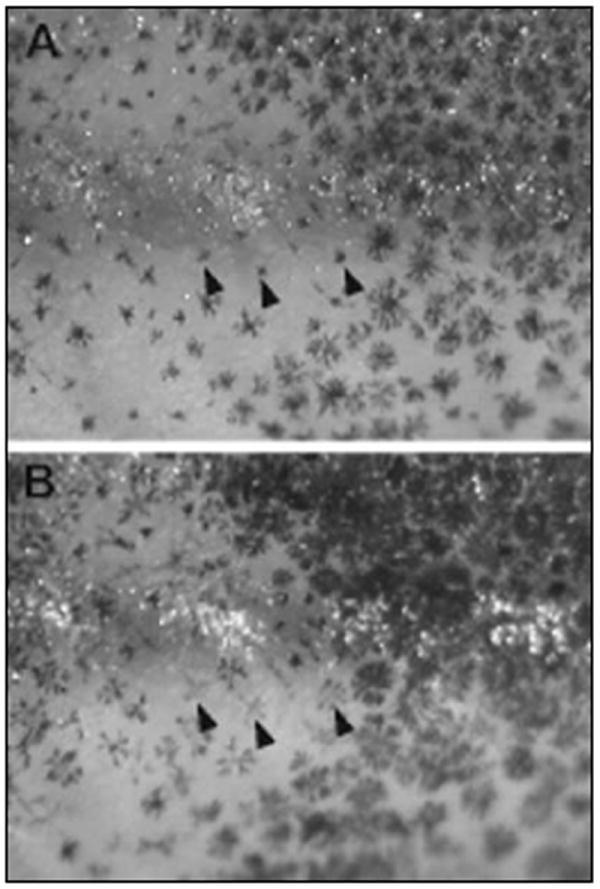
Effect of yohimbine on melanophore pigment dispersal in freshwater sticklebacks. Photograph of the flank of a freshwater fish before (A) and after (B) immersion in yohimbine to induce pigment dispersal. Arrowheads point to the same three melanophores in both panels. Melanophore size is similar across dark and light bars following pigment dispersal, but the level of pigment is lower in melanophores from light bars (see Results for details).
Transcriptional profiling identifies candidate genes associated with pigment pattern differences between marine and freshwater sticklebacks
We used RNA-seq to identify genes that were differentially expressed between dark and light bars of freshwater fish, as well as between freshwater and marine fish. We designed our RNA-seq experiment as a screen to identify genes of interest and did not include biological replicates for sequencing. Therefore, although we present raw RNA-seq data, we only make inferences about expression patterns that we have validated by qPCR.
We first used the RNA-seq data to examine differential gene expression across all annotated genes in the Ensembl stickleback genome assembly. We examined expression of genes in light and dark bar samples from both 21 dph and 35/56 dph and identified genes that were consistently higher in light or dark bars across developmental ages at a level of P < 0.05. Across datasets, we found that 31 genes were consistently expressed more highly in dark bars, and 42 were expressed more highly in light bars (Table S3). We chose six genes from this list and validated the expression differences in freshwater dark vs. light bars using qPCR for all six selected genes (see below). We also examined differential expression in marine vs. freshwater tissue. As this represents a sample size of N = 1, we do not present the raw list of differentially expressed genes; however, we do present data for selected genes that we validated by qPCR. Finally, we specifically evaluated the expression of genes within our dataset known to be involved in pigment pattern development or pigment synthesis in zebrafish and found that a subset of these genes were differentially expressed across tissue types (Table 1).
Table 1.
RNA-seq results for selected pigment candidate genes
| Gene | Location | Ensembl ID | Normalized Number of Reads (RPKM) | Fold Difference | ||||||
|---|---|---|---|---|---|---|---|---|---|---|
| 21 dph | 35,56 dph | 21 dph | 35,56 dph | |||||||
| Dark | Light | Marine | Dark | Light | Dark/Light | Fresh/Marine | Dark/Light | |||
| Csf1r | ChrIV | ENSGACG00000018007 | 2.0 | 1.8 | 4.2 | 1.2 | 2.3 | 1.1 | -2.2 | -2.0* |
| Csf1r | ChrVII | ENSGACG00000020913 | 7.5 | 7.2 | 3.6 | 9.0 | 9.1 | 1.0 | 2.1 | -1.0 |
| Dct | ChrXVI | ENSGACG00000004101 | 3.0 | 0.5 | 2.3 | 1.0 | 0.7 | 5.4* | -1.0 | 1.5 |
| Ednrb1 | ChrIII | ENSGACG00000012901 | 15.2 | 18.0 | 46.7 | 18.6 | 19.5 | -1.2 | -2.9† | -1.0 |
| Ednrb1 | ChrXVI | ENSGACG00000004048 | 0.0 | 0.1 | 0.2 | 0.0 | 1.1 | |||
| Erbb3 | ChrUn | ENSGACG00000000747 | 20.0 | 19.5 | 3.2 | 23.1 | 16.5 | 1.0 | 6.1* | 1.4 |
| Erbb3 | ChrXII | ENSGACG00000009144 | 1.3 | 1.4 | 2.9 | 2.9 | 2.1 | -1.0 | -2.2 | 1.4 |
| Foxd3 | ChrVIII | ENSGACG00000006933 | 8.9 | 10.5 | 11.7 | 13.9 | 11.9 | -1.2 | -1.2 | 1.2 |
| Gja5 | ChrVI | ENSGACG00000011699 | 0.2 | 1.9 | 0.6 | 0.6 | 1.9 | |||
| Kcnj13 | ChrUn | ENSGACG00000000413 | 0.1 | 0.0 | 0.1 | 0.1 | 0.4 | |||
| Kit | ChrVIII | ENSGACG00000014273 | 2.3 | 3.4 | 1.9 | 3.8 | 4.3 | -1.5 | 1.4 | -1.1 |
| Kit | ChrIX | ENSGACG00000015944 | 2.7 | 3.3 | 2.0 | 5.7 | 4.6 | -1.2 | 1.4 | 1.3 |
| Kitl | ChrXIX | ENSGACG00000009373 | 2.5 | 4.5 | 1.6 | 5.3 | 3.4 | -1.8† | 1.9 | 1.5 |
| Ltk | ChrXV | ENSGACG00000008800 | 2.4 | 2.8 | 7.5 | 4.6 | 4.6 | -1.1 | -3.0† | -1.0 |
| Mitf | ChrXVII | ENSGACG00000011875 | 1.2 | 0.4 | 1.5 | 1.5 | 0.6 | |||
| Mitf | ChrXII | ENSGACG00000003425 | 1.2 | 1.2 | 2.3 | 1.3 | 0.9 | 1.0 | -1.9 | 1.5 |
| Pmel | ChrUn | ENSGACG00000000544 | 39.1 | 11.0 | 63.3 | 19.8 | 13.4 | 3.5* | -2.0 | 1.5 |
| Pmel | ChrXII | ENSGACG00000011605 | 0.1 | 0.1 | 0.1 | 0.3 | 0.1 | |||
| Slc24a5 | ChrII | ENSGACG00000016752 | 2.4 | 1.1 | 3.4 | 2.6 | 0.7 | 2.1* | -1.7 | 3.8* |
| Sox10 | ChrXI | ENSGACG00000007318 | 3.8 | 4.3 | 6.4 | 4.4 | 3.6 | -1.1 | -1.6 | 1.2 |
| Sox10 | ChrIX | ENSGACG00000016017 | 3.3 | 6.4 | 5.6 | 5.6 | 6.6 | -1.9† | -1.3 | -1.2 |
| Tyr | ChrI | ENSGACG00000007960 | 2.5 | 1.5 | 4.9 | 4.0 | 3.5 | 1.7† | -2.2 | 1.1 |
| Tyr | ChrVII | ENSGACG00000020587 | 0.9 | 0.4 | 1.8 | 1.2 | 0.7 | |||
| Tyrp1 | ChrIX | ENSGACG00000015912 | 5.3 | 2.2 | 9.0 | 15.3 | 11.5 | 2.4* | -2.0 | 1.3 |
| Tyrp1 | ChrVII | ENSGACG00000019503 | 24.2 | 9.2 | 39.4 | 18.1 | 15.4 | 2.6* | -2.0 | 1.2 |
Significance was determined by applying Z-scores to log-transformed fold-difference values.
P < 0.05;
P < 0.005.
For genes with two paralogs in stickleback, we have not assigned the orthologous gene in zebrafish as this requires either phylogenetic or functional data.
qPCR and in situ hybridization validation of RNA-seq results
We used qPCR to validate expression differences identified by RNA-seq between freshwater and marine fish at 21 dph (Fig. 4). Three genes were selected from the whole genome comparison (adrenergic receptor alpha 2a (Adra2a); cadherin-11 (Cdh11); and endothelin converting enzyme like 1 (Ecel1)), and three genes were selected from the list of a priori pigment candidate genes (endothelin receptor b1 (Ednrb1); v-erb-b2 erythroblastic leukemia viral oncogene homolog 3 (Erbb3); and leukocyte tyrosine kinase (Ltk)). By qPCR, all six genes showed significant differences that were consistent with the RNA-seq results (Fig. 4). Four genes were expressed more highly in marine tissue: Cdh11 (P < 0.01), Ecel1 (P < 0.05), Ednrb1 (P < 0.001), and Ltk (P < 0.05), while two genes were more highly expressed in freshwater tissue: Adra2a (P < 0.03) and Erbb3 (P < 0.03).
Fig. 4.
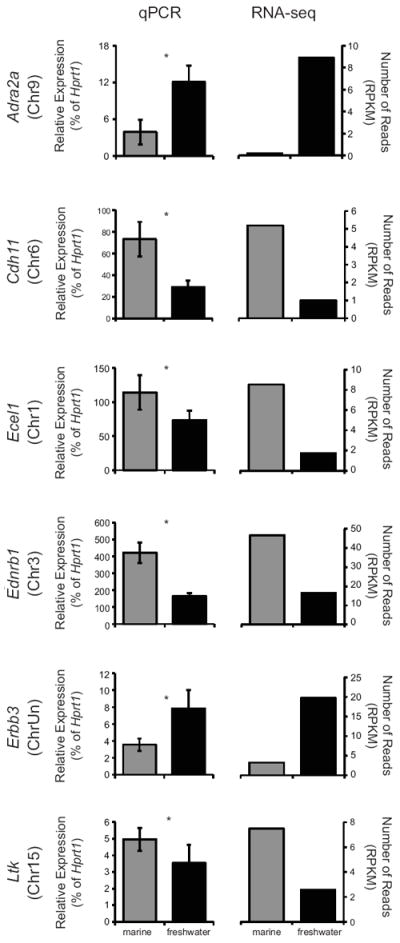
Differential expression of selected genes in tissue from freshwater vs. marine tissue. qPCR and RNA-seq data are shown for six genes, arranged alphabetically. Marine expression levels are shown in gray bars and freshwater in black. For qPCR, sample size is N = 10 for freshwater and N = 5 for marine; error bars represent the standard error. An asterisk indicates significance at P < 0.05. For RNA-seq, sample size is N = 1 for both samples. RPKM= reads per kilobase per million mapped reads.
We also compared expression levels across tissue from dark and light bars of freshwater fish at 21 dph using qPCR on six genes that were differentially expressed at both ages (21 dph and 35/56 dph) in the dark vs. light bar whole-genome comparison (Table S3; Fig. 5): a disintegrin and metalloproteinase with thrombospondin motifs 1 (ADAMTS1); endothelin receptor b2 (Ednrb2); fibroblast growth factor 6 (Fgf6); gap junction protein, alpha 1 (Gja1); semaphorin 3a (Sema3a), and neuropilin 2 (Nrp2). Consistent with the RNA-seq data, all of these genes were expressed at significantly higher levels in tissue from light bars by qPCR: ADAMTS1 (P < 0.01), Ednrb2 (P < 0.01); Fgf6 (P < 0.05), Gja1 (P < 0.02), Sema3a (P < 0.01), Nrp2 (P < 0.05) (Fig. 5 and data not shown).
Fig. 5.
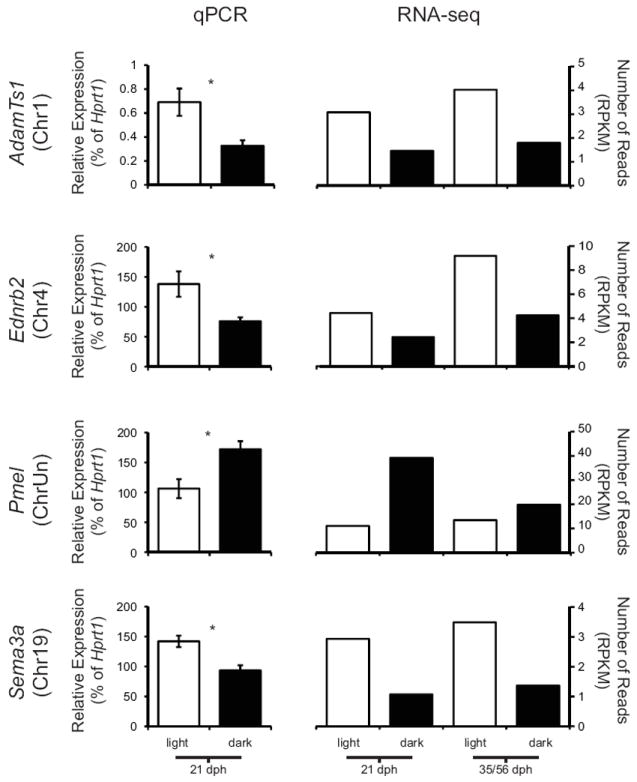
Differential expression of selected genes in tissue from dark vs. light bars of freshwater fish. qPCR and RNA-seq data are shown for four genes, arranged alphabetically. Light bar expression levels are shown in white bars and dark bar levels in black. For qPCR, sample size is N = 5; error bars represent the standard error. An asterisk indicates significant differences at P < 0.05. For RNA-seq, data from both 21 dph and 35/56 dph samples are shown; sample size is N = 1. RPKM= reads per kilobase per million mapped reads.
We also verified the expression differences between light and dark bars in one gene selected from the candidate gene list (Table 1): premelanosome protein (Pmel, also called Pmel17 or Silver). Pmel was expressed at significantly higher levels in tissue from dark bars (Fig. 5). We used whole mount in situ hybridization to further examine the expression pattern of Pmel (Fig. 6). Similar to the RNA-seq and qPCR results, Pmel was expressed at higher levels in dark bars than in light bars. This gene was expressed in both pigmented melanophores as well as unpigmented cells (likely undifferentiated melanophores) within dark bars, but little expression was seen in melanophores within light bars (Fig. 6).
Fig. 6.
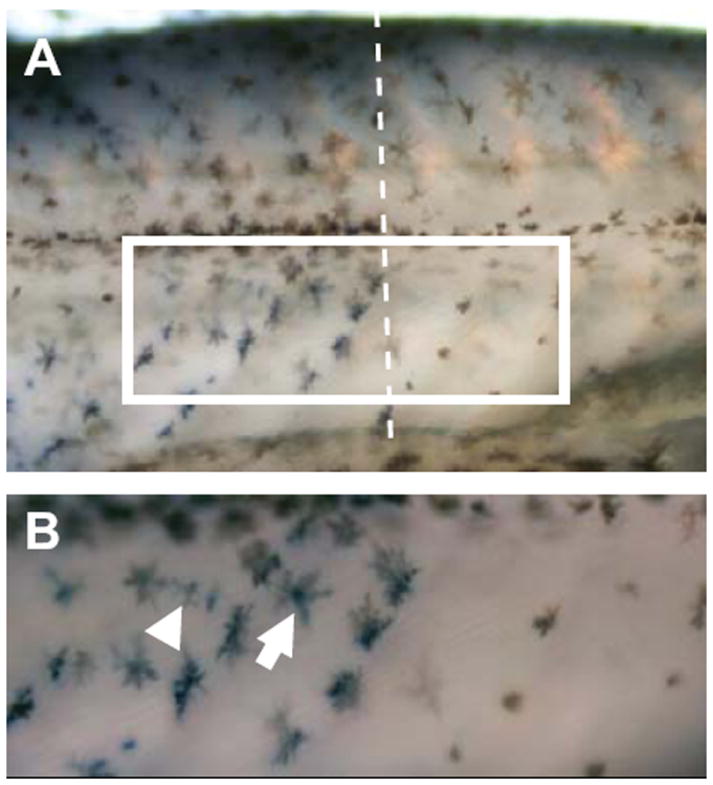
Whole mount in situ hybridization of Pmel in freshwater sticklebacks. Expression of Pmel on the flank of a freshwater stickleback is visualized as blue staining, while pigmented melanophores appear brown. (A) Pmel expression is higher in dark bars (left side of dashed line) than in light bars (right side of dashed line). (B) Enlarged view of the boxed region in (A) showing that Pmel is expressed in pigmented melanophores (arrow) as well as within unpigmented cells that are likely to be undifferentiated melanophores (arrowhead).
Pmel, Ednrb1, and Erbb3 have two paralogous copies that were annotated in Ensembl (Table 1). Interestingly, for two of these genes, Ednrb1 and Pmel, RNA-seq revealed that the expression levels of one of the two paralogs across all samples were extremely low or absent. This suggests that these paralogs are not actually expressed in stickleback flanks, though this has not yet been confirmed using qPCR.
DISCUSSION
Development of divergent pigment patterns in sticklebacks
Our comparative time course analysis of pigment pattern development in sticklebacks revealed that freshwater and marine populations have similar pigment patterns at embryonic through larval stages and that differences between the populations emerge during a larval-to-adult transition, or metamorphosis. Similar to our findings in sticklebacks, regulation of pigment cell addition during metamorphosis is important for differences in pigment pattern development among Danio species (McClure 1999; Quigley et al. 2004; Parichy 2006; Mills et al. 2007).
We found that three processes sculpt the pigment patterns of freshwater sticklebacks: cell addition, pigment amount, and pigment dispersal. In contrast, migration and cell death do not appear to play a prominent role in development of the barred pattern. Instead, pre-metamorphic melanophores in light bars are retained, but subsequently appear lighter due to less pigment and retraction of this pigment. This process is different from the formation of horizontal stripes in zebrafish, where pre-metamorphic melanophores in light stripe regions either die or migrate to dark stripe regions (Parichy 2006). Differential cell death and migration also contribute to divergent pigment patterns across Danio species (Parichy 2006).
The finding that differences in both melanophore addition and pigment amount underlie pattern differences of freshwater and marine sticklebacks corroborates our recent genetic mapping study (Greenwood et al. 2011). This study revealed that two pigment pattern features, the number of melanophores and degree of melanization, were genetically separable and mapped to different regions of the genome (Greenwood et al. 2011). Taken together, our results indicate that both developmental patterning and spatial variation in pigment expression (i.e. amount and dispersal) are important in generating differences in pigment patterns across stickleback populations.
Our developmental analysis revealed spatial variation in the production of melanophores vs. iridophores across the flanks of freshwater fish. In particular, regions that showed evidence of higher melanophore differentiation showed correspondingly lower iridophore differentiation, reflecting an apparent tradeoff in the production of melanophores vs. iridophores across different regions of the flank. Work in zebrafish has suggested that chromatophore precursors are distributed throughout the flank during embryogenesis and that these “latent precursor” cells differentiate during post-embryonic development to produce chromatophores that form the adult pattern (Budi et al. 2008). Our data support one of two possible mechanisms for the generation of spatially restricted chromatophores. One possibility is that fate-restricted latent precursors might be spatially segregated across the flank in freshwater fish, but interspersed across the flanks of marine fish. Alternatively, spatially restricted differentiation cues may produce distinct fates from a single precursor cell type; recent work in zebrafish has identified a bipotent precursor that generates either melanophores or iridophores (Curran et al. 2010). Future work will reveal the relative contributions of these mechanisms to chromatophore patterning in sticklebacks.
Molecular correlates of divergent pigment patterns
Using the logic that potential spatially regulated environmental signals or different gene expression profiles within dedicated precursors might be detectable as differences in gene expression during the course of pattern development, we used RNA-seq as a screen to identify genes that were differentially expressed in dark vs. light bars of freshwater fish during development. Although spatial distribution of gene expression in freshwater fish might highlight genes important for this process, population-specific differences could also be caused by differential expression of genes across the entire flank. Thus, we additionally examined expression differences in marine vs. freshwater tissue, without regard for whether tissue came from dark vs. light bars. Although we present some of the raw RNA-seq data in this paper (Tables 1, S3), it should be emphasized that these datasets are not based on multiple independent biological replicates. We therefore restrict our discussion to the subset of genes for which we verified differential expression using qPCR on replicate samples. Furthermore, marine and freshwater fish have numerous morphological differences in addition to variant pigment patterns (Bell and Foster 1994), and it is possible that some of the gene expression differences we detected may reflect non-pigment traits.
We found several differences in gene expression in the flanks of marine and freshwater fish that may influence either pigment cell development or pigment dispersal within chromatophores. First, Ltk was expressed at higher levels in flank tissue from marine fish. Ltk is a receptor tyrosine kinase that mediates iridophore development in zebrafish and was shown to be expressed within both unspecified and differentiated iridophores (Lopes et al. 2008). As marine sticklebacks have significantly more iridophores than freshwater fish (Greenwood et al. 2011), increased Ltk expression in marines may reflect higher numbers of developing or differentiated iridophores. The epidermal growth factor receptor-like tyrosine kinase Erbb3 was also expressed at higher levels in tissue from marine flanks. Erbb3 was previously implicated in melanophore development in zebrafish (Budi et al. 2008). Finally, we found that two members of the endothelin pathway, Ednrb1 and Ecel1 were expressed at higher levels in marine fish, and that another endothelin receptor, Ednrb2, was differentially expressed in dark vs. light bars from freshwater fish. The endothelin pathway has been implicated in pigment cell development in mammals, birds, and fish (Parichy, Mellgren et al. 2000; Pla et al. 2005; Miwa et al. 2007; Harris et al. 2008; Kelsh et al. 2009).
In addition to identifying genes known to be involved in pigment cell development, our screen also identified genes not previously implicated in this process. For example, we found that Cdh11 was more highly expressed in marine tissue. Although not known to play a specific role in pigment cell development, Cdh11 is important for early neural crest cell migration in Xenopus (Vallin et al. 1998; Borchers et al. 2001; Taneyhill 2008). Interestingly, Cdh11 is located in a genomic region that was linked to variation in melanophore number across the flank in our previous genetic mapping study (Greenwood et al. 2011). The expression difference we found between marine and freshwater sticklebacks in the current study are consistent with a potential role for Cdh11 in coordinating differences in patterning between freshwater and marine fish. It will be interesting to pursue this relationship in future studies.
Finally, our comparison of genes differentially expressed between marine and freshwater tissue identified a gene potentially involved in regulation of pigment dispersal, rather than pigment cell development. Specifically, Adra2a was more abundant in freshwater tissue compared with marine tissue, and adrenergic type 2 receptors regulate pigment dispersal within fish melanophores (Fujii 1993; Aspengren et al. 2009).
In the comparison of genes that were differentially expressed between tissue from light and dark bars of freshwater fish, we identified genes that function in both neural crest development and melanosome biogenesis. ADAMTS1, a secreted protease, was more abundant in tissue from light bars of freshwater fish. It is not yet clear that ADAMTS1 plays a role in chromatophore development; however, another gene from this family (ADAMTS20) was implicated in the belted mutation in mice (Rao et al. 2003) and was further shown to affect melanocyte survival via modulation of Kit signaling (Silver et al. 2008). Sema3a was also expressed more highly in light bar tissue. In Xenopus and chick, Sema3a is expressed along the neural crest migratory route (Eickholt et al. 1999; Koestner et al. 2008), and, in chick, Sema3a influences neural crest cell migration in vitro (Eickholt et al. 1999). Neuropilin genes are known to be receptors for semaphorins (Tamagnone and Comoglio 2000), and Nrp2 was also expressed at higher levels in the light bars. These data suggest that this signaling pathway might play an important and unexpected role in the development of pigment patterns in sticklebacks.
A gene involved in melanosome biogenesis, Pmel, was expressed at higher levels in tissue from dark bars compared with light bars. Disruption of Pmel has been linked to numerous pigment mutants in mammals, birds, and fish (Schonthaler et al. 2005; Theos et al. 2005). We used in situ hybridization to show that Pmel is expressed in pigmented melanophores as well as unpigmented cells, which are likely differentiating melanophores at an early stage of melanin synthesis. Thus, the higher expression of Pmel in dark bars detected by RNA-seq and qPCR in part reflects the higher number of melanophores in these regions. In addition, in situ hybridization revealed that Pmel expression within individual melanophores from dark vs. light bars also appears to differ, suggesting that Pmel might play a role in regulating the differential amount and/or dispersal of pigment observed in light and dark bars.
In summary, we described pigment pattern development in two populations of sticklebacks and characterized the processes that are important for sculpting divergent pigment patterns. In contrast to studies in zebrafish, our results show that cell death and migration do not play an important role in the development of the pigment patterns studied here in sticklebacks. Rather, differences in both the spatial distribution of chromatophore differentiation and the amount and dispersal of pigment within melanophores create the pattern of vertical bars in freshwater sticklebacks. In addition, we identified several molecular pathways, including some not previously implicated in pigmentation, which will be interesting targets of future research. This work highlights sticklebacks as a promising system in which to investigate the developmental and molecular mechanisms that underlie the evolution of the diverse pigment patterns found across vertebrates.
Supplementary Material
Acknowledgments
We thank Shaun McCann for assistance with fish husbandry, James Urton for advice on RNA-seq methods, Matt Arnegard for useful discussions, and Margaret Mills for discussions and comments on the manuscript. Dave Parichy provided helpful advice on the time course imaging study. We thank Andy Marty, Jeff Delrow, and Ryan Basom in FHCRC Genomics for assistance with Illumina sequencing, and Martin Morgan and Jerry Davison from the FHCRC Computational Biology Shared Resource for help with sequence alignment and analysis. We also thank Semiahmoo First Nations for permission to collect sticklebacks from the Little Campbell River. The Broad Institute Sequencing and Assembly teams provided stickleback genome sequence information before publication. This work was supported by a Helen Hay Whitney Foundation Postdoctoral Fellowship (AKG) and a National Institutes of Health Center of Excellence in Genomic Science Grant HG002568 (CLP).
References
- Albertson RC, Kocher TD. Genetic and developmental basis of cichlid trophic diversity. Heredity. 2006;97:211–21. doi: 10.1038/sj.hdy.6800864. [DOI] [PubMed] [Google Scholar]
- Aspengren S, Hedberg D, Skold HN, Wallin M. New insights into melanosome transport in vertebrate pigment cells. Int Rev Cell Mol Biol. 2009;272:245–302. doi: 10.1016/S1937-6448(08)01606-7. [DOI] [PubMed] [Google Scholar]
- Baker CV. The evolution and elaboration of vertebrate neural crest cells. Curr Opin Genet Dev. 2008;18:536–43. doi: 10.1016/j.gde.2008.11.006. [DOI] [PubMed] [Google Scholar]
- Bell MA, Foster SA. The Evolutionary Biology of the Threespine Stickleback. Oxford: Oxford University Press; 1994. [Google Scholar]
- Borchers A, David R, Wedlich D. Xenopus cadherin-11 restrains cranial neural crest migration and influences neural crest specification. Development. 2001;128:3049–60. doi: 10.1242/dev.128.16.3049. [DOI] [PubMed] [Google Scholar]
- Budi EH, Patterson LB, Parichy DM. Embryonic requirements for ErbB signaling in neural crest development and adult pigment pattern formation. Development. 2008;135:2603–14. doi: 10.1242/dev.019299. [DOI] [PMC free article] [PubMed] [Google Scholar]
- Cheadle C, Vawter MP, Freed WJ, Becker KG. Analysis of microarray data using Z score transformation. J Mol Diagn. 2003;5:73–81. doi: 10.1016/S1525-1578(10)60455-2. [DOI] [PMC free article] [PubMed] [Google Scholar]
- Curran K, Lister JA, Kunkel GR, Prendergast A, Parichy DM, Raible DW. Interplay between Foxd3 and Mitf regulates cell fate plasticity in the zebrafish neural crest. Dev Biol. 2010;344:107–18. doi: 10.1016/j.ydbio.2010.04.023. [DOI] [PMC free article] [PubMed] [Google Scholar]
- Eickholt BJ, Mackenzie SL, Graham A, Walsh FS, Doherty P. Evidence for collapsin-1 functioning in the control of neural crest migration in both trunk and hindbrain regions. Development. 1999;126:2181–9. doi: 10.1242/dev.126.10.2181. [DOI] [PubMed] [Google Scholar]
- Fujii R. Coloration and chromatophores. In: Evans DH, editor. The Physiology of Fishes. Boca Raton, FL: CRC Press; 1993. [Google Scholar]
- Fukamachi S, Asakawa S, Wakamatsu Y, Shimizu N, Mitani H, Shima A. Conserved function of medaka pink-eyed dilution in melanin synthesis and its divergent transcriptional regulation in gonads among vertebrates. Genetics. 2004;168:1519–27. doi: 10.1534/genetics.104.030494. [DOI] [PMC free article] [PubMed] [Google Scholar]
- Fukamachi S, Shimada A, Shima A. Mutations in the gene encoding B, a novel transporter protein, reduce melanin content in medaka. Nat Genet. 2001;28:381–5. doi: 10.1038/ng584. [DOI] [PubMed] [Google Scholar]
- Gans C, Northcutt RG. Neural crest and the origin of vertebrates: a new head. Science. 1983;220:268–73. doi: 10.1126/science.220.4594.268. [DOI] [PubMed] [Google Scholar]
- Greenwood AK, et al. The genetic basis of divergent pigment patterns in juvenile threespine sticklebacks. Heredity. 2011;107:155–166. doi: 10.1038/hdy.2011.1. [DOI] [PMC free article] [PubMed] [Google Scholar]
- Gross JB, Borowsky R, Tabin CJ. A novel role for Mc1r in the parallel evolution of depigmentation in independent populations of the cavefish Astyanax mexicanus. PLoS Genet. 2009;5:e1000326. doi: 10.1371/journal.pgen.1000326. [DOI] [PMC free article] [PubMed] [Google Scholar]
- Hall BK. The Neural Crest and Neural Crest Cells in Vertebrate Development and Evolution. New York: Springer; 2009. [Google Scholar]
- Harris ML, Hall R, Erickson CA. Directing pathfinding along the dorsolateral path - the role of EDNRB2 and EphB2 in overcoming inhibition. Development. 2008;135:4113–22. doi: 10.1242/dev.023119. [DOI] [PubMed] [Google Scholar]
- Hibbeler S, Scharsack JP, Becker S. Housekeeping genes for quantitative expression studies in the three-spined stickleback Gasterosteus aculeatus. BMC Mol Biol. 2008;9:18. doi: 10.1186/1471-2199-9-18. [DOI] [PMC free article] [PubMed] [Google Scholar]
- Hoekstra HE. Genetics, development and evolution of adaptive pigmentation in vertebrates. Heredity. 2006;97:222–34. doi: 10.1038/sj.hdy.6800861. [DOI] [PubMed] [Google Scholar]
- Hubbard JK, Uy JA, Hauber ME, Hoekstra HE, Safran RJ. Vertebrate pigmentation: from underlying genes to adaptive function. Trends Genet. 2010;26:231–9. doi: 10.1016/j.tig.2010.02.002. [DOI] [PubMed] [Google Scholar]
- Iwashita M, et al. Pigment pattern in jaguar/obelix zebrafish is caused by a Kir7.1 mutation: implications for the regulation of melanosome movement. PLoS Genet. 2006;2:e197. doi: 10.1371/journal.pgen.0020197. [DOI] [PMC free article] [PubMed] [Google Scholar]
- Jeffery WR. Chapter 8. Evolution and development in the cavefish Astyanax. Curr Top Dev Biol. 2009;86:191–221. doi: 10.1016/S0070-2153(09)01008-4. [DOI] [PMC free article] [PubMed] [Google Scholar]
- Kelsh RN. Genetics and evolution of pigment patterns in fish. Pigment Cell Res. 2004;17:326–36. doi: 10.1111/j.1600-0749.2004.00174.x. [DOI] [PubMed] [Google Scholar]
- Kelsh RN, et al. Zebrafish pigmentation mutations and the processes of neural crest development. Development. 1996;123:369–89. doi: 10.1242/dev.123.1.369. [DOI] [PubMed] [Google Scholar]
- Kelsh RN, Harris ML, Colanesi S, Erickson CA. Stripes and belly-spots -- a review of pigment cell morphogenesis in vertebrates. Semin Cell Dev Biol. 2009;20:90–104. doi: 10.1016/j.semcdb.2008.10.001. [DOI] [PMC free article] [PubMed] [Google Scholar]
- Koestner U, Shnitsar I, Linnemannstons K, Hufton AL, Borchers A. Semaphorin and neuropilin expression during early morphogenesis of Xenopus laevis. Dev Dyn. 2008;237:3853–63. doi: 10.1002/dvdy.21785. [DOI] [PubMed] [Google Scholar]
- Koga A, Inagaki H, Bessho Y, Hori H. Insertion of a novel transposable element in the tyrosinase gene is responsible for an albino mutation in the medaka fish, Oryzias latipes. Mol Gen Genet. 1995;249:400–5. doi: 10.1007/BF00287101. [DOI] [PubMed] [Google Scholar]
- Lamason RL, et al. SLC24A5, a putative cation exchanger, affects pigmentation in zebrafish and humans. Science. 2005;310:1782–6. doi: 10.1126/science.1116238. [DOI] [PubMed] [Google Scholar]
- LeDouarin NM. The Neural Crest. Cambridge: Cambridge University Press; 1999. [Google Scholar]
- Li H, Durbin R. Fast and accurate short read alignment with Burrows-Wheeler transform. Bioinformatics. 2009;25:1754–60. doi: 10.1093/bioinformatics/btp324. [DOI] [PMC free article] [PubMed] [Google Scholar]
- Lopes SS, et al. Leukocyte tyrosine kinase functions in pigment cell development. PLoS Genet. 2008;4:e1000026. doi: 10.1371/journal.pgen.1000026. [DOI] [PMC free article] [PubMed] [Google Scholar]
- Manceau M, Domingues VS, Linnen CR, Rosenblum EB, Hoekstra HE. Convergence in pigmentation at multiple levels: mutations, genes and function. Philos Trans R Soc Lond B Biol Sci. 2010;365:2439–50. doi: 10.1098/rstb.2010.0104. [DOI] [PMC free article] [PubMed] [Google Scholar]
- McClure M. Development and evolution of melanophore patterns in fishes of the genus Danio (Teleostei: Cyprinidae) J Morphol. 1999;241:83–105. doi: 10.1002/(SICI)1097-4687(199907)241:1<83::AID-JMOR5>3.0.CO;2-H. [DOI] [PubMed] [Google Scholar]
- Miller CT, et al. cis-Regulatory changes in Kit ligand expression and parallel evolution of pigmentation in sticklebacks and humans. Cell. 2007;131:1179–89. doi: 10.1016/j.cell.2007.10.055. [DOI] [PMC free article] [PubMed] [Google Scholar]
- Mills MG, Nuckels RJ, Parichy DM. Deconstructing evolution of adult phenotypes: genetic analyses of kit reveal homology and evolutionary novelty during adult pigment pattern development of Danio fishes. Development. 2007;134:1081–90. doi: 10.1242/dev.02799. [DOI] [PubMed] [Google Scholar]
- Miwa M, et al. Endothelin receptor B2 (EDNRB2) is associated with the panda plumage colour mutation in Japanese quail. Anim Genet. 2007;38:103–8. doi: 10.1111/j.1365-2052.2007.01568.x. [DOI] [PubMed] [Google Scholar]
- Mortazavi A, Williams BA, McCue K, Schaeffer L, Wold B. Mapping and quantifying mammalian transcriptomes by RNA-Seq. Nat Methods. 2008;5:621–8. doi: 10.1038/nmeth.1226. [DOI] [PubMed] [Google Scholar]
- Navarro RE, Ramos-Balderas JL, Guerrero I, Pelcastre V, Maldonado E. Pigment dilution mutants from fish models with connection to lysosome-related organelles and vesicular traffic genes. Zebrafish. 2008;5:309–18. doi: 10.1089/zeb.2008.0549. [DOI] [PubMed] [Google Scholar]
- Page-McCaw PS, et al. Retinal network adaptation to bright light requires tyrosinase. Nat Neurosci. 2004;7:1329–36. doi: 10.1038/nn1344. [DOI] [PubMed] [Google Scholar]
- Parichy DM. Evolution of Danio pigment pattern development. Heredity. 2006;97:200–10. doi: 10.1038/sj.hdy.6800867. [DOI] [PubMed] [Google Scholar]
- Parichy DM, Mellgren EM, Rawls JF, Lopes SS, Kelsh RN, Johnson SL. Mutational analysis of endothelin receptor b1 (rose) during neural crest and pigment pattern development in the zebrafish Danio rerio. Dev Biol. 2000;227:294–306. doi: 10.1006/dbio.2000.9899. [DOI] [PubMed] [Google Scholar]
- Parichy DM, Ransom DG, Paw B, Zon LI, Johnson SL. An orthologue of the kit-related gene fms is required for development of neural crest-derived xanthophores and a subpopulation of adult melanocytes in the zebrafish, Danio rerio. Development. 2000;127:3031–44. doi: 10.1242/dev.127.14.3031. [DOI] [PubMed] [Google Scholar]
- Parichy DM, Rawls JF, Pratt SJ, Whitfield TT, Johnson SL. Zebrafish sparse corresponds to an orthologue of c-kit and is required for the morphogenesis of a subpopulation of melanocytes, but is not essential for hematopoiesis or primordial germ cell development. Development. 1999;126:3425–36. doi: 10.1242/dev.126.15.3425. [DOI] [PubMed] [Google Scholar]
- Pfaffl MW. A new mathematical model for relative quantification in real-time RT-PCR. Nucleic Acids Res. 2001;29:e45. doi: 10.1093/nar/29.9.e45. [DOI] [PMC free article] [PubMed] [Google Scholar]
- Pla P, Alberti C, Solov’eva O, Pasdar M, Kunisada T, Larue L. Ednrb2 orients cell migration towards the dorsolateral neural crest pathway and promotes melanocyte differentiation. Pigment Cell Res. 2005;18:181–7. doi: 10.1111/j.1600-0749.2005.00230.x. [DOI] [PubMed] [Google Scholar]
- Protas ME, et al. Genetic analysis of cavefish reveals molecular convergence in the evolution of albinism. Nat Genet. 2006;38:107–11. doi: 10.1038/ng1700. [DOI] [PubMed] [Google Scholar]
- Protas ME, Patel NH. Evolution of coloration patterns. Annu Rev Cell Dev Biol. 2008;24:425–46. doi: 10.1146/annurev.cellbio.24.110707.175302. [DOI] [PubMed] [Google Scholar]
- Quigley IK, et al. Pigment pattern evolution by differential deployment of neural crest and post-embryonic melanophore lineages in Danio fishes. Development. 2004;131:6053–69. doi: 10.1242/dev.01526. [DOI] [PubMed] [Google Scholar]
- Rao C, et al. A defect in a novel ADAMTS family member is the cause of the belted white-spotting mutation. Development. 2003;130:4665–72. doi: 10.1242/dev.00668. [DOI] [PubMed] [Google Scholar]
- Rawls JF, Mellgren EM, Johnson SL. How the zebrafish gets its stripes. Dev Biol. 2001;240:301–14. doi: 10.1006/dbio.2001.0418. [DOI] [PubMed] [Google Scholar]
- Roberts RB, Ser JR, Kocher TD. Sexual conflict resolved by invasion of a novel sex determiner in Lake Malawi cichlid fishes. Science. 2009;326:998–1001. doi: 10.1126/science.1174705. [DOI] [PMC free article] [PubMed] [Google Scholar]
- Sauka-Spengler T, Bronner-Fraser M. Development and evolution of the migratory neural crest: a gene regulatory perspective. Curr Opin Genet Dev. 2006;16:360–6. doi: 10.1016/j.gde.2006.06.006. [DOI] [PubMed] [Google Scholar]
- Schneider RA, Helms JA. The cellular and molecular origins of beak morphology. Science. 2003;299:565–8. doi: 10.1126/science.1077827. [DOI] [PubMed] [Google Scholar]
- Schonthaler HB, Lampert JM, von Lintig J, Schwarz H, Geisler R, Neuhauss SC. A mutation in the silver gene leads to defects in melanosome biogenesis and alterations in the visual system in the zebrafish mutant fading vision. Dev Biol. 2005;284:421–36. doi: 10.1016/j.ydbio.2005.06.001. [DOI] [PubMed] [Google Scholar]
- Shapiro MD, et al. Genetic and developmental basis of evolutionary pelvic reduction in threespine sticklebacks. Nature. 2004;428:717–23. doi: 10.1038/nature02415. [DOI] [PubMed] [Google Scholar]
- Silver DL, Hou L, Somerville R, Young ME, Apte SS, Pavan WJ. The secreted metalloprotease ADAMTS20 is required for melanoblast survival. PLoS Genet. 2008;4:e1000003. doi: 10.1371/journal.pgen.1000003. [DOI] [PMC free article] [PubMed] [Google Scholar]
- Tamagnone L, Comoglio PM. Signalling by semaphorin receptors: cell guidance and beyond. Trends Cell Biol. 2000;10:377–83. doi: 10.1016/s0962-8924(00)01816-x. [DOI] [PubMed] [Google Scholar]
- Taneyhill LA. To adhere or not to adhere: The role of Cadherins in neural crest development. Cell Adhes Migr. 2008;2:223–230. doi: 10.4161/cam.2.4.6835. [DOI] [PMC free article] [PubMed] [Google Scholar]
- Theos AC, Truschel ST, Raposo G, Marks MS. The Silver locus product Pmel17/gp100/Silv/ME20: controversial in name and in function. Pigment Cell Res. 2005;18:322–36. doi: 10.1111/j.1600-0749.2005.00269.x. [DOI] [PMC free article] [PubMed] [Google Scholar]
- Vallin J, Girault JM, Thiery JP, Broders F. Xenopus cadherin-11 is expressed in different populations of migrating neural crest cells. Mech Dev. 1998;75:171–4. doi: 10.1016/s0925-4773(98)00099-9. [DOI] [PubMed] [Google Scholar]
- Watanabe M, et al. Spot pattern of leopard Danio is caused by mutation in the zebrafish connexin41.8 gene. EMBO Rep. 2006;7:893–7. doi: 10.1038/sj.embor.7400757. [DOI] [PMC free article] [PubMed] [Google Scholar]
Associated Data
This section collects any data citations, data availability statements, or supplementary materials included in this article.