

Abstract
Background and Aims
Simple indicators of crop and cultivar performance across a range of soil types and management are needed for designing and testing sustainable cropping practices. This paper determined the extent to which soil chemical and physical properties, particularly soil strength and pore-size distribution influences root elongation in a wide range of agricultural top soils, using a seedling-based indicator.
Methods
Intact soil cores were sampled from the topsoil of 59 agricultural fields in Scotland, representing a wide geographic spread, range of textures and management practices. Water release characteristics, dry bulk density and needle penetrometer resistance were measured on three cores from each field. Soil samples from the same locations were sieved, analysed for chemical characteristics, and packed to dry bulk density of 1·0 g cm−3 to minimize physical constraints. Root elongation rates were determined for barley seedlings planted in both intact field and packed soil cores at a water content close to field capacity (–20 kPa matric potential).
Key Results
Root elongation in field soil was typically less than half of that in packed soils. Penetrometer resistance was typically between 1 and 3 MPa for field soils, indicating the soils were relatively hard, despite their moderately wet condition (compared with <0·2 MPa for packed soil). Root elongation was strongly linked to differences in physical rather than chemical properties. In field soil root elongation was related most closely to the volume of soil pores between 60 µm and 300 µm equivalent diameter, as estimated from water-release characteristics, accounting for 65·7 % of the variation in the elongation rates.
Conclusions
Root elongation rate in the majority of field soils was slower than half of the unimpeded (packed) rate. Such major reductions in root elongation rates will decrease rooting volumes and limit crop growth in soils where nutrients and water are scarce.
Keywords: Root elongation, abiotic stress, soil chemistry, soil porosity, soil strength, Scotland, macroporosity, dry bulk density, barley, Hordeum vulgare, pore diameter
INTRODUCTION
The calls for innovation in plant science to underpin global increases in food production (Gewin, 2010) have to contend with the ceiling in crop yield that appears to have been reached in some areas of developed, highly productive agriculture, such as the UK (Defra, 2011). One possible reason for this plateau is that despite the level of nutrients applied to agricultural systems there are limitations to the rate at which plants are able to uptake and utilize them. Soil physical conditions can limit the rate at which roots elongate and thus may limit the overall volume of soil that the roots can explore, restricting the rate at which plants access water and nutrients and thereby potentially reducing yield (Whiteley and Dexter, 1982). The effects of physical properties of soils on root growth have been extensively reviewed, notably the effects of drought (Whitmore and Whalley, 2009; Bengough et al., 2011); water logging and oxygen deficiency (Morard and Silvestre, 1996; Setter and Waters, 2003); and compaction and soil strength (Bengough, 2003; Bengough et al., 2006, 2011; Tracy et al., 2011). Crop varietal differences have also been found in their sensitivity to soil physical conditions (e.g. Masle, 1992). Typically penetrometer resistances >2 MPa, air-filled volume (AFV) of <10 % and a matric potential drier than –1·5 MPa are considered to be significant limits to root elongation, such that root elongation is slowed to less than half of its unimpeded rate (Taylor and Ratliff, 1969; Bengough et al., 2011).
Several artificial systems have been developed to investigate the influence of physical properties on root growth, e.g. reduced oxygen flow in hydroponics (Pitman, 1969), including polyethylene glycol to generate water deficit in hydroponics (Whalley et al., 1998), or utilizing gels (Clark et al., 1999), glass ballotini and gravel mixes to add physical structure (Goss, 1977; Wilson et al., 1977; Goss and Russell, 1980; Bengough et al., 2010; Karley et al., 2011). Alternatively, elongation rates have been recorded in sieved soil packed to specific bulk densities (Taylor and Ratliff, 1969; Eavis, 1972a, b). However these systems cannot fully mimic the heterogeneity and interacting effects of soil biophysical constraints that occur in field soil.
In field conditions over a growing season, multiple constraints may slow the elongation of roots belonging to a single plant. This is due to both the interdependence of soil physical properties and the spatial and temporal variation in these properties. For example, in a wet compacted soil the elongation of an individual root may be limited via mechanical impedance and oxygen deficiency, whilst in a compacted dry soil, root elongation may be limited by water deficit and mechanical impedance (Eavis and Payne, 1968; Bengough et al., 2011). Further, the spatial heterogeneity of soil physical properties in the field is often large, with substantial variation in both vertical and horizontal directions, resulting in different roots of the same plant experiencing very different physical limitations. While roots often exploit spatial heterogeneity in pore structure to elongate along pathways of least resistance (Ehlers et al., 1983; McKenzie et al., 2009; White and Kirkegaard, 2010), they may also experience superimposed temporal variation due to fluctuations in the soil water balance (caused by rainfall and evapotranspiration), and tillage and farm-traffic effects (Ehlers et al., 1983; Besson et al., 2010). Heterogeneity therefore can have a major impact on root growth in the field, with soil becoming softer and easier for roots to penetrate after rainfall events, but potentially becoming subject to waterlogging after heavy rain or if the pore space is small.
While the main factors that can impact on root elongation are known, the extent to which these properties are limiting root elongation ‘on farm’ is less understood. Surveys of the penetrometer resistance of a range of field soils, however, suggest that mechanical impedance often limits root elongation, even when the soil is relatively wet (Bengough et al., 2011). In this paper we hypothesized that there are considerable constraints to root elongation in agricultural top soils under current soil management practices and that these are widespread in the UK. The results are highly topical to current trends towards the adoption of reduced (conservation) tillage systems, where shallower plough pans and large shifts in soil physical structure can occur in relation to the previous practice of inversion tillage to greater depth. We measured root elongation of barley seedlings in soil cores collected from a wide range of agricultural soils equilibrated to –20 kPa matric potential. Samples from the same soils were sieved and repacked to a bulk density of 1·06 g cm−3, and root elongation measured again, to indicate the rate of root elongation in the soil, largely free from soil mechanical impedance and hypoxia. The results from these studies were analysed together with data on the physical and chemical properties of the soils to infer the main factors limiting, and degree of limitation to, root elongation.
MATERIALS AND METHODS
Soil sampling location and soil preparation
Thirty-four farms located in eastern Scotland were identified as representing a wide range of soil types, textures, crop rotation and farm management practices. Soil types included humus-iron podzols, noncalcalcareous gleys, brown earth with gleying, and brown earths. The farms represented a range of organic, integrated [members of LEAF (Linking Environment and Farming) a UK organization that promotes environmentally responsible farming; www.leafuk.org] and intensive management systems (where ‘intensive’ refers to commercial farms that adhered to no particular management preference other than current best practice), from across five geographical regions (Inverness-shire, Aberdeenshire, Tayside, Fife and East Lothian). The selection strategy aimed to represent a wide range of agricultural soil types rather than to make comparisons between different farm management practices. Hawes et al. (2010) provides further descriptions of the field sites surveyed. On most of the farms two fields under different stages of a crop rotation were sampled, resulting in a total of 59 different fields. Intact soil cores, 56 mm diameter × 40 mm height, referred to in this paper as ‘FIELD’, were sampled from the top 0–10 cm in three separate random locations just following crop harvest in September.
Soils from 20 of these fields were pooled from the three sampling locations in each field, thoroughly mixed and then passed through a 2-mm sieve. A subsample of soil was used to calculate the moisture content of each soil sample using the wet and dry mass (after 24 h at 105 °C). The soil water content was then adjusted to 0·2 g g−1, and the soil was allowed to equilibrate overnight at 4 °C prior to packing the soil into 50-mm-diameter × 50-mm-height cores at 1·06 g cm−3 ± 0·002 (s.e.). Two packed (‘PACKED’) soil cores were prepared per field and adjusted to a matric potential of –20 kPa using tension tables. The physical conditions within these soil cores should not significantly limit root elongation, due to the relatively wet matric potential, large air-filled volume, and small penetrometer resistance.
Soil physical properties and chemical analysis
Water-release characteristic, dry bulk density and air-filled volume
FIELD cores, were saturated and placed on silica sand tables (up to –10 kPa) and ceramic suction plates (up to –50 kPa; ELE Ltd, Hemel Hempstead, UK) to adjust the matric potential serially through –0·5, –1, –5, –10, –20 and –50 kPa. The cores were then returned to –20 kPa matric potential for the root-elongation assay described below. The mass of each core was recorded at each stage to determine the volumetric water content (VWC). Soil DBD was calculated from soil dry mass (after drying at 105 °C for 48 h), following the root growth experiments detailed below. Total porosity was calculated from DBD assuming a particle density of 2·65 g cm−3. AFV was calculated by subtracting the VWC from the total porosity.
Penetrometer resistance (SSInstron-20 kPa)
A needle penetrometer (1 mm diameter, 30 ° cone angle, 4 mm min−1 penetration rate, readings; averaged at 1-mm intervals from 5–15 mm depth range) fitted to a mechanical test frame (Instron model 5544; Instron, MA, USA), with a 50-N load cell accurate to 2 mN at maximum load, was used to measure penetration force and calculate penetrometer resistance (force divided by cone cross-sectional area). All of the FIELD and PACKED cores were measured at a matric potential of –20 kPa (Bengough et al., 1997, 1990; Bengough and Mullins, 1991).
Chemical and texture analysis
The bulk sieved samples used to pack the soil cores were analysed for a range of properties. Soil pH and phosphorus, potassium and magnesium contents were measured by NRM laboratories using British Standard BS 3882: 2007. Carbon and nitrogen concentrations were measured using an Exeter analytical CE440 elemental analyser (EAI, Coventry, UK). Texture was measured by NRM laboratories using laser diffraction of soils initially dispersed with sodium hexametaphosphate (Malvern Mastersizer 2000; Malvern Instruments Ltd, Malvern, UK).
Root elongation
Barley seeds (Hordeum vulgare ‘Optic’) were soaked for 4 h, washed three times in distilled H2O and then surface sterilized with 2 % calcium hypochlorite. Seeds were placed between damp filter paper and allowed to germinate at 15 °C for 2 d, prior to being stored at 4 °C for approx. 1 d. Two holes 3 mm wide and 10 mm deep were made in each soil core, 10 mm from the edge at opposite edges of the soil core. The longest seminal root of each of two seedlings was measured prior to inserting all roots from an individual seed into the prepared holes. Seeds were secured in place using a 50-mm-diameter Petri dish as a lid taped to each core. All cores were placed in individual plastic sealable bags to minimize water loss. The FIELD core experiment was performed at a separate time from the PACKED soil experiment. Seeds and soil were incubated at 15 °C for 2 d, after which each seedling was carefully removed from the soil cores and the longest root of each was measured. Soil wet mass (immediately after extraction) and dry mass (after 24 h at 105 °C) were recorded. Gravimetric water content was converted to VWC by multiplying by DBD.
Statistical analysis of soil and root data
Statistical analysis was performed using Genstat 13ed. From the water release data, the equivalent diameter, d, of the largest water-filled pore at matric potential, ψ is given by
| (1) |
(Marshall and Holmes, 1988). For the measured matric potentials –0·5, –1, –5, –10, –20 and –50 kPa, this corresponds to pore diameters of 600, 300, 60, 30, 15 and 6 µm. The volume of pores in a particular diameter range can therefore be estimated from the difference in VWC between the corresponding matric potentials (Pores>300 µm, Pores60–300 µm, Pores30–60 µm, Pores6–30 µm, Pores<6 µm).
Logistic (S-shaped or inverse S-shaped) curves were fitted to both the VWC and AFV against log matric potential data using GENSTAT 13ed – Regression analysis, Standard curves. Indicators are listed as AFVA, AFVB, AFVC, AFVM or VWCA, VWCB, VWCC and VWCM where
| (2) |
The curve fits were used to estimate the AFV and VWC at –1500 kPa (AFV−1500 kPa-est and VWC−1500 kPa-est), and the VWC at which the AFV would be 10 % (VWCAFV10 %). Further the difference in VWC between –20 kPa and the VWCAFV10 % (d_10 %AFV), the VWC−1500 kPa-est (PAWvwc) and the field capacity (d_FC) were calculated. All statistical analyses were performed on the mean data for each field. Each dataset was transformed where required to ensure a normal distribution (see Table 1 for the transformation used for each parameter). Principal component analysis was performed using a correlation matrix methodology. All-subsets regression was used to assess and build models based on the subset of fields that included all chemistry and texture data (n = 42). Models were considered significant if the Aiken information coefficient (AIC) value was within 2 of the lowest AIC value for the analysis set and all indicators in the model made a significant contribution to the model. Three subsets of indicators were used: (1) the 14 indicators that described the physical status of the soil at –20 kPa, including pore structure and the water retention curve indicators; (2) 23 ‘simple’ indicators (as marked in Table 1 – indicators that required limited calculations, no line fitting); and (3) all 42 indicators. Since all-subsets regression analysis was limited to 16 indicators for the larger subsets, indicators were randomly assigned to groups of indicators and all-subsets regression was used to assess models. This was repeated ten times. The 16 indicators included in the highest number or highest average proportion of models were assessed in a final analysis.
Table 1.
FIELD soil parameter distribution
| Indicator set | Soil parameter | Mean ± s.e. | n | Units | Coefficient of variation | Skewness | Transformation |
|---|---|---|---|---|---|---|---|
| SS | % C | 2·849 ± 0·353 | % of dry | 84·11 | 4·52 | Complementary log | |
| SS | % N | 0·184 ± 0·012 | 46 | mass | 44·34 | 1·455 | SQRT |
| SS | C : N | 14·63 ± 0·547 | – | 25·35 | 4·582 | TriGamma | |
| SS | K | 138·7 ± 10·08 | mg L−1 | 48·19 | 0·923 | ln(x + 1) | |
| SS | Mg | 136·9 ± 8·896 | mg L−1 | 43·11 | 0·488 | ln(x + 1) | |
| SS | P | 41·47 ± 2·525 | mg L−1 | 40·39 | 1·127 | ln(x + 1) | |
| SS | pH | 5·684 ± 0·0462 | 44 | log (L mol−1) | 5·392 | 0·74 | None |
| SS | % Weight_clay | 19·3 ± 1·033 | % | 35·50 | –0·351 | None | |
| SS | % Weight_sand | 56·41 ± 1·955 | % | 22·99 | 0·24 | None | |
| SS | % Weight_silt | 24·3 ± 1·176 | % | 32·11 | 0·554 | None | |
| SS, RGE | DBD | 1·319 ± 0·0205 | g g cm−3 | 11·97 | –0·181 | None | |
| SS, RGE | SSInstron−20 kPa | 1·899 ± 0·0789 | MPa | 31·89 | 0·43 | None | |
| SS | AFV−1 kPa | 0·0332 ± 0·00228 | cm3 cm−3 | 52·84 | 1·307 | –double log | |
| SS | AFV−5 kPa | 0·127 ± 0·00674 | cm3 cm−3 | 40·72 | 0·44 | None | |
| SS | AFV−10 kPa | 0·165 ± 0·00755 | cm3 cm−3 | 35·12 | 0·337 | ln(x + 1) | |
| SS, RGE | AFV−20 kPa | 0·206 ± 0·00766 | cm3 cm−3 | 28·49 | 0·374 | None | |
| SS | AFV−50 kPa | 0·219 ± 0·0081 | cm3 cm−3 | 28·44 | 0·346 | None | |
| SS, RGE | VWCsat | 0·53 ± 0·00652 | cm3 cm−3 | 9·45 | –0·167 | None | |
| SS | VWC−1 kPa | 0·496 ± 0·00627 | cm3 cm−3 | 9·70 | –0·161 | None | |
| SS | VWC−5 kPa | 0·402 ± 0·00734 | cm3 cm−3 | 14·03 | –0·00546 | None | |
| SS | VWC−10 kPa | 0·365 ± 0·00835 | cm3 cm−3 | 17·60 | –0·151 | None | |
| SS, RGE | VWC−20 kPa | 0·323 ± 0·00817 | cm3 cm−3 | 19·41 | –0·189 | None | |
| SS | WWC−50 kPa | 0·311 ± 0·00825 | cm3 cm−3 | 20·39 | –0·149 | None | |
| RGE | Pores>300 µm | 0·0332 ± 0·00228 | cm3 cm−3 | 52·84 | 1·307 | ln(x + 1) | |
| RGE | Pores60−300 µm | 0·094 ± 0·0057 | cm3 cm−3 | 46·61 | 0·504 | ln(x + 1) | |
| RGE | Pores30–60 µm | 0·0378 ± 0·00246 | cm3 cm−3 | 50·04 | 1·686 | ln(x + 1) | |
| RGE | Pores6–30 µm | 0·0537 ± 0·00157 | 59 | cm3 cm−3 | 22·50 | 0·659 | None |
| RGE | Pores<6 µm | 0·311 ± 0·00826 | cm3 cm−3 | 20·40 | –0·149 | None | |
| AFVA | –0·0363 ± 0·00696 | cm3 cm−3 | –147·30 | –4·164 | TAL | ||
| AFVB | 3·522 ± 0·118 | cm3 cm−3 log kPa−1 | 25·67 | 0·643 | None | ||
| AFVC | 0·264 ± 0·0115 | cm3 cm−3 | 33·41 | 1·176 | ln(x + 1) | ||
| AFVM | 0·662 ± 0·0256 | cm3 cm−3 | 29·68 | –1·569 | antilog + 1 | ||
| AFV−1500 kPa-est | 0·227 ± 0·00767 | cm3 cm−3 | 25·92 | 0·363 | None | ||
| RGE | VWCA | 0·302 ± 0·00777 | cm3 cm−3 | 19·77 | –0·2 | None | |
| RGE | VWCB | –3·508 ± 0·118 | cm3 cm−3 log kPa−1 | –25·82 | –0·683 | None | |
| RGE | VWCC | 0·264 ± 0·0115 | cm3 cm−3 | 33·55 | 1·239 | –double log (+100) | |
| RGE | VWCM | 0·661 ± 0·0257 | cm3 cm−3 | 29·85 | –1·625 | –antilog | |
| VWC−1500 kPa-est | 0·302 ± 0·00778 | cm3 cm−3 | 19·79 | –0·198 | None | ||
| VWCAFV10 % | 0·429 ± 0·00652 | cm3 cm−3 | 11·65 | –0·161 | None | ||
| d_10 %AFV | 0·106 ± 0·00765 | cm3 cm−3 | 55·28 | 0·372 | None | ||
| d_FC | 0·0789 ± 0·00287 | cm3 cm−3 | 27·95 | 1·646 | –double log (+100) | ||
| PAWvwc | 0·0211 ± 0·00111 | cm3 cm−3 | 40·39 | 0·368 | None |
The 14 indicators of the ‘root growth experiment’ set and the indicators used as ‘simple set’ are shown. Mean, coefficient of variation, skewness and transformation were used for further analysis of complete FIELD core set.
RESULTS
Root elongation in FIELD and PACKED soils compared
The average root growth of Hordeum vulgare (‘Optic’) seedlings achieved in intact FIELD cores over 48 h was 16·0 ± 0·56 mm, as compared with 48·2 ± 1·1 mm in PACKED cores (Fig. 1). The distribution of the elongation rates between the FIELD core and PACKED core experiments illustrates the significantly slower elongation rate found in the FIELD cores (Fig. 1). The maximum and minimum root elongation achieved in an individual FIELD core set over 48 h was 30·2 mm and 9·8 mm, respectively. Of the FIELD soils tested 94 % had a root growth rate slower than about half of the average root growth achieved for PACKED soils. Further, within the FIELD-cores-only dataset 50 % of the FIELD soils showed a growth rate that was less than half of the maximum growth rate achieved within the FIELD soil-cores experiment. Some of this variation in root elongation was significantly associated with region (REML, P = 0·035, F = 2·84) but there was no significant association with field management categories and there was no interaction (P = 0·186, F = 1·75; region × field management, P = 0·516, F = 0·88). Roots elongated fastest in soil from Aberdeenshire (17·69 ± 0·83 mm), Inverness-shire (16·17 ± 2·89 mm) and Tayside (16·10 ± 0·99 mm). The lowest growth rates were observed in soil from East Lothian (13·56 ± 1·23 mm) and Fife (13·26 ± 1·83 mm).
Fig. 1.
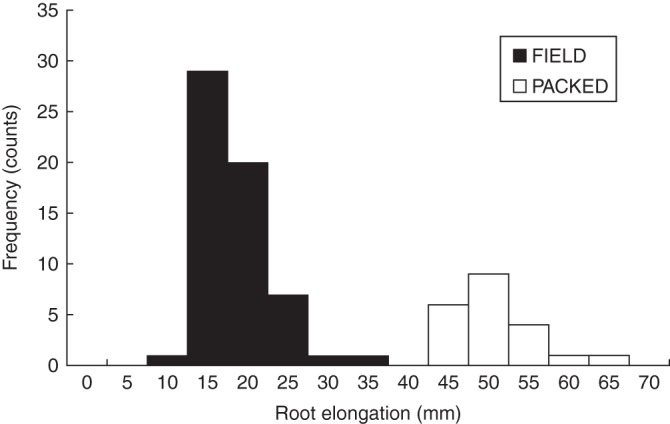
Relationship between root elongation and soil properties in soil cores, showing distribution of root elongation over 48 h at 15 °C for Hordeum vulgare (‘Optic’) for FIELD and PACKED cores, as indicated.
Figure 2 shows the root elongation in the two experiments against the AFV (–20 kPa; Fig. 2A) and the penetrometer resistance (Fig. 2B). Using all significant data, linear relationships were found between root growth (ln transformed) and both AFV [P < 0·001, variance ratio (v.r.) = 876·18, r2 = 0·92; Fig. 2A] and penetrometer resistance (P < 0·001, v.r. = 216·31, r2 < 0·735). Figure 2B shows a logarithmic curve fitted to the untransformed root growth penetrometer data (P < 0·001, r2 = 0·895). Penetrometer resistance was significantly correlated with the AFV−20 kPa (P < 0·001, r2 = 0·750). In both cases the predictions made using the FIELD core data underestimates the root growth in the loosely packed cores, compared with the regression curve when all data were included in the line fit. Significant relationships were also found in the FIELD-only data using the same regression analysis, but the percentage of variation was reduced to 61 % and 22 % for air-filled porosity and penetrometer resistance, respectively. VWC explained 63·6 % and DBD explained 53·8 % of the variation in root growth in the combined dataset.
Fig. 2.

Root elongation in repacked and field cores. Root growth over 48 h for PACKED and FIELD cores related to (A) air-filled porosity at –20 kPa and (B) penetrometer resistance. Grey dashed line, regression based on all cores; black continuous line, regression based only on FIELD cores (lines forward and backward extended).
Soil chemical and physical properties in relation to root elongation
PACKED soils
The chemical and physical properties of the PACKED cores are shown in Fig. 3A as a principal components analysis, which allows a large number of variables to be reduced to a smaller number of variables while still capturing the variation in the dataset. Broadly speaking the further along the axis the variables appear on Fig. 3A the larger their contribution to the specific component (Schlens, 2009). Of the variation in the chemical and physical properties, 36 % and 19 %, respectively, were explained by the first two principal components (PC1PACKED and PC2PACKED). Soil samples with high values of PC1PACKED tend to have a high percentage of silt (mean 22 ± 1·3 s.e., maximum 32 %) and clay (mean 18 ± 1·6 s.e., maximum 31 %), whereas samples with low PC1PACKED tend to have a high percentage of sand (mean 59 ± 2·7, maximum 84 %). High PC2PACKED values were associated with high pore volume (mean 0·662 ± 0·005 cm3 cm−3, maximum 0·704), low DBD (minimum 1·04 g cm−3, maximum 1·09 g cm−3) and low C : N ratio (minimum 12·2, maximum 36·2). No significant relationship was found between root growth and either principal component (P = 0·234, v.r. = 1·52 and P = 0·789, v.r. = 0·07, PC1PACKED and PC2PACKED, respectively; Fig. 3B, PC1PACKED). Further, there was no significant relationship between any of the individual soil indicators and the root growth rate (P > 0·05) within the PACKED soil. To assess whether any combination of the indicators could explain a significant proportion of the root growth rate in the PACKED soil, all-subsets regression was used. Two models chosen on the basis of the AIC value and the significance of the model indicators (all indicators P < 0·05, % clay + ln(K); Fig. 3C) and % sand + ln(K) explained 29 % and 28 % (P = 0·020, v.r. = 4·95, P = 0·023, v.r. = 4·77) of the variation in root elongation, respectively.
Fig. 3.
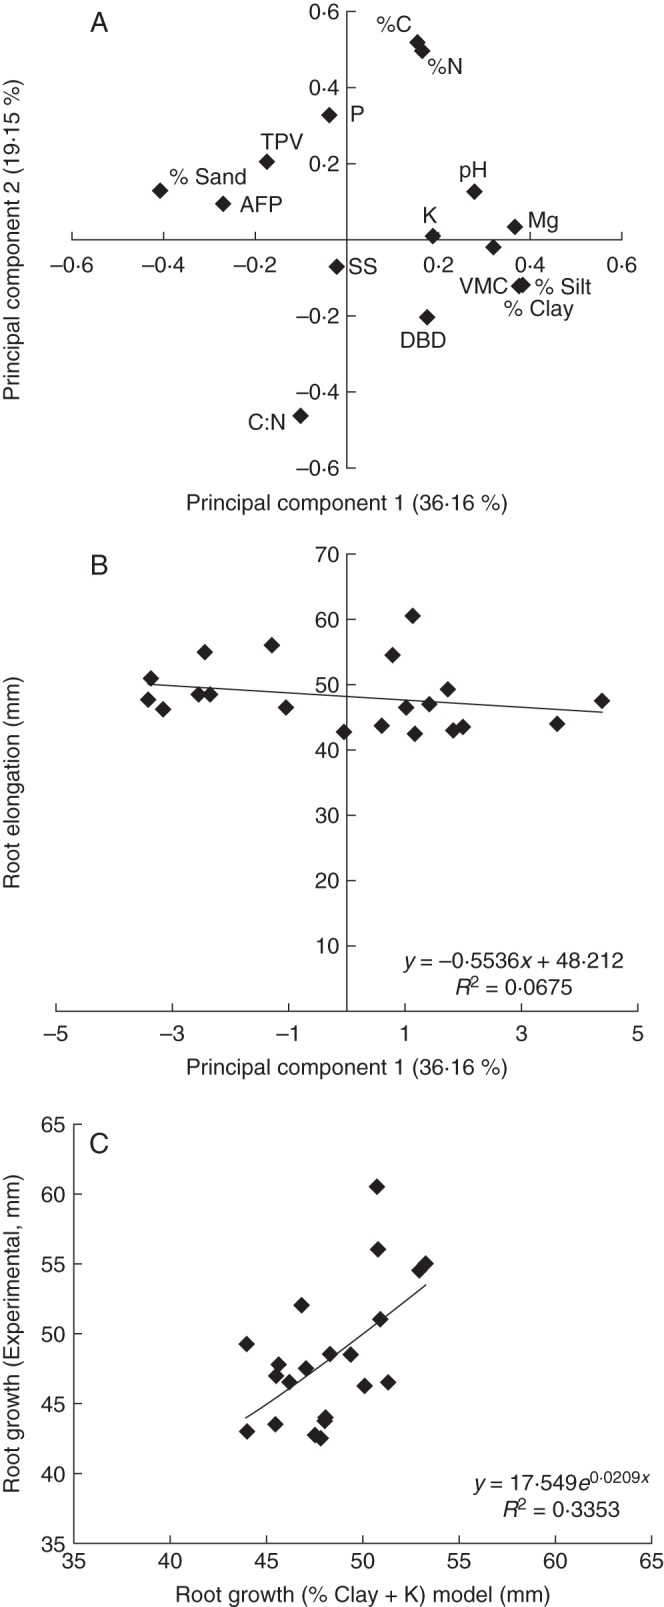
Relationship between root elongation over 48 h for Hordeum vulgare (‘Optic’) and soil properties in repacked soil cores, showing (A) latent roots of principal component analysis of soil physical and chemical indicators; (B) regression analysis of root elongation against component 1 (scores) of the principal components analysis (P = 0·234); and (C) predictions of root elongation from the highest-ranked all-subsets regression model.
FIELD soils
Since a large proportion of the variation in root elongation between the two experiments could be explained by differences in soil physical properties, we explored further whether these properties could explain the variation in root growth within the FIELD soils. Forty-two indicators were measured or calculated. Table 1 shows the mean, standard error of mean, coefficient of variance and skewness of these indicators. The soils presented significant variation in many of the individual physical indicators. Initial assessment showed that at the matric potential (–20 kPa) used for the root elongation assay, the mean AFV was 0·206 ± 0·008 cm3 cm−3. Moreover, 50 % of cores had an AFV of <28 %, and 1·7 % of the FIELD cores had an AFV of <10 %, suggesting that between 50 % and 1·7 % of the FIELD soil cores potentially presented an oxygen-limited environment. Further, 26 out of the 59 fields, had a penetrometer resistance above 2 MPa (average 1·899 ± 0·079 MPa at –20 kPa) suggesting that 44 % of the fields contained soil that would cause substantial impedance to root growth due to the strength of the soil, even though the soil was relatively wet. As matric potential was maintained at –20 kPa, water availability would not be expected to be limiting during the root growth experiments.
Regression analyses of each individual soil parameter and root growth are summarized in Fig. 4. The highest percentage of variation in root elongation was accounted for by: (1) air-filled volumes (AFV−5 kPa 65·7 %, AFV−10 kPa, 59·6 %, AFV−20 kPa 60·3 %, AFV−50 kPa 60·7 %); (2) 60–300 µm pore volume (Pores60–300 µm 61·1 %); (3) AFV estimated at –1500 kPa (using the AFV against matric potential curve fit values – AFV−1500 kPa_est 60·7 %); and (4) the volume of water required to reduce the AFV to 10 % (d_10 %AFV 60·2 %). Figure 4 illustrates where, based on the effect from the regression analysis, the average values for soil obtained from the five regions would predict a positive or negative effect on root growth [low root growth predicted (red) and high root growth predicted (green)]. In tabular form Fig. 4 illustrates that in some soil, e.g. from Inverness-shire, some indicators (e.g DBD and SSPR) indicate a constraint on root growth, whereas other indicators such as the AFV−20 kPa indicate a strong positive effect on root growth. The highest ranking four individual parameter relations based on an all-subsets comparison are illustrated in Fig. 5A (AFV−5 kPa, AFV−20 kPa, AFV−50 kPa and Pores60–300 µm).
Fig. 4.

Linear regression of each soil parameter against root elongation in intact (FIELD) cores (mean ± s.e. of each indicator based on regional groupings). P indicates a significant positive correlation with root elongation, N indicates a significant negative correlation with root elongation; ns indicates no significant relationship; v.r. = variance ratio. Res > Res indicates residual variance exceeds variance of response variate. Also shown are mean soil physical indicators for Regions. Colour coding: green, parameter value indicates enhanced root elongation; red; parameter value indicates reduced root elongation. Shading indicates the strength of the response.
Fig. 5.

Regression analysis of root elongation against soil physical indicators: (A) highest ranking individual parameter models; (B, C) dual parameter models in which the size of the circles is proportional to root elongation [B, penetrometer resistance against AFV−20 kPa; C, penetrometer resistance against volume of pores with diameter 60–300 µm (Pores60–300 µm)]; (D) relationship between root growth after soil strength has been accounted for, and volume of pores with diameter 60–300 µm (Pores60–300 µm) and AFV−20 kPa (circles: size equals residual of the regression of root growth against penetrometer resistance; closed, positive residuals; open, negative residuals).
A significant but relatively low correlation between the soil strength and the root growth was found in the FIELD cores (P < 0·001, v.r. = 12·55), this relationship was not significant for penetration resistance when the effect of AFV−20 kPa or the effect of pores (60–300 µm) was taken into account, despite many of the cores recording a penetrometer resistance above 2 MPa (FIELD cores). Figure 5(B, C) illustrates the relationships between penetrometer resistance and AFV−20 kPa or volume of pores with diameter 60–300 µm (Pores60–300μm) and root elongation (bubble size). It can be seen that even at relatively low penetrometer resistance (<1·5 MPa) there is a significant variation in the root elongation rate. We then looked at the moderating effect of pores (60–300 µm) and air-filled porosity (AFP) on root elongation after the effect of soil strength had been taken into account. Figure 5D shows each plotted against the residual of the regression analysis of soil strength against root elongation (P < 0·001, r2 = 0·401, AFP−20 kPa), illustrating that those roots with a higher than expected root growth tend to have larger values of Pores60–300 µm or higher AFP−20 kPa.
The subset of data that included all the texture and chemical indicators was used to compare multiple parameter models of indicators using all-subsets regression. Models were compared based on their Adjusted R2 value, the AIC value and the level of significance of each of the individual indicators in the model. Initially an all-subsets regression was performed using a subset of 14 indicators thought to most likely describe the physical indicators to which the roots would be exposed during the root growth experiment (AFV−20 kPa, VWCsat, DBD, VWC−20 kPa, soil strength, Pores>300 µm, Pores60–300 µm, Pores30–60 µm, Pores6–30 µm, Pores<6 µm, VWCA, VWCB, VWCC and VWCM). The highest ranking model is shown in Table 2 (73·6 %, v.r. = 33·31, P < 0·001; DBD, P < 0·001; VWC−20 kPa, P < 0·001; Pores60–300 µm, P < 0·001; VWCB, P = 0·003; VWCM, P = 0·003) Other high-ranking models with AIC values within two of the illustrated models included AFV−20 kPa, Pores<6 µm, VWCsat and VWCA. All high-ranking models included the parameter Pores60–300 µm. Two other groups of indicators were assessed, 23 ‘simple’ indicators (see Table 1) or all 42 indicators. The highest ranking models are shown in Table 2, accounting for >70·0 % of the variation in the root elongation in the subset of data and 69·4 % when applied to the data from all 59 fields.
Table 2.
Models generated by all-subsets regression using three different subsets of indicators: values are the probability (P) for each of the parameters from a multiple regression including all parameters with P values against the root elongation rates (a value of 0 means the P value is <0.001)
| % of root elongation accounted for | DBD | Pores 60–300 μm | Pores <6 µm | AFV–10 kPa | AFV–20 kPa | AFVB | AFVM | VWCS | VWC–1 kPa | VWC–5 kPa | VWC–10 kPa | VWC–20 kPa | VWC–50 kPa | VWCA | VWCB | VWCM | PAWvwc-est | |
|---|---|---|---|---|---|---|---|---|---|---|---|---|---|---|---|---|---|---|
| Root elongation experiment | 73·6 | 0 | 0 | – | – | – | 0 | – | 0 | 0 | ||||||||
| 73·6 | 0 | 0 | 0 | – | – | – | – | 0 | 0 | |||||||||
| 73·5 | 0 | 0 | – | – | – | – | 0 | 0 | 0 | |||||||||
| 73·2 | 0 | 0 | – | 0·01 | 0 | – | – | 0 | 0 | |||||||||
| Basic 23 indicators* | 72·9 | 0·02 | 0 | – | 0 | 0 | 0·05 | 0·01 | ||||||||||
| 72·4 | 0·03 | 0·01 | 0·01 | – | 0·01 | 0 | 0·01 | |||||||||||
| All indicators | 74 | 0·001 | – | – | 0 | 0 | 0 | 0·001 | – | – | ||||||||
| 73·7 | 0·001 | 0 | – | 0 | – | 0·001 | 0·001 | – | – | |||||||||
| 73·7 | 0 | – | – | – | 0 | 0 | 0·001 | 0 | – | |||||||||
| 73·5 | 0·001 | 0 | – | 0 | 0·001 | – | 0·001 | – | – | |||||||||
| 73·6 | 0·001 | – | 0·001 | 0 | 0 | 0 | – | – | – | |||||||||
| 73·2 | 0 | 0 | – | – | – | 0 | 0·001 | 0 | – | |||||||||
| 74·8 | 0 | – | – | – | 0 | 0 | – | 0·001 | 0·001 | |||||||||
| 73·2 | 0·001 | 0 | 0·001 | 0 | – | 0·001 | – | – | – |
Values within the table in italics show that the indicator is having a positive effect in the model, whilst values in bold show that it is having a negative effect. Italics and bold in the column headings shows the effect of the indicator in the single regression model. For information on indicators included in the root-elongation experiment group see Materials and Methods and Table 1.
* The basic 23 indicator group is listed in Table 1.
Variation in soil physical and chemical properties
Principle component analysis was used to summarize the variation and condense the number of variables in soil physical and chemical parameter data (Fig. 6), a subset of 42 fields was used for this analysis. The first and second principal components accounted for 47·21 % and 22·11 % of the variation in the soil physical data. Soils with a more negative principal component 1 (PCA1) value tended to have greater VWC whereas those with a more positive PCA1 values tend to be associated with larger than average AFV at each of the matric potentials tested, irrespective of the DBD (Fig. 6A, loadings; B, scores). More negative principal component 2 (PCA2) values were associated with high DBD as opposed to more positive values which were associated with high VWC at saturation and –1 kPa matric potential. Principal component analysis of the chemical data are shown in Fig. 6 (E, loadings; D, scores). PC1chem (36·05 %) separated soils mainly on C and N variation, whereas PC2chem (26·23 %) separated mainly on the nutrient concentration.
Fig. 6.

Principal component analysis of soil physical and chemical indicators of intact field cores from 42 agricultural fields: (A–C) physical; (D–F) chemical; (A, D) loadings of the PCA; (B, E) scores of the PCA for individual fields coded by the field region groups; (C, F) regression analysis of root elongation of Hordeum vulgare (‘Optic’), in cores against component 1 from physical and component 2 from chemical PCA, respectively.
Regression analysis of root elongation against the principal components of the physical properties of the soil cores produced significant correlations (Fig. 6C). The first principal component of the soil physical indicators accounted for 60·8 % of the variation in root elongation (PCA1, P < 0·001, v.r. = 64·52, Fig. 6C; PCA2, n.s. 1·4 %, P = 0·218, v.r. = 1·57, data not shown). PCA1 and PCA2 combined to account for 62·9 % of the variation (P < 0·001, v.r. = 24·18). Neither of the two principal components based on the chemistry of the soils significantly predicted the root elongation rate (PC1chem, n.s. 1·3 %, P = 0·220, v.r. = 1·55, data not shown; PC2chem, n.s. 6·6 %, P = 0·056, v.r. = 0·056; Fig. 6F). However PC1chem and PC2chem combined to accounted for 20·6 % of the variation in root elongation (P = 0·008, v.r. = 4·54)
DISCUSSION
It is recognized that an essential element in agricultural systems necessary to maintain and potentially increase crop yields is the ability of crop roots to extend and extract vital nutrients and water throughout the soil profile (Cooper et al., 1987; Stalham and Allen, 2001; Gewin, 2010). Future crop varieties, able to perform well under a range of adverse conditions, may require a larger or differently arranged root system, and be more physiologically efficient for both nutrient and water utilization (Ceccarelli, 1996; Palta et al., 2011). Any soil property that inhibits a plant from elongating and proliferating its roots into the most efficient spatial arrangement to extract water and nutrients from the soil may have a profound detrimental effect on plant productivity. The simplified, ex situ soil test used here was sensitive enough to demonstrate significant variation in root elongation and associate it with soil physical properties indicative of the state of the field.
Effect of soil strength and soil porosity on root elongation
The average root elongation rate in the FIELD soils was only one-third of that in the PACKED soils, indicating that the physical structure of the soil was a major limit to root extension in the field soils. The relatively fast root elongation rates in the PACKED soils, with relatively little variation, suggests that soil physical conditions in the FIELD soils represented a far greater limitation to seedling root elongation than chemical and biological factors. Given that the matric potential of the soil when tested was relatively wet (–20 kPa), it is likely that soil physical limitations may be even greater than this in situ for much of the growing season, since penetration resistance increases as soil dries (Taylor and Ratliff, 1969; Bengough et al., 2011). While biological factors were not measured in the FIELD cores, aspects of the variation in biological factors in the sieved soil samples will be discussed in separate publications.
Root elongation was correlated with both the volume of large pores (60–300 µm), and with penetrometer resistance. The strong correlation between the root elongation rate and the volume of large pores (air-filled at –20 kPa matric potential) could have two explanations: (1) that roots are taking advantage of the low-resistance channels presented by the larger soil pores to avoid mechanical impedance due to the strength of the bulk soil; or (2) that root elongation is directly limited by hypoxia (or some combination of hypoxia and soil strength) if the rate of oxygen diffusion to the root surface is too slow. Initially we shall consider the evidence for the first of these explanations (a primarily soil structure–strength effect), and then possible evidence for the second (hypoxia).
Root elongation, soil strength and macroporosity
The relationship between root elongation rate and penetrometer resistance across the PACKED and FIELD soils is reasonably consistent with published data for peanut, cotton (Taylor and Ratliff, 1969) and maize roots (Mirreh and Ketcheso, 1973; Veen and Boone, 1990) although Fig. 2 suggests a relatively reduced rate of decline in elongation rate between 1- and 3-MPa penetrometer resistance than is apparent in other data. This shallower decline may be associated with the presence of continuous pores within the field soils that permit root growth to continue even in soils where the bulk matrix (as measured by penetrometer resistance) is relatively hard. Roots can exploit cracks and pores within the soil that have relatively little effect on the resistance to a penetrometer that is confined to move in a straight line (McKenzie et al., 2009). Indeed, the spatial variation in penetrometer resistance is greater for field soils than packed cores (Perfect et al., 1990). For instance, the field penetrometer resistance that limits oat root growth was found to be 4·6–5·1 MPa in untilled soil layers, as compared with 3·6 MPa for tilled topsoils (Ehlers et al., 1983) due to roots exploiting a network of continuous biopores in the untilled soil. Such pore networks enable roots to penetrate to depth in very hard Australian sub-soils, where wheat root growth is confined almost entirely to biopores (White and Kirkegaard, 2010).
Further, a significant correlation has been found between soil strength and root-penetration resistance in field soil cores, but with greater variation between root- and probe-penetration resistances in intact soil cores than in packed soil cores (Bengough and Mullins, 1991): in one such instance, root-penetration resistance was only one-quarter of that expected from the penetrometer measurement, due to the presence of a crack. In the current experiment, only one penetrometer resistance measurement was made per soil core (<15 mm distance, with surface 0–4·5 mm readings omitted) – additional penetrometer measurements, to greater depths and at multiple spatial locations, may have further improved correlations with root elongation by better characterizing the soil strength.
Root elongation and hypoxia
It is important to consider whether hypoxia could be limiting root elongation rates in many of these soils, giving rise to the slower elongation rates measured. Previous approaches to consider aeration as a limit to root growth have often taken a figure of <10 % air-filled porosity to indicate possible hypoxia (Grable and Siemer, 1968; Letey, 1985; daSilva et al., 1994). Oxygen limitation has, however, been suggested to limit pea root elongation at up to 28 % AFV in sand (Eavis, 1972b; Warnaars and Eavis, 1972), although peas are relatively sensitive to waterlogging stress. Within the FIELD cores, after the effect of soil strength had been taken into account, only soil cores with values of AFV <26 % were found to have negative residuals, suggesting a possible extra impact of oxygen deficiency in these cores (though 54 % of cores had air-filled porosities <26 %). However, there were still many examples where root elongation was still faster than would be expected (positive residuals) down to 13·9 % AFV. The data are therefore inconclusive on the importance of hypoxia, although the balance of the literature would suggest that for barley roots growing near the surface of soil cores with air-filled porosities >10 %, hypoxia would not normally be the primary constraint to root elongation.
Seedling root elongation as an assay
The method of ex situ root extension described in this paper offers a potential indicator of the biophysical condition of agricultural soil. Root extension varied between soils over a 4-fold range, and was primarily correlated with soil physical conditions. By incorporating a control treatment with sieved repacked soil, it is possible to isolate soil physical effects from biological and chemical factors that survive the sieving process.
While being successful in these tests, the assay should be used with consideration. To describe fully the potential variation in root elongation rate under field conditions, measurements for the full range of representative matric potentials will always be required, since physical limitations such as hypoxia in wetter soil or mechanical impedance and water stress in drier soil are likely to play an even more important limiting role in the field. Another factor that needs to be accounted for is the quantity of nutrients already present in the plants when the assay begins. Early seminal root development in barley under non-inhibiting conditions is supported by the initial energy and nutrients stored in the grain, and this may reduce sensitivity to nutrient limitations in the soil tested.
More generally, the assay should be valuable in comparing the genetic variation in root elongation responses to soil physical limitations. The seminal root of barley (‘Optic’) was chosen for this study because it is one of the most commonly grown malting varieties in northern UK. This cultivar has a mean diameter of seminal root of 0·605 ± 0·03 mm when grown in the gel system base (Bengough et al., 2004). Its diameter is typical of other varieties, e.g. when compared with 23 other cultivars and mutants it appeared in position 10 within the range of lines tested (T. A. Valentine et al., unpubl. res.). Variation in root diameter may impact on a roots ability to push through hard soil (Materechera et al., 1992) or change the range of pores that are accessible for root elongation (i.e. narrower seminal roots or lateral roots may have access to smaller diameter pores). There is also evidence from McKenzie et al. (2009) that some varieties are better able to penetrate and proliferate into subsoil when pore options are limited. Therefore an understanding of the range of responses to soil physical properties among varieties and species may identify bespoke phenotypes for particular soil physical constraints.
Although the aim of the paper was not primarily to compare regions and farming preferences, regions differed significantly in terms of the indicator. Moreover, root elongation and the soil physical conditions ranged widely among fields within a region or within a farm management system. We know the method of cultivation can have major effects on soil structure and can affect crop establishment (Atkinson et al., 2009a, b). The extent to which such differences between fields are related to agronomic factors such as crop sequence, inputs and tillage will be examined in a further paper.
In summary, there is significant evidence that root elongation is being severely inhibited in many of the agricultural soils tested. Different regions and fields are constraining root elongation as a result of soil strength and oxygen deficiency. In some fields, however these constraints are being partially mitigated by the availability of macropores that are accessible to the roots and enabling root elongation. Soil physical constraints are likely to be more severe deeper in the soil profile due to presence of compacted subsoils. Thus, there is much scope to improve root penetration of soil by identifying cultivars and root traits better suited to these conditions, in partnership with improvements in the management of soil.
ACKNOWLEDGEMENTS
This work was funded by the Scottish Government Rural and Environment Science and Analytical Services Division (RESAS). We would also like to thank Dennis Gordon and Sandra Caul for technical assistance.
LITERATURE CITED
- Atkinson BS, Sparkes DL, Mooney SJ. Effect of seedbed cultivation and soil macrostructure on the establishment of winter wheat (Triticum aestivum) Soil & Tillage Research. 2009a;103:291–301. [Google Scholar]
- Atkinson BS, Sparkes DL, Mooney SJ. The impact of soil structure on the establishment of winter wheat (Triticum aestivum) European Journal of Agronomy. 2009b;30:243–257. [Google Scholar]
- Bengough AG. Root growth and function in relation to soil structure, composition, and strength. In: de Kroon H, Visser EJW, editors. Root ecology – ecological studies. Vol. 168. New York, NY: Springer-Verlag; 2003. pp. 151–171. [Google Scholar]
- Bengough AG, Mullins CE. Mechanical impedance to root growth: a review of experimental techniques and root growth responses. Journal of Soil Science. 1990;41:341–358. [Google Scholar]
- Bengough AG, Mullins CE. Penetrometer resistance, root penetration resistance and root elongation rate in two sandy loam soils. Plant and Soil. 1991;131:59–66. [Google Scholar]
- Bengough AG, Mullins CE, Wilson G. Estimating soil frictional resistance to metal probes and its relevance to the penetration of soil by roots. European Journal of Soil Science. 1997;48:603–612. [Google Scholar]
- Bengough AG, Gordon DC, Al-Menaie H, et al. Gel observation chamber for rapid screening of root traits in cereal seedlings. Plant and Soil. 2004;262:63–70. [Google Scholar]
- Bengough AG, Bransby MF, Hans J, McKenna SJ, Roberts TJ, Valentine TA. Root responses to soil physical conditions: growth dynamics from field to cell. Journal of Experimental Botany. 2006;57:437–447. doi: 10.1093/jxb/erj003. [DOI] [PubMed] [Google Scholar]
- Bengough AG, Hans J, Bransby MF, Valentine TA. PIV as a method for quantifying root cell growth and particle displacement in confocal images. Microscopy Research and Technique. 2010;73:27–36. doi: 10.1002/jemt.20749. [DOI] [PubMed] [Google Scholar]
- Bengough AG, McKenzie BM, Hallett PD, Valentine TA. Root elongation, water stress, and mechanical impedance: a review of limiting stresses and beneficial root tip traits. Journal of Experimental Botany. 2011;62:59–68. doi: 10.1093/jxb/erq350. [DOI] [PubMed] [Google Scholar]
- Besson A, Cousin I, Bourennane H, et al. The spatial and temporal organization of soil water at the field scale as described by electrical resistivity measurements. European Journal of Soil Science. 2010;61:120–132. [Google Scholar]
- Ceccarelli S. Adaptation to low/high input cultivation. Euphytica. 1996;92:203–214. [Google Scholar]
- Clark LJ, Whalley WR, Leigh RA, Dexter AR, Barraclough PB. Evaluation of agar and agarose gels for studying mechanical impedance in rice roots. Plant and Soil. 1999;207:37–43. [Google Scholar]
- Cooper PJM, Gregory PJ, Keatinge JDH, Brown SC. Effects of fertilizer, variety and location on barley production under rainfed conditions in Northern Syria. 2. Soil water dynamics and crop water use. Field Crops Research. 1987;16:67–84. [Google Scholar]
- daSilva AP, Kay BD, Perfect E. Characterization of the least limiting water range of soils. Soil Science Society of America Journal. 1994;58:1775–1781. [Google Scholar]
- Defra. 2011 Food and Farming Statistics. Cereal and oilseed rape production. UK cereal and oilseed areas, yields and production – dataset. Downloaded 6 October 2011. http://www.defra.gov.uk/statistics/foodfarm/food/cereals/cerealsoilseed/ [Google Scholar]
- Eavis BW. Soil physical conditions affecting seedling root growth. 1. Mechanical impedance, aeration and moisture availability as influenced by bulk density and moisture levels in a sandy loam soil. Plant and Soil. 1972a;36:613–622. [Google Scholar]
- Eavis BW. Soil physical conditions affecting seedling root growth. 3. Comparisons between root growth in poorly aerated soil and at different oxygen partial pressures. Plant and Soil. 1972b;37:151–158. [Google Scholar]
- Eavis BW, Payne D. Soil physical conditions and root growth. In: Whittington WJ, editor. London: Butterworths; 1968. pp. 315–335. Root growth. Proceedings of the 15th Easter School, University of Nottingham. [Google Scholar]
- Ehlers W, Kopke U, Hesse F, Bohm W. Penetration resistance and root-growth of oats in tilled and untilled loess soil. Soil & Tillage Research. 1983;3:261–275. [Google Scholar]
- Gewin V. Food: an underground revolution. Nature. 2010;466:552–553. doi: 10.1038/466552a. [DOI] [PubMed] [Google Scholar]
- Goss MJ. Effects of mechanical impedance on root-growth in barley (Hordeum vulgare L.). 1. Effects on elongation and branching of seminal root axes. Journal of Experimental Botany. 1977;28:96–111. [Google Scholar]
- Goss MJ, Russell RS. Effects of mechanical impedance on root-growth in barley (Hordeum vulgare L.). 3. Observations on the mechanism of response. Journal of Experimental Botany. 1980;31:577–588. [Google Scholar]
- Grable AR, Siemer EG. Effects of bulk density, aggregate size, and soil water suction on oxygen diffusion, redox potential and elongation of corn roots. Soil Science Society of America Journal. 1968;32:180–186. [Google Scholar]
- Hawes C, Squire G, Hallett P, Watson C, Young M. Arable plant communities as indicators of farming practice. Agriculture Ecosystems & Environment. 2010;138:17–26. [Google Scholar]
- Karley A, Valentine T, Squire G. Dwarf alleles differentially affect barley root traits influencing nitrogen acquisition under low nutrient supply. Journal of Experimental Botany. 2011;62:3917–3927. doi: 10.1093/jxb/err089. [DOI] [PMC free article] [PubMed] [Google Scholar]
- Letey J. Relationship between soil physical properties and crop production. Advances in soil science. 1985;Vol. I:277–294. [Google Scholar]
- McKenzie B, Bengough A, Hallett P, Thomas W, Forster B, McNicol J. Deep rooting and drought screening of cereal crops: a novel field-based method and its application. Field Crops Research. 2009;112:165–171. [Google Scholar]
- Marshall TJ, Holmes JW. Soil physics. 2nd edn. Cambridge: Cambridge University Press; 1988. [Google Scholar]
- Masle J. Genetic variation in the effects of root impedance on growth and transpiration rates of wheat and barley. Australian Journal of Plant Physiology. 1992;19:109–125. [Google Scholar]
- Materechera SA, Alston AM, Kirby JM, Dexter AR. Influence of root diameter on the penetration of seminal roots into a compacted subsoil. Plant and Soil. 1992;144:297–303. [Google Scholar]
- Mirreh HF, Ketcheso JW. Influence of soil-water matric potential and resistance to penetration on corn root elongation. Canadian Journal of Soil Science. 1973;53:383–388. [Google Scholar]
- Morard P, Silvestre J. Plant injury due to oxygen deficiency in the root environment of soilless culture: a review. Plant and Soil. 1996;184:243–254. [Google Scholar]
- Palta JA, Chen X, Milroy SP, Rebetzke GJ, Dreccer MF, Watt M. Large root systems: are they usefull in adapting wheat to dry environments? Functional Plant Biology. 2011;38:347–354. doi: 10.1071/FP11031. [DOI] [PubMed] [Google Scholar]
- Perfect E, Groenevelt PH, Kay BD, Grant CD. Spatial variability of soil penetrometer measurements at the mesoscopic scale. Soil & Tillage Research. 1990;16:257–271. [Google Scholar]
- Pitman MG. Adaptation of barley roots to low oxygen supply and its relation to potassium and sodium uptake. Plant Physiology. 1969;44:1233–1240. doi: 10.1104/pp.44.9.1233. [DOI] [PMC free article] [PubMed] [Google Scholar]
- Shlens JA. A tutorial on principal component analysis. 2009 http://www.snl.salk.edu/~shlens/pca.pdf . [Google Scholar]
- Setter TL, Waters I. Review of prospects for germplasm improvement for waterlogging tolerance in wheat, barley and oats. Plant and Soil. 2003;253:1–34. [Google Scholar]
- Stalham MA, Allen EJ. Effect of variety, irrigation regime and planting date on depth, rate, duration and density of root growth in the potato (Solanum tuberosum) crop. Journal of Agricultural Science. 2001;137:251–270. [Google Scholar]
- Taylor HM, Ratliff LF. Root elongation rates of cotton and peanuts as a function of soil strength and soil water content. Soil Science. 1969;108:113–119. [Google Scholar]
- Tracy SR, Black CR, Roberts JA, Mooney SJ. Soil compaction: a review of past and present techniques for investigating effects on root growth. Journal of the Science of Food and Agriculture. 2011;91:1528–1537. doi: 10.1002/jsfa.4424. [DOI] [PubMed] [Google Scholar]
- Veen BW, Boone FR. The influence of mechanical resistance and soil-water on the growth of seminal roots of maize. Soil & Tillage Research. 1990;16:219–226. [Google Scholar]
- Warnaars BC, Eavis BW. Soil physical conditions affecting seedling root growth. 2. Mechanical impedance, aeration and moisture availability as influenced by grain-size distribution and moisture-content in silica sands. Plant and Soil. 1972;36:623–634. [Google Scholar]
- Whalley WR, Bengough AG, Dexter AR. Water stress induced by PEG decreases the maximum growth pressure of the roots of pea seedlings. Journal of Experimental Botany. 1998;49:1689–1694. [Google Scholar]
- White R, Kirkegaard J. The distribution and abundance of wheat roots in a dense, structured subsoil – implications for water uptake. Plant, Cell & Environment. 2010;33:133–148. doi: 10.1111/j.1365-3040.2009.02059.x. [DOI] [PubMed] [Google Scholar]
- Whiteley GM, Dexter AR. Root development and growth of oilseed, wheat and pea crops on tilled and non-tilled soil. Soil & Tillage Research. 1982;2:379–393. [Google Scholar]
- Whitmore AP, Whalley W. Physical effects of soil drying on roots and crop growth. Journal of Experimental Botany. 2009;60:2845–2857. doi: 10.1093/jxb/erp200. [DOI] [PubMed] [Google Scholar]
- Wilson AJ, Robards AW, Goss MJ. Effects of mechanical impedance on root-growth in barley, Hordeum vulgare L. 2. Effects on cell development in seminal roots. Journal of Experimental Botany. 1977;28:1216–1227. [Google Scholar]