Abstract
Purpose.
We identified candidate optical coherence tomography (OCT) markers for early glaucoma diagnosis. Time variation of retinal nerve fiber layer (RNFL) thickness, phase retardation, birefringence, and reflectance using polarization sensitive optical coherence tomography (PS-OCT) were measured in three non-human primates with induced glaucoma in one eye. We characterized time variation of RNFL thickness, phase retardation, birefringence, and reflectance with elevated intraocular pressure (IOP).
Methods.
One eye of each of three non-human primates was laser treated to increase IOP. Each primate was followed for a 30-week period. PS-OCT measurements were recorded at weekly intervals. Reflectance index (RI) is introduced to characterize RNFL reflectance. Associations between elevated IOP and RNFL thickness, phase retardation, birefringence, and reflectance were characterized in seven regions (entire retina, inner and outer rings, and nasal, temporal, superior and inferior quadrants) by linear and non-linear mixed-effects models.
Results.
Elevated IOP was achieved in three non-human primate eyes with an average increase of 13 mm Hg over the study period. Elevated IOP was associated with decreased RNFL thickness in the nasal region (P = 0.0002), decreased RNFL phase retardation in the superior (P = 0.046) and inferior (P = 0.021) regions, decreased RNFL birefringence in the nasal (P = 0.002) and inferior (P = 0.029) regions, and loss of RNFL reflectance in the outer rings (P = 0.018). When averaged over the entire retinal area, only RNFL reflectance showed a significant decrease (P = 0.028).
Conclusions.
Of the measured parameters, decreased RNFL reflectance was the most robust correlate with glaucomatous damage. Candidate cellular mechanisms are considered for decreased RNFL reflectance, including mitochondrial dysfunction and retinal ganglion cell apoptosis.
Measured time variation of retinal nerve fiber layer (RNFL) thickness, phase retardation, birefringence, and reflectance using polarization sensitive optical coherence tomography (PS-OCT) in three non-human primates with induced glaucoma in one eye over the course of 30 weeks.
Introduction
Glaucoma is an optic neuropathy characterized by the progressive death of retinal ganglion cells and loss of associated axons in the retinal nerve fiber layer (RNFL). Without early diagnosis and therapeutic intervention, glaucoma eventually results in visual field abnormalities and vision loss. Studies indicate that as many as 40% of the axons may die before the visual field is affected,1 suggesting an opportunity for the development of diagnostic tools that can prevent visual field loss in conjunction with application of neuroprotective strategies. As axons in the RNFL are lost, an associated RNFL thinning is observed.2–4
Optical coherence tomography (OCT) is an imaging modality that provides high-resolution (2–15 μm) cross-sectional images of the retina at video rate, and can quantify macroscopic changes in the optic nerve head (ONH) and RNFL. Inasmuch as previous studies have demonstrated a link between decreased RNFL thickness measured with OCT and glaucoma,3 OCT measurements of RNFL thickness have become a routine component of glaucoma screening, diagnosis, and monitoring protocols. Polarization sensitive OCT (PS-OCT) adds an additional contrast mechanism to standard OCT imaging and allows recording depth-resolved polarimetric measurements from the RNFL, including phase retardation and birefringence. Previous studies have demonstrated a link between retinal birefringence and RNFL microtubule density5,6 providing a motivation to investigate the predictive value of RNFL birefringence and phase retardation as candidate markers for early glaucoma diagnosis.
Increasing evidence has shown that mitochondrial dysfunction has a key role in a number of neurodegenerative diseases, including glaucoma.7–9 In addition, Huang et al. observed cytoskeletal changes in response to elevated IOP that may precede RNFL thinning.10 Because mitochondria and the cytoskeleton contribute to light scattering, RNFL reflectance was measured in an attempt to monitor these features and related structural changes during glaucoma progression.11
To identify candidate markers for early glaucoma diagnosis, we constructed a PS-OCT system to measure RNFL thickness, phase retardation, birefringence, and reflectance through the course of glaucoma progression in three non-human primates.
Methods
Experimental Procedures
PS-OCT measurements were acquired in three macaque primates: two Cynomolgus monkeys (Macaca fascicularis), and one Rhesus macaque (Macaca mulatta). Using an established protocol,12–14 one eye of each primate was treated with an argon laser (488 and 514 nm) targeting the trabecular meshwork to induce an intraocular pressure (IOP) increase, while the fellow eye was left untreated and served as a control. The three primates were followed for a period of 30 weeks during which weekly or biweekly PS-OCT imaging of the retina was performed to assess RNFL changes associated with elevated IOP. All studies reported were done under the direction of The University of Texas Institutional Animal Care and Use Committee, and followed an approved protocol (#08013001), ensuring conformance with the ARVO Statement for the Use of Animals in Ophthalmic and Vision Research.
Glaucoma Induction
To induce a sustained IOP increase and induce glaucoma, we followed an animal model described first in 197412 and used in many subsequent animal model glaucoma studies.3,13,14 Photocoagulation is an accepted treatment option for open-angle glaucoma to lower the IOP. A similar procedure is followed for glaucoma induction, except a higher laser power is delivered and a more complete circumference of the eye is photocoagulated with the laser radiation, causing trabecular meshwork scarring and reduced fluid outflow capacity resulting in a sustained IOP increase.
For trabeculoplasty, the primates were anesthetized using aqueous telezol (4 mg/kg) intramuscularly and a ketamine (10 mg/kg) booster as needed. Topical anesthetic (proparacaine hydrochloride) was applied before trabeculoplasty. A pediatric goniolens was inserted between the lids, with a canthotomy being necessary in two of the eyes. The primates were placed in a prone position with the head facing forward and strapped against the headrest of a slit-lamp (Coherent 930 argon laser with Zeiss slit-lamp; Coherent, Santa Clara, CA). A series of 200 argon laser pulses (50 μm, 1 W, 0.5 seconds) were delivered to the complete trabecular meshwork. Postoperatively, 0.2 mg Celestone was administered subconjunctivally to control inflammation. For this study, trabeculoplasty was done in the right eye (OD) in each of the three primates and the left eye (OS) was left untreated as a control. A sustained IOP increase was induced in all of the treated eyes. Primate 1 required two treatments and primate 3 required four repeated treatments (Fig. 1) to induce a sustained IOP increase.
Figure 1. .
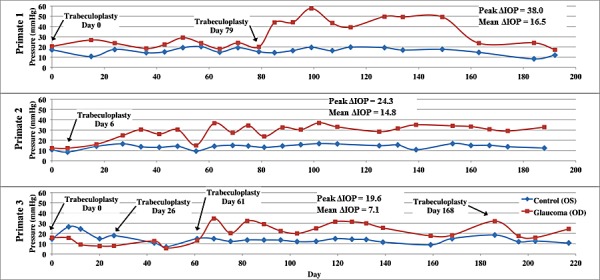
IOP versus time in control (blue) and treated (red) eyes of each primate over course of the study. Peak ΔIOP values and mean ΔIOP values are included on the graphs for each primate.
PS-OCT System Description
The PS-OCT system was similar to that described previously,15 except that free-space optical components were used rather than optical fiber (see system diagram in the Supplemental Material, http://www.iovs.org/content/53/8/4380/suppl/DC1). Briefly, the PS-OCT system uses a 1.06 μm center wavelength swept laser source (Santec, HSL 1000) with an axial resolution of 12 μm and lateral resolution of 25 μm. Average incident power on the primate cornea was 1.13 mW. The PS-OCT system was a custom-built tabletop research instrument constructed for the purpose of our study. Polarization sensitivity was provided by positioning an electro-optic phase modulator (New Focus, Santa Clara, CA) in the interferometer source path to control the polarization state of light input into the interferometer. Polarization diverse detection was achieved with a polarizing beam splitter and separate detectors for the two orthogonal polarization channels. The phase modulator provided three sequential input polarization states incident on the primate's eye separated by 120 degrees on the Poincare sphere.16
Imaging Procedures
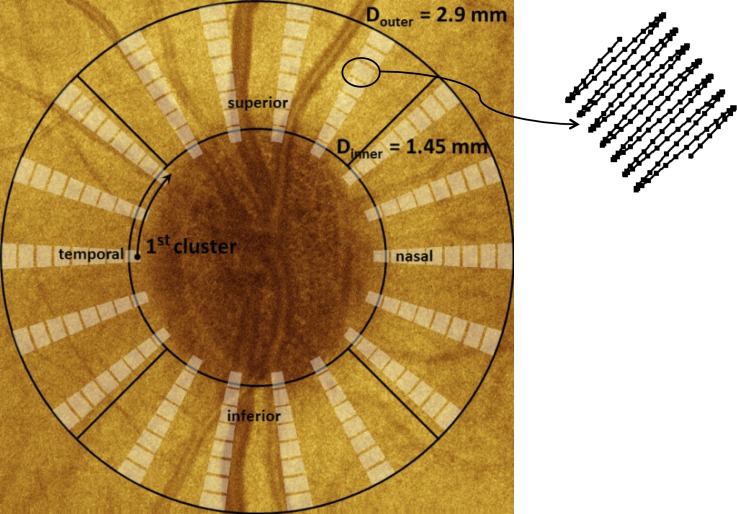
Two scan patterns were used to record images of the primate RNFL. Reflectance index (RI) and RNFL thickness parameters determined from continuous ring scan measurements were sampled continuously throughout the measured region while the clustered scan measurements were sampled in small regions around a central location. Continuous ring scan images were recorded to provide a fundus image and blood vessel map to register images acquired on different dates. Continuous ring scan images consisted of 100 B-scans, each comprised of 360 A-scans at a fixed radial distance from the ONH. Successive A-scans were separated by 1 degree and successive B-scans were spaced radially by 15 μm. Clustered ring scan images were recorded to provide the polarimetric data required to deduce RNFL birefringence and phase retardation. Clustered ring scans consisted of 8 circumferential retinal B-scans at a fixed radial distance from the ONH (Fig. 2). Each of these B-scans contained 18 evenly spaced clusters, each consisting of 200 A-scans recorded over a sine wave pattern with 10 μm A-scan spacing. Before each imaging session, an IOP measurement was performed with a Tono-Pen VET (Reichert, Depew, NY).
Figure 2. .
Schematic showing clustered imaging regions overlaid on a fundus image with marked quadrants. Sampling within a cluster is shown at the upper right. The clustered pattern collects 200 A-scans over a small region; these A-scans are averaged to reduce noise in estimates of the polarization parameters.
ONH Placement
The imaging procedure required mechanically stabilizing the primate's head and eyes. Just before recording images, each primate was positioned supine for alignment with the PS-OCT scanning optics. The primate's head was mounted in a cushioned cradle and maintained in a stable position using a custom rubber mask that was fitted around the nose and mouth to allow interface with anesthesia apparatus. The mask was attached to the cradle to hold the head securely. The entire fixture, including the primate's head, could be translated laterally over a distance of approximately 25 mm to allow positioning of the pupil in line with the PS-OCT scanning optics. Orthogonal goniometers permitted rotation of the primate's head and allowed for the ONH head to be centered in the scan range of the PS-OCT imaging beam. Temporary sutures were inserted at the limbus on the nasal and temporal sides of the eye to prevent eye motion. These sutures were placed gently under tension and affixed to the stationary face mask. The pupils were dilated before imaging using 1% tropicamide to maximize light throughput to the retina. A drop of 10% methylcellulose was placed on the cornea, and a custom spherical PMMA 8.4 mm diameter contact lens was placed on the eye to neutralize refractive error in each primate eye. The lens curvature was 6.2 mm with powers ranging from +3 to −5 diopters.
During the initial alignment process, the PS-OCT imaging system was continually cycling a rectangular raster scan pattern and updating a fundus image for visualization, alignment, and centering of the optic nerve head. This fundus image, similar to that provided by a standard ophthalmoscope, was displayed in real time by summing pixels along the axial direction.
RNFL Thickness Measurements
During post-processing of recorded PS-OCT data, the RNFL was segmented automatically in continuous and clustered ring scan images as described previously.17 A-scans in each cluster were averaged to reduce speckle noise, with the assumption that RNFL boundaries are changing slowly in each small cluster. A thresholding procedure was applied on these averaged A-scans to provide an initial guess of the vitreous-RNFL boundary location. The automatically detected RNFL boundaries then were inspected manually to ensure that the initial guess was correct. The region between the detected boundaries was segmented, taken as the RNFL, and used to calculate phase retardation (see Polarimetric Data Analysis section below). For clustered ring scan data, RNFL boundaries were varied iteratively and the phase retardation re-calculated until uncertainty of the phase retardation was minimized. For clustered ring scan data, selected RNFL boundaries corresponded to minimum uncertainty of RNFL phase retardation.
Polarimetric Data Analysis
Inasmuch as interferometric imaging techniques suffer from speckle noise, A-scan averaging is necessary to obtain reliable estimates of RNFL phase retardation and birefringence. To determine estimates of RNFL phase retardation and birefringence, 200 A-scans in a clustered region were averaged to obtain an accurate estimate of phase retardation using a numerical algorithm described previously.16,18 The Stokes vectors for each of the three input polarization states were calculated from the two collected polarization channels. Stokes vectors were computed in the segmented region between the upper and lower RNFL boundaries. In birefringent materials, such as the RNFL, the Stokes vectors of increasing depths traced arcs on the Poincare sphere where the subtended angle of the arcs is the double-pass phase retardation. A non-linear Levenberg-Marquardt algorithm estimated nine parameters by fitting simultaneously the three arcs on the Poincare sphere representing the polarization state of light reflected from the RNFL. The nine parameters returned by the Levenberg-Marquardt algorithm included the birefringence (1), optical axis orientation (2), and two parameters for each of the three initial polarization states (6 = 3 × 2). This calculation, performed for each cluster (Fig. 2 on previous page) allows construction of birefringence and phase retardation maps around the ONH.
Each clustered map for each eye was registered rotationally and laterally using blood vessel maps acquired in continuous ring scan images immediately before recording clustered scans. Because the imaging areas on subsequent days did not overlap precisely, some clusters were excluded during the registration process. In addition, exclusion criteria were applied to screen clustered data for further processing. Exclusion criteria were RNFL thickness less than 15 μm, relative uncertainty in RNFL birefringence (Δn/n) greater than 0.2, absolute uncertainty of RNFL birefringence greater than 30 degrees/100 μm, or RNFL not identifiable. Data sets with high birefringence uncertainty typically were clusters that contained large blood vessels.
RNFL Reflectance
To quantify RNFL reflectance, we define an RNFL RI (RI, equation 1) as the ratio of OCT intensities of the RNFL (IRNFL) to that of a thin layer about the retinal pigment epithelium (RPE), and containing small volumes of the photoreceptor outer segment and superficial choroid (IRPE). By referencing light reflected from the RNFL to a common structural layer in the retina (RPE), this RI definition normalizes variation due to system performance and corneal transmission. For example, because elevated IOP may be correlated with increased corneal cloudiness, reducing light intensity incident on the retina, our definition of RI (equation 1) mitigates the effect of corneal transmission variation. Variations in refractive power over the time course of the study (30 weeks) were minimized by optimizing the OCT image at the start of each imaging session by selecting a contact lens from a customized set to optimize focus of OCT light on the RNFL.
For each B-scan in continuous ring scan images, the RNFL was identified with an automatic boundary detection technique (similar to that applied to clustered ring scan data but lacking optimization using phase retardation) and the average RNFL brightness over the thickness was determined. For IRPE, an anterior boundary at the IOS was identified automatically in the B-scan images. Similarly, a posterior boundary was taken to be 10 pixels (∼75 μm) below the anterior boundary. This segmented RPE region is larger than necessary to capture fully the brightest reflecting region that is not in the RNFL in the retina. Although segmenting the anterior boundary at the Bruch's membrane is preferred, the limited axial resolution in this PS-OCT system and reliance on automated edge detection did not allow Bruch's membrane to be segmented consistently. Instead, a fixed thickness for the RPE region was taken. Average brightness value between these two boundaries (Fig. 3, blue) gave IRPE. We define RI for one A-scan in one B-scan image (either continuous or clustered ring scan data) corresponding to one image collection session as:
 |
where for a continuous ring scan,
 |
which is the average OCT signal intensity in the RNFL for the ath A-scan, where NRNFL is the pixel thickness of the RNFL. For a clustered ring scan,
 |
which is the average OCT signal intensity in the RNFL for all A-scans of the cth cluster, with Nc A-scans per cluster. For continuous and clustered ring scan data,
 |
which is the average OCT signal intensity in a layer about the RPE, and including small volumes of the inner and outer segment (IOS), and superficial choroid averaged over all B-scans in one image collection, where Nb is number of B-scans in each image collection, and NRPE is number of pixels (10) in the layer about the RPE. For continuous and clustered ring scans, we calculated RI for A-scans in one retinal scan and then constructed an RI map for that scan.
Figure 3. .
Segmented layers to determine RI (equation 1). RNFL (yellow) and RPE (blue, including small volumes of inner and outer segment and superficial choroid) in a retinal B-scan image.
IOP Damage Integral
Because the procedure for inducing glaucoma provides a variable IOP increase, the number of days after glaucoma induction is not a representative measure of RNFL damage in response to elevated IOP and may result in artifacts between primates. For this reason, the integral over time of the IOP pressure difference between treated and control eyes (treated less control) was used to calculate the IOP damage integral at day d:
 |
where TR is the treated eye (OD) and CT is the control eye (OS), and IOP is measured in mm Hg and time (t) in days. Variation of RNFL thickness, phase retardation, birefringence, and RI were analyzed versus IOP damage integral and days (d) after glaucoma induction. For all primates the lower limit of the IOP damage integral (equation 5) corresponded to when the first trabeculoplasty was performed (day zero for primates 1 and 3, and day six for primate 2). Mean IOP was calculated by dividing the IOP damage integral by the number of days.
Statistical Analysis
Linear and nonlinear mixed-effects models were applied to analyze RNFL thickness, phase retardation, birefringence, and RI data recorded in our study. Mixed-effect models allow for the variation between different subjects enrolled in the study. Application of linear and nonlinear mixed-effects models provides a number of advantages, including capturing the similarities between as well as the variance among different primates enrolled in the study, and effective analysis of longitudinal, repeated-data measurements as recorded herein. The R statistical programming language (v2.13.10 07/08/2011; http://www.R-project.org/, R Development Core Team, 2011, R Foundation for Statistical Computing, Vienna, Austria) and R studio (v0.94, 06/15/2011, RStudio, Inc.) was used to implement linear mixed-effects models. The non-linear mixed-effects model was implemented using MATLAB (The Mathworks, Natick, MA).
Continuous and clustered ring scan images of each primate retina recorded at different dates were registered against a baseline blood vessel raster scan image to ensure co-registration and alignment. We calculated averages for RNFL thickness, phase retardation, birefringence, and RI for each primate eye corresponding to all rings, four inner rings, four outer rings, and superior, inferior, nasal, and temporal quadrants. Each RNFL parameter for control and treated eyes was plotted against time (number of days, d) after administration of the first laser treatment for each primate. Linear mixed effects models were used to evaluate whether optical parameters changed over time:
 |
where Pi,d is the value of parameter P (e.g., RNFL thickness, phase retardation, birefringence, or RI) of either the control or treated eye of the ith primate on day d. The baseline intercept a1 and the mean slope (a2) for number of days (d) after laser treatment are fixed effects. The random effect is the variability from the baseline intercept for the ith primate, bi, which normally is distributed with zero-mean and SD δ. Ei,d is the random error component for the control eye or treated eye of the ith primate on day d and is assumed to be distributed normally with a zero-mean and SDδE. For equations 6 and 7 below, a fixed slope is assumed. In a sample set with few subjects such as this, a linear mixed effects model cannot converge to a solution with multiple random parameters. The random slope model is preferred because a similar effect for all the subjects is assumed with a random starting point for each subject. Variability of slopes among different primates is provided by including individual fits for each primate.
The difference in each RNFL parameter (Pdifi,d) between the control and treated eyes on each day was plotted against the IOP damage integral. The data were fit with a linear mixed effects model (equation 6) to identify statistically significant trends:
 |
where Pdifi,d is the difference of the P'th RNFL parameter (RNFL thickness, phase retardation, birefringence, and RI) between the control and treated eye for the ith primate on day d. IOPintdifi,d is the IOP damage integral for the ith primate on day d. The fixed effects are the intercept γ0 and the mean slope γ1 for the IOP damage integral. The random effect is the variability from the baseline intercept for the ith primate, βi, which normally is distributed with mean zero and SDδi. ξi,d is the random error component for the ith primate on day d, and is assumed to be distributed normally with a mean of zero and SDδ.
Based on qualitative observation of the data distribution and the fact that most damage processes can be fit with an exponential model,19 we also fit our data to a nonlinear mixed effects model, such that:
 |
where Pdifi,d is the difference of the P'th RNFL parameter between control and treated eyes for the ith primate on day d. IOPintdifi,d is the IOP damage integral for the ith primate on day d. Fixed effects include the intercept α0, the coefficient α1 for the exponential of IOP damage integral, and lifetime τ. The random effect is the variability from the baseline intercept for the ith primate, ηi, which normally is distributed with zero-mean and SDδi. εi,d is the random error component for the ith primate on day d, and is assumed to be distributed normally with a mean of zero and SDδe. We use the Akaike information criterion (AIC) and the Bayesian information criterion (BIC) to compare the goodness-of-fit of the non-linear and linear models.
Results
Elevated IOP
IOP and PS-OCT data were recorded from six eyes in three primates in our experiment, including three control and three treated eyes. A moderate IOP increase was observed in each of the treated eyes (Fig. 1) during the course of our study with an average IOP elevation of 13 mm Hg The protocol used gave a more moderate IOP elevation compared to a similar study3 directed to detect a decreased RNFL thickness. The IOP damage integral for primate 3 was negative initially because of iritis resulting from the initial trabeculoplasty.
Table. .
RNFL Parameter Differences (Control Less Treated) in Segmented Regions versus IOP Damage Integral for All Primates Analyzed with a Linear Mixed Effects Model
|
RNFL Parameter |
Region |
Slope |
P
(Slope) |
| Clustered thickness (μm) | All rings | −4.52 × 10⁻⁴ | 0.789 |
| Inner ring | −2.47 × 10⁻³ | 0.274 | |
| Outer ring | 2.16 × 10⁻⁴ | 0.891 | |
| Superior | 4.81 × 10⁻³ | 0.129 | |
| Inferior | 2.75 × 10⁻³ | 0.462 | |
| Nasal | −6.83 × 10⁻³ | 0.000 | |
| Temporal | 4.39 × 10⁻³ | 0.186 | |
| Continuous thickness (μm) | All rings | 1.07 × 10⁻³ | 0.511 |
| Inner ring | 9.30 × 10⁻⁴ | 0.647 | |
| Outer ring | 1.27 × 10⁻³ | 0.409 | |
| Superior | 2.36 × 10⁻³ | 0.140 | |
| Inferior | 3.22 × 10⁻³ | 0.342 | |
| Nasal | 1.88 × 10⁻³ | 0.278 | |
| Temporal | −3.06 × 10⁻³ | 0.058 | |
| Phase (°) | All rings | 1.76 × 10⁻⁴ | 0.698 |
| Inner ring | 2.34 × 10⁻⁴ | 0.729 | |
| Outer ring | −1.21 × 10⁻⁴ | 0.772 | |
| Superior | 1.38 × 10⁻³ | 0.046 | |
| Inferior | −1.70 × 10⁻³ | 0.021 | |
| Nasal | 3.83 × 10⁻⁴ | 0.502 | |
| Temporal | 3.29 × 10⁻⁴ | 0.701 | |
| Birefringence (°/μm) | All rings | 4.12 × 10⁻⁹ | 0.820 |
| Inner ring | 1.77 × 10⁻⁸ | 0.440 | |
| Outer ring | −1.23 × 10⁻⁸ | 0.597 | |
| Superior | 2.02 × 10⁻⁸ | 0.279 | |
| Inferior | −7.28 × 10⁻⁸ | 0.002 | |
| Nasal | 6.27 × 10⁻⁸ | 0.029 | |
| Temporal | −1.05 × 10⁻⁷ | 0.195 | |
| Clustered RI | All rings | 5.93 × 10⁻⁵ | 0.038 |
| Inner ring | 6.30 × 10⁻⁵ | 0.053 | |
| Outer ring | 5.98 × 10⁻⁵ | 0.043 | |
| Superior | 4.99 × 10⁻⁵ | 0.091 | |
| Inferior | 5.55 × 10⁻⁵ | 0.058 | |
| Nasal | 7.22 × 10⁻⁵ | 0.016 | |
| Temporal | 6.77 × 10⁻⁵ | 0.023 | |
| Continuous RI | All rings | 5.23 × 10⁻⁵ | 0.028 |
| Inner ring | 4.89 × 10⁻⁵ | 0.054 | |
| Outer ring | 5.58 × 10⁻⁵ | 0.018 | |
| Superior | 5.39 × 10⁻⁵ | 0.061 | |
| Inferior | 8.89 × 10⁻⁵ | 0.014 | |
| Nasal | 6.36 × 10⁻⁵ | 0.021 | |
| Temporal | 8.42 × 10⁻⁶ | 0.783 |
values with values < 0.05 have been marked in bold italic to identify easily the regions of statistical significance.
Temporal Variation of RNFL Parameters
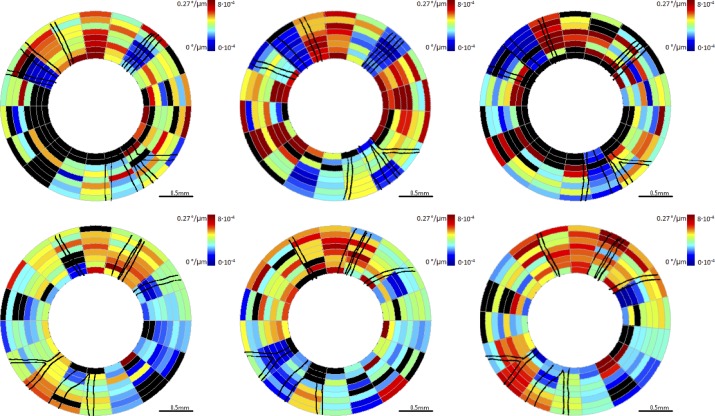
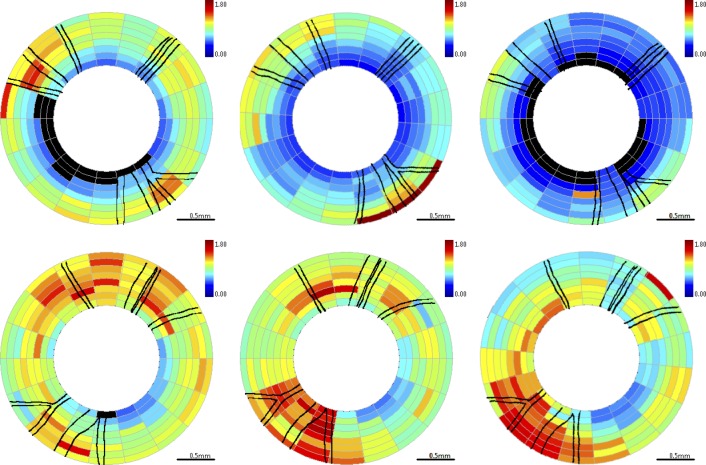
We measured four parameters from the clustered retinal scans: RNFL thickness, phase retardation, birefringence, and RI. Similar to clustered data, we measured two parameters, RNFL thickness and RI, from continuous ring scans. RNFL thickness and RI determined from clustered and continuous ring scans give similar but slightly different results. Retinal maps showing parameter values in control and treated eyes are generated for beginning (day 27), middle (day 81), and end (day 174) time points (Figs. 4–8). In birefringence maps, values are reported in units of phase retardation per unit depth (°/μm) and unitless birefringence:
 |
where λo is the central wavelength (1060 nm), PR is single pass phase retardation (°), and Δz is the RNFL thickness (μm).
Figure 4. .
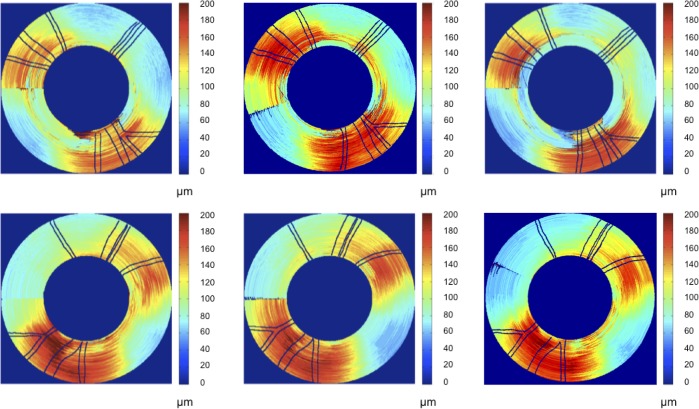
RNFL thickness maps for continuous ring scans for primate 2. Top row is OD (treated eye) and bottom row is OS (control eye). Time points correspond to beginning (left column, day 27), middle (center column, day 81), and end (right column, day 174) of the study. Blood vessels indicated by black lines.
Figure 8. .
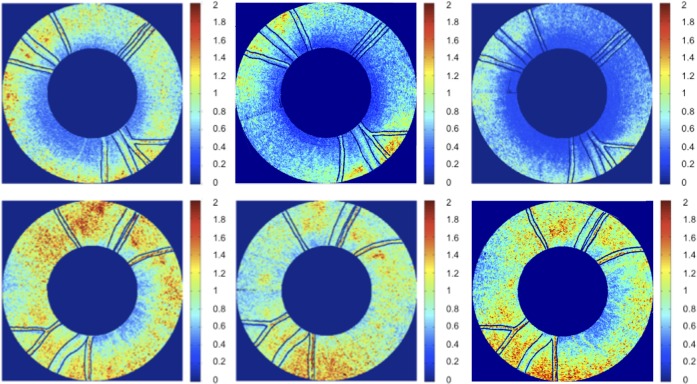
RNFL RI (RI) maps for continuous ring scans for primate 2. Top is OD (treated eye) and bottom is OS (control eye). Time points correspond to beginning (left, day 27), middle (center, day 81), and end (right, day 174) of the study. Blood vessels indicated by black lines.
Figure 5. .
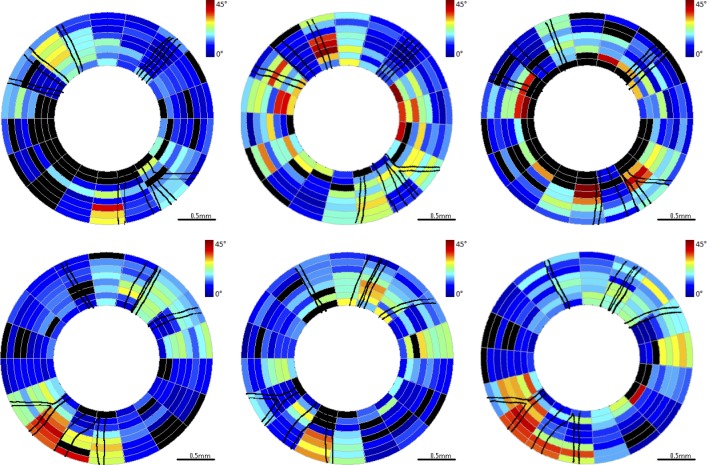
RNFL phase retardation maps for clustered retinal scans for primate 2. Top row is OD (treated eye) and bottom row is OS (control eye). Time points correspond to beginning (left column, day 27), middle (center column, day 81), and end (right column, day 174) of the study. Blood vessels indicated by black lines. Excluded clusters are marked black.
Figure 6. .
RNFL birefringence maps for clustered retinal scans for primate 2. Top row is OD (treated eye) and bottom row is OS (control eye). Time points correspond to beginning (left column, day 27), middle (center column, day 81), and end (right column, day 174) of the study. The color scale is notated both unitless birefringence and phase retardation per unit depth (°/μm). Blood vessels are indicated by black lines. Excluded clusters are marked black.
Figure 7. .
RNFL RI (RI) maps for clustered retinal scans for primate 2. Top row is OD (treated eye) and bottom row is OS (control eye). Time points correspond to beginning (left column, day 27), middle (center column, day 81), and end (right column, day 174) of the study. Blood vessels indicated by black lines. Excluded clusters are marked black.
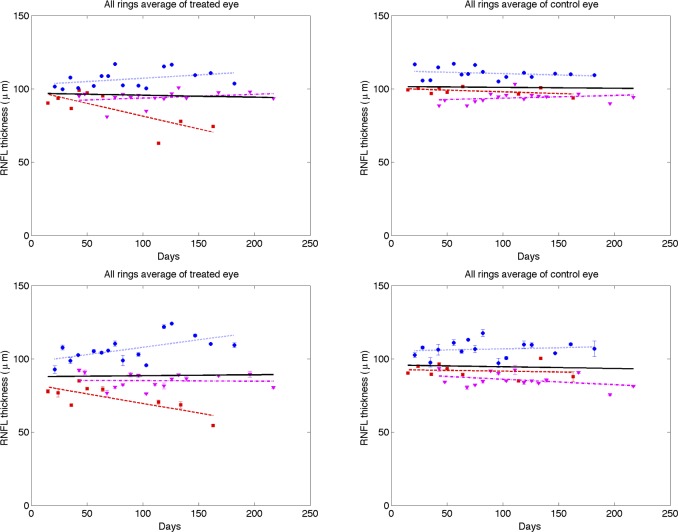
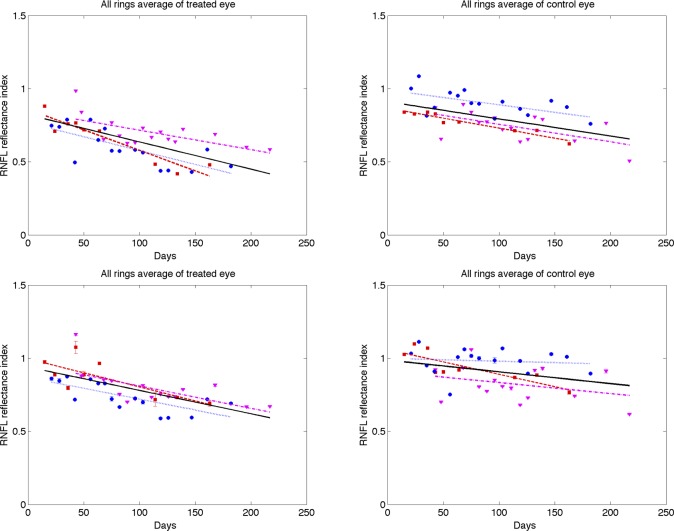
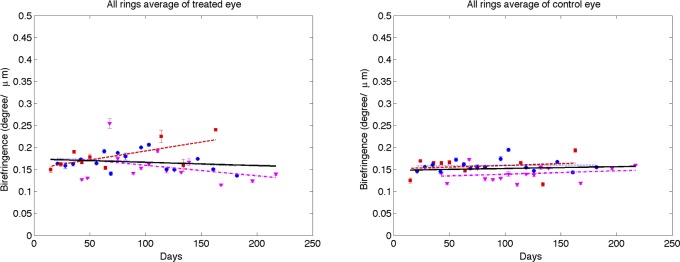
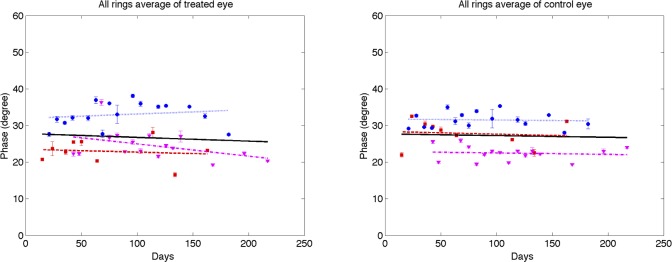
Each parameter (RNFL thickness, phase retardation, birefringence, and RI) averaged over the entire ring scan is plotted against number of days from the first laser trabeculoplasty (Figs. 9–12). A linear mixed effects model (equation 5) is applied to fit each RNFL parameter as a function of time. In clustered and continuous ring scan data, the control and treated eyes showed a significant decrease in RI. When averaged over all rings, no significant changes in RNFL thickness, birefringence, or phase retardation was observed (Figs. 9–11).
Figure 9. .
Time variation of averaged (all rings) RNFL thickness of treated (left column) and control (right column) eyes for continuous (top row) and clustered (bottom row) ring scans (squares, primate 1; circles, primate 2; and triangles, primate 3). Linear mixed effects model fits for individual primates (colored lines) and combined (all primates, black). Statistics for the combined data are shown in the Supplemental Material in Table S1 and the individual fits are included in Tables S2–S4 (http://www.iovs.org/content/53/8/4380/suppl/DC1).
Figure 12. .
Time variation of averaged (all rings) RNFL reflectance index (RI) of treated (left column) and control (right column) eyes for continuous (top row) and clustered (bottom row) ring scans (squares, primate 1; circles, primate 2; and triangles, primate 3). Linear mixed effects model fits for individual primates (colored lines) and combined (all primates, black). The linear mixed model suggests RI decreased significantly over time for both treated (P < 0.0001) and control eyes (P < 0.05). Statistics for the combined data are shown in the Supplemental Material in Tables S1 and the individual fits are included in Table S2–S4 (http://www.iovs.org/content/53/8/4380/suppl/DC1).
Figure 11. .
Time variation of averaged (all rings) RNFL birefringence of treated (left) and control (right) eyes for clustered retinal scans (squares, primate 1; circles, primate 2; and triangles, primate 3). Linear mixed effects model fits for individual primates (colored lines) and combined (all primates, black). Statistics for the combined data are shown in the Supplemental Material in Table S1 and the individual fits are included in Tables S2–S4 (http://www.iovs.org/content/53/8/4380/suppl/DC1).
Figure 10. .
Time variation of averaged (all rings) RNFL phase retardation of treated (left) and control (right) eyes for clustered retinal scans (squares, primate 1; circles, primate 2; and triangles, primate 3). Linear mixed effects model fits for individual primates (colored lines) and combined (all primates, black). Statistics for the combined data are shown in the Supplemental Material in Table S1 and the individual fits are included in Tables S2–S4 (http://www.iovs.org/content/53/8/4380/suppl/DC1).
A linear mixed effects model also was used to analyze RNFL parameters in each segmented region (results available in Supplemental Material, Tables S1–S4, http://www.iovs.org/content/53/8/4380/suppl/DC1). The linear mixed-effects model analysis of all three primates combined versus number of days shows a significant RI decrease in control and treated eyes for all averaged regions, but no significant changes in RNFL thickness, birefringence, or phase retardation. The linear mixed-effects model analysis of individual primates versus number of days shows significant decrease in RI for the majority of averaged regions in the treated eye, while RNFL thickness decreases in some regions, and isolated regions show decreases in phase retardation and birefringence. In the individual results for primate 1, several groupings showed a small but significant increase in birefringence for the treated eye over the course of the study. In these regions of increased birefringence for this isolated primate, a significant increase in birefringence uncertainty was observed over the course of the study.
RNFL Parameters versus IOP Damage Integral
To evaluate change of RNFL parameters with respect to IOP exposure, we fit the difference between the control and treated eyes of RNFL parameters as a function of IOP damage integral using a linear mixed effects model. Inasmuch as significant trends might emerge in isolated regions of the eyes, retinal maps were segmented and RNFL parameters in each segment were analyzed separately in addition to parameter averages over the entire retina. RNFL parameters were computed and averaged in segmented regions, including the four inner rings, four outer rings, and superior, inferior, nasal, and temporal quadrants, and plotted over time and IOP damage integral. Fits were performed in each segmented region for all three primates combined (see Table) as well as individuals (see the Supplemental Material, Table S5, http://www.iovs.org/content/53/8/4380/suppl/DC1).
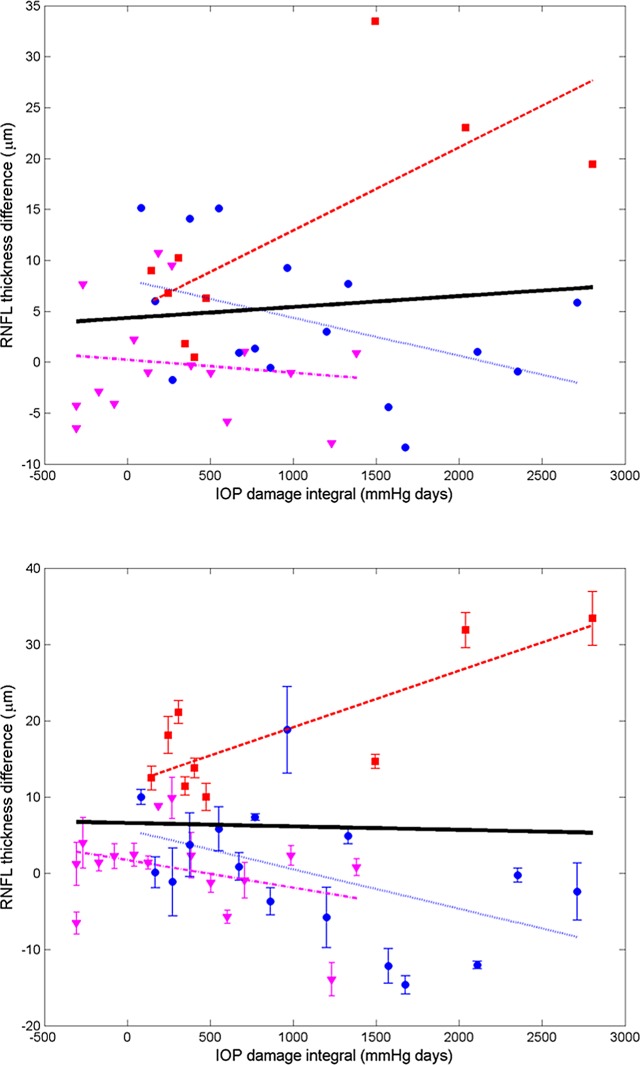
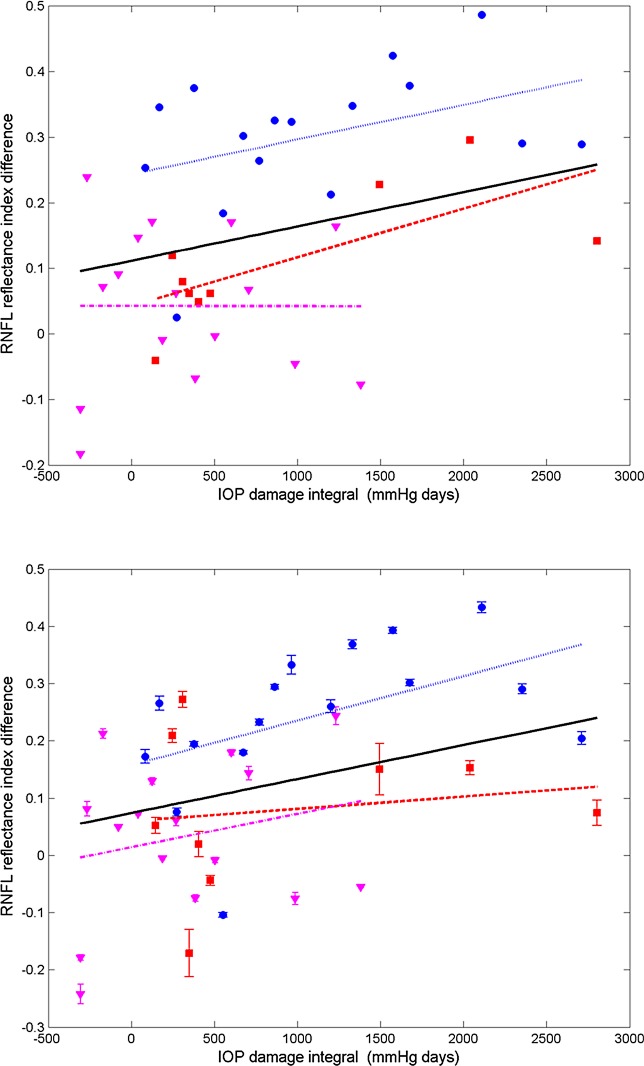
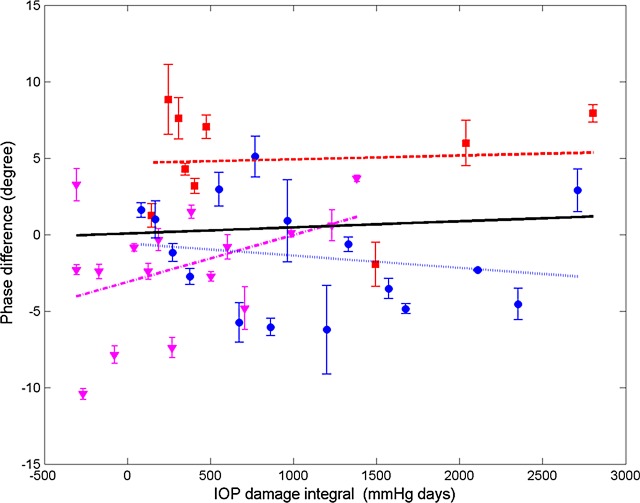
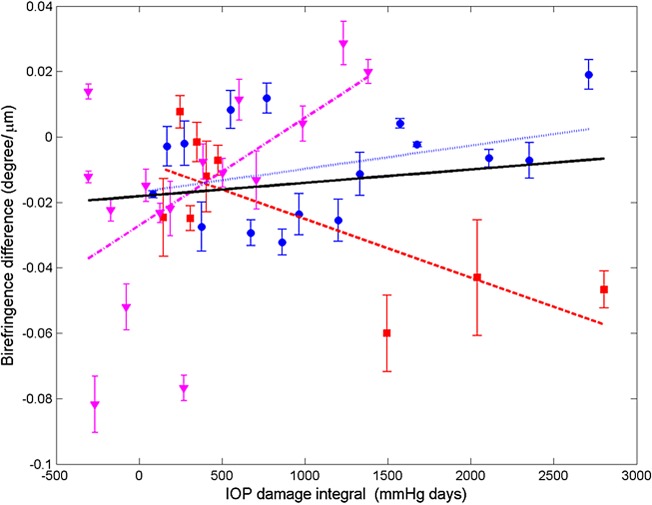
Differences in RNFL thickness, phase retardation, birefringence, and RI are plotted (Figs. 13–16) for all usable clusters with all primates combined. No significant trend was observed (P > 0.05) in the difference of RNFL thickness, phase retardation and birefringence between control and treated eyes versus IOP damage integral. For clustered and continuous ring scan data, difference between RNFL RI of control and treated eyes increased significantly when IOP damage integral increases (P < 0.05 for both).
Figure 13. .
Average (all rings) of RNFL thickness difference (control less treated) for continuous (top) and clustered (bottom) retinal scans versus IOP damage integral (squares, primate 1; circles, primate 2; and triangles, primate 3). Linear mixed model fits for individual primates (colored lines) and combined (all primates, black). Statistics for the combined data are shown in the Table and the individual fits are included in the Supplemental Material in Table S5 (http://www.iovs.org/content/53/8/4380/suppl/DC1).
Figure 16. .
Average (all rings) of RNFL RI difference (control less treated) for continuous (top) and clustered (bottom) retinal scans versus IOP damage integral (squares, primate 1; circles, primate 2; and triangles, primate 3). Linear mixed model fits for individual primates (colored lines) and combined (all primates, black). Statistics for the combined data are shown in the Table and the individual fits are included in the Supplemental Material in Table S5 (http://www.iovs.org/content/53/8/4380/suppl/DC1).
Figure 14. .
Average (all rings) of phase retardation difference (control less treated) for clustered retinal scans versus IOP damage integral (squares, primate 1; circles, primate 2; and triangles, primate 3). Linear mixed model fits for individual primates (colored lines) and combined (all primates, black). Statistics for the combined data are shown in the Table and the individual fits are included in the Supplemental Material in Table S5 (http://www.iovs.org/content/53/8/4380/suppl/DC1).
Figure 15. .
Average (all rings) of birefringence difference (control less treated) for clustered retinal scans versus IOP damage integral (squares, primate 1; circles, primate 2; and triangles, primate 3). Linear mixed model fits for individual primates (colored lines) and combined (all primates, black). Statistics for the combined data are shown in the Table and the individual fits are included in the Supplemental Material in Table S5 (http://www.iovs.org/content/53/8/4380/suppl/DC1).
Using a linear mixed effects model, RNFL parameters (thickness, phase retardation, birefringence, and RI) averaged in various segmented regions (all rings, inner rings, outer rings, and superior, inferior, nasal, and temporal quadrants) were evaluated versus the IOP damage integral (Figs. 13–16). For all RNFL thickness measurements in each segmented region, only the nasal quadrant showed a significant change. The inferior quadrant showed a significant change for RNFL phase retardation and birefringence. In addition, RNFL phase retardation had a significant change in the superior quadrant and the birefringence had a significant change in the nasal region.
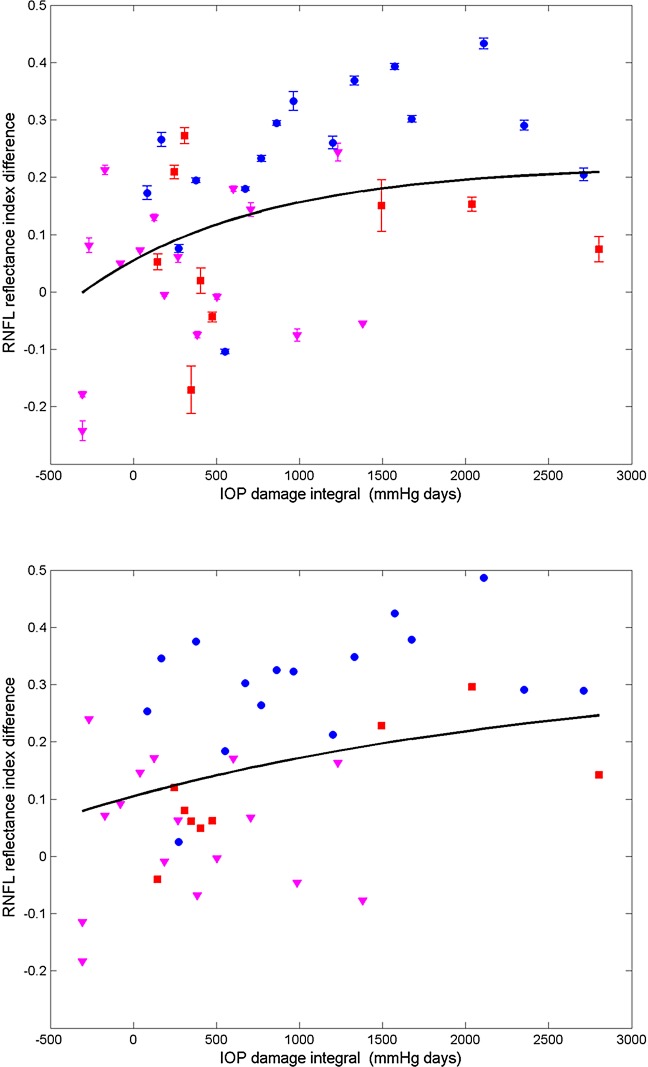
We analyzed RI versus IOP damage integral using a non-linear model (Fig. 17).20 We used the AIC and BIC to compare the goodness-of-fit of the non-linear and linear models. Because AIC and BIC values derived from the nonlinear model (clustered: AIC = −39.4, BIC = −30.8; continuous: AIC = −52.0, BIC = −43.4) are smaller than those of the linear model (clustered: AIC = −16.6, BIC = −9.9; continuous: AIC = −37.8, BIC = −31.2), we concluded that the nonlinear model provides a better fit to RI data compared to the linear model. In linear and non-linear models, the continuous scan provided a better fit than the clustered scan.
Figure 17. .
Average (all rings) of RNFLRI (RI) difference (control less treated) for clustered (top) and continuous (bottom) retinal scans versus IOP damage integral (squares, primate 1; circles, primate 2; and triangles, primate 3). Nonlinear mixed effects model fits (black curves) for clustered (τ = 1060.4, AIC = −39.4, BIC = −30.8) and continuous (τ = 2848.3, AIC = −52.0, BIC = −43.4) data for all primates.
Discussion
At the outset, we note that these results are derived from a small sample of only three primates. This is a pilot study and the results, while showing statistical significance, should be treated as preliminary. The parameter in treated eyes with elevated IOP showing the most significant change was RNFL RI (RI, equation 1). Statistically significant decreases in RI were observed in some quadrants (see Table) in treated eyes. RI derived from clustered retinal scans showed statistically significant decreases with increased IOP damage integral in all-rings, outer-rings, and nasal and temporal quadrants. RI derived from continuous retinal scans showed statistically significant decreases with IOP damage integral in all-rings, outer rings, and inferior and nasal quadrants. Using the linear mixed effects model, significant changes were observed in RI versus number of days for the control and treated eyes. The rate of decrease of RI for the treated eyes (−1.60 × 10⁻³ days−1) was about two times greater than that observed in the control eyes (−0.80 × 10⁻³ days−1). Prolonged and frequent anesthesia of the three primates enrolled in these studies may have contributed to decreased RI in the control eyes. Interestingly, neural mitochondrial changes have been observed in rodents subjected to prolonged anesthesia exposure.21 As discussed below, mitochondrial changes can impact optical scattering properties of the host cell. Consequently, mitochondrial changes due to prolonged anesthesia exposure may have contributed to RI decrease observed in control and treated eyes. Phase retardation and birefringence changes were detected in the course of our study only in the inferior quadrant (see Table) and may be considered as candidate markers for early glaucoma diagnosis in subsequent investigations.
RNFL Thickness Changes
Schuman et al. observed RNFL thinning as a result of elevated IOP with a similar level of IOP integral.3 In our study, although RNFL changes were observed in individual measurements (Fig. 4 top row), statistically significant RNFL thinning over the course of the study was observed only in the nasal region (the thinnest RNFL region) using the clustered thickness data (see Table). Considering the lower values of average IOP used in our study (13 mm Hg) compared to those used by Schuman et al. (∼25 mm Hg),3 absence of significant RNFL thinning may not be unexpected even considering a similar IOP integral. The IOP integral is a linear damage model with poorly understood limitations. The IOP integral and the ΔIOP are important parameters in predicting glaucoma damage. Chauhan et al. investigated the effect of elevated IOP in rodents, and found a strong correlation of functional and structural changes to peak IOP, suggesting a damage threshold.22 Although Schuman doesn't report the peak IOP values for individual primates enrolled in his study,3 values are assumed to be much higher considering the study had a shorter duration to reach similar IOP integral values. In this sense, absence of significant RNFL thinning in all regions can be viewed as complementary, not contradictory to previous studies.
Candidate Cellular Mechanisms
To our knowledge, this is not the first study to report reflectance changes in the retina; however, we believe it is the first reported definition of reflectance change observed with OCT and the first report that RNFL reflectance decreases when glaucoma is induced in primates.11,23 Although additional investigation is necessary to test candidate mechanisms for RNFL reflectance decrease observed here, changes in the mitochondrial networks and axonal cytoskeleton changes are hypothetical mechanisms. Previous studies have demonstrated that changes in mitochondrial membrane permeability in response to elevated IOP precede retinal ganglion cell loss in glaucomatous eyes.9,24
Mitochondrial dysfunction is recognized as an important component in the etiology of many neurodegenerative pathologies, including amyotrophic lateral sclerosis, and Alzheimer's and Parkinson's diseases. Mitochondria are recognized as dynamic organelles that constantly undergo fusion and fission processes, which are required to maintain normal function of the host cell. Fusion of mitochondria to form interconnected intracellular networks is believed to be a necessary component to maintain a mitochondrial population with a full complement of gene products that can mitigate age-related degeneration. In fact, autosomal dominant optic atrophy, the leading cause of childhood blindness, is caused by a mutation in the mitochondrial fusion gene OPA1.25 Inasmuch as mitochondrial changes are an important component of neurodegenerative diseases, their potential contribution to RNFL reflectance changes is of interest.
Recently, Ju et al. demonstrated that mitochondria fission in differentiated retinal ganglion cell cultures is induced in response to elevated hydrostatic pressures.8 A number of recent studies have observed optical scattering changes in cells undergoing apoptosis that originate at least in part from the mitochondria. Pasternack et al. used a Fourier microscopy approach to demonstrate that early cell apoptosis is accompanied by mitochondrial fission and fragmentation that results in more isotropic or large-angle light scattering.26 Chalut et al. used angle-resolved OCT to document similar scattering changes that they suggested may involve mitochondrial fission.27 A number of investigators recently have applied OCT to document light scattering changes in cells undergoing apoptosis or necrosis.28,29 Although the decrease in RI in glaucomatous primate eyes reported in our study is consistent with reduced collected backscatter due to intensified mitochondrial fission resulting in increased large angle scattering, other mechanisms, such as changes in the axonal membrane or microtubules, may contribute to the observed decrease in RNFL reflectance. Additional studies are required to isolate and characterize better the various candidate cellular processes that may contribute to decreased RNFL reflectance observed in our study.
Supplementary Material
Acknowledgments
Nate Marti provided statistical consultation and analysis in the preparation of this article. The staff of The University of Texas at Austin Animal Resource Center, especially Jennifer Cassidy and Kathryn Starr, provided invaluable contributions to the success of the animal study.
Footnotes
Supported by National Institutes of Health Grant R01EY016462.
Disclosure: J. Dwelle, None; S. Liu, None; B. Wang, None; A. McElroy, None; D. Ho, None; M.K. Markey, None; T. Milner, None; H.G. Rylander III, None
References
- 1. Quigley H, Addicks E, Green W. Optic nerve damage in human glaucoma: quantitative correlation of nerve fiber loss and visual field defect in glaucoma, ischemic neuropathy, papilledema, and toxic neuropathy. Arch Ophthalmol. 1982;100:135–146 [DOI] [PubMed] [Google Scholar]
- 2. Shimazawa M, Tomita G, Taniguchi T, et al. Morphometric evaluation of changes with time in optic disc structure and thickness of retinal nerve fibre layer in chronic ocular hypertensive monkeys. Exp Eye Res. 2006;82:427–440 [DOI] [PubMed] [Google Scholar]
- 3. Schuman JS, Pedut-Kloizman T, Pakter H, et al. Optical coherence tomography and histologic measurements of nerve fiber layer thickness in normal and glaucomatous monkey eyes. Invest Ophth Visual. 2007;48:3645–3654 [DOI] [PMC free article] [PubMed] [Google Scholar]
- 4. Wollstein G, Schuman JS, Price LL, et al. Optical coherence tomography longitudinal evaluation of retinal nerve fiber layer thickness in glaucoma. Arch Ophthalmol. 2005;123:464–470 [DOI] [PMC free article] [PubMed] [Google Scholar]
- 5. Huang X-R, Knighton RW. Microtubules contribute to the birefringence of the retinal nerve fiber layer. Invest Ophthalmol Vis Sci. 2005;46:4588–4593 [DOI] [PubMed] [Google Scholar]
- 6. Pocock GM, Aranibar RG, Kemp NJ, Specht CS, Markey MK, Rylander HG., III The relationship between retinal ganglion cell axon constituents and retinal nerve fiber layer birefringence in the primate. Invest Ophthalmol Vis Sci. 2009;5238–5246 [DOI] [PMC free article] [PubMed]
- 7. Kong GYX, Van Bergen NJ, Trounce IA, Crowston JG. Mitochondrial dysfunction and glaucoma. J Glaucoma. 2009;18:93–100 [DOI] [PubMed] [Google Scholar]
- 8. Ju W-K, Liu Q, Kim K-Y, et al. Elevated hydrostatic pressure triggers mitochondrial fission and decreases cellular ATP in differentiated RGC-5 cells. Invest Ophthalmol Vis Sci. 2007;48:2145–2151 [DOI] [PubMed] [Google Scholar]
- 9. Abu-Amero KK, Morales J, Bosley TM. Mitochondrial abnormalities in patients with primary open-angle glaucoma. Invest Ophthalmol Vis Sci. 2006;47:2533–2541 [DOI] [PubMed] [Google Scholar]
- 10. Huang X, Kong W, Zhou Y, Gregori G. Distortion of axonal cytoskeleton: an early sign of glaucomatous damage. Invest Ophthalmol Vis Sci. 2011;52:2879–2888 [DOI] [PMC free article] [PubMed] [Google Scholar]
- 11. Zhang X, Hu J, Knighton RW, Huang X-R, Puliafito CA, Jiao S. Dual-band spectral-domain optical coherence tomography for in vivo imaging the spectral contrasts of the retinal nerve fiber layer. Opt Express. 2011;19:19653–19659 [DOI] [PMC free article] [PubMed] [Google Scholar]
- 12. Gaasterland D, Kupfer C. Experimental glaucoma in the Rhesus monkey. Invest Ophthalmol Vis Sci. 1974;13:455–457 [PubMed] [Google Scholar]
- 13. Pederson J, Gaasterland D. Laser-induced primate glaucoma. 1. Progression of glaucoma. Arch Ophthalmol. 1984;102:1689–1692 [DOI] [PubMed] [Google Scholar]
- 14. Quigley HA, Hohman RM. Laser energy levels for trabecular meshwork damage in the primate eye. Invest Ophth Visual. 1983;24:1305–1307 [PubMed] [Google Scholar]
- 15. Elmaanaoui B, Wang B, Dwelle JC, et al. Birefringence measurement of the retinal nerve fiber layer by swept source polarization sensitive optical coherence tomography. Opt Express. 2011;19:10252–10268 [DOI] [PMC free article] [PubMed] [Google Scholar]
- 16. Kemp NJ, Park J, Zaatari HN, Rylander HG, Milner TE. High-sensitivity determination of birefringence in turbid media with enhanced polarization-sensitive optical coherence tomography. J Opt Soc Am A. 2005;22:552–560 [DOI] [PubMed] [Google Scholar]
- 17. Wang B, Paranjape A, Yin B, et al. Optimized retinal nerve fiber layer segmentation based on optical reflectivity and birefringence for polarization-sensitive optical coherence tomography. Proc SPIE. 2011;8135:81351R [Google Scholar]
- 18. Park J, Kemp NJ, Zaatari HN, Rylander HG, III, Milner TE. Differential geometry of normalized Stokes vector trajectories in anisotropic media. J Opt Soc Am A. 2006;23:679–690 [DOI] [PubMed] [Google Scholar]
- 19. Thomsen S, Pearce JA. Thermal damage and rate processes in biologic tissues. : AC Welch, van Gemert MJC, Optical-Thermal Response of Laser-Irradiated Tissue. New York, NY: Springer Verlag; 2011:487–550 [Google Scholar]
- 20. Pinheiro J, Bates D. Mixed-Effects Models in S and S-PLUS. New York, NY: Springer Verlag; 2009. [Google Scholar]
- 21. Zhang Y, Dong Y, Wu X, et al. The mitochondrial pathway of anesthetic isoflurane-induced apoptosis. J Biol Chem. 2010;285:4025–4037 [DOI] [PMC free article] [PubMed] [Google Scholar]
- 22. Chauhan BC, Pan J, Archibald ML, LeVatte TL, Kelly MEM, Tremblay F. Effect of intraocular pressure on optic disc topography, electroretinography, and axonal loss in a chronic pressure-induced rat model of optic nerve damage. Invest Ophthalmol Vis Sci. 2002;43:2969–2976 [PubMed] [Google Scholar]
- 23. Huang X, Zhou Y, Kong W, Knighton RW. Reflectance decrease prior to thickness change of the retinal nerve fiber layer in glaucomatous retinas. Invest Ophthalmol Vis Sci. 2011;52:6737–6742 [DOI] [PMC free article] [PubMed] [Google Scholar]
- 24. Mittag TW, Danias J, Pohorenec G, et al. Retinal damage after 3 to 4 months of elevated intraocular pressure in a rat glaucoma model. Invest Ophthalmol Vis Sci. 2000;41:3451–3459 [PubMed] [Google Scholar]
- 25. Fraser J, Biousse V, Newman N. The neuro-ophthalmology of mitochondrial disease. Surv Ophthalmol. 2010;55:299–334 [DOI] [PMC free article] [PubMed] [Google Scholar]
- 26. Pasternack R, Zheng J, Boustany NN. Detection of mitochondrial fission with orientation-dependent optical Fourier filters. Cytometry A. 2010;79:137–148 [DOI] [PubMed] [Google Scholar]
- 27. Chalut K, Ostrander J, Giacomelli M, Wax A. Light scattering measurements of subcellular structure provide noninvasive early detection of chemotherapy-induced apoptosis. Cancer Res. 2009;69:1199–1204 [DOI] [PMC free article] [PubMed] [Google Scholar]
- 28. van der Meer F, Faber D, Aalders M, Poot AA, Vermes I, van Leeuwen T. Apoptosis-and necrosis-induced changes in light attenuation measured by optical coherence tomography. Lasers Med Sci. 2010;25:259–267 [DOI] [PMC free article] [PubMed] [Google Scholar]
- 29. Farhat G, Mariampillai A, Yang V, Czarnota G, Kolios M. Detecting apoptosis using dynamic light scattering with optical coherence tomography. J Biomed Opt. 2011;16:070505 [DOI] [PubMed] [Google Scholar]
Associated Data
This section collects any data citations, data availability statements, or supplementary materials included in this article.


