Abstract
Sterile inflammation is a host response to tissue injury that is mediated by damage-associated molecular patterns (DAMPs) released from dead cells. Sterile inflammation worsens damage in a number of injury paradigms. The pro-inflammatory cytokine interleukin-1α (IL-1α) is reported to be a DAMP released from dead cells, and is known to exacerbate brain injury caused by stroke. In the brain, IL-1α is produced by microglia, the resident brain macrophages. We found that IL-1α is actively trafficked to the nuclei of microglia, and hence tested the hypothesis that trafficking of IL-1α to the nucleus would inhibit its release following necrotic cell death, limiting sterile inflammation. Microglia subjected to oxygen-glucose deprivation (OGD) died via necrosis. Under these conditions, microglia expressing nuclear IL-1α released significantly less IL-1α than microglia with predominantly cytosolic IL-1α. The remaining IL-1α was immobilised in the nuclei of the dead cells. Thus, nuclear retention of IL-1α may serve to limit inflammation following cell death.
Keywords: Interleukin-1α, microglia, sterile inflammation, nuclear retention, necrosis
Introduction
Sterile inflammation is a host response to tissue injury that can exacerbate the initial insult [1]. Intracellular molecules released from necrotic cells act as damage-associated molecular patterns (DAMPs), signalling to the innate immune system that tissue injury has occurred [2]. Interleukin-1α (IL-1α), a pro-inflammatory member of the IL-1 cytokine family [3], has recently been identified as a DAMP released from necrotic cells [4]. In addition, necrotic cell DAMPs are reported to stimulate IL-1α production by immune cells, which further exacerbates sterile inflammation [1]. Experimental stroke in rodents elicits an inflammatory response that markedly exacerbates brain injury [5]. IL-1α is a key contributor to this injury, and its genetic ablation (along with IL-1β, a related cytokine) causes a 70% reduction in the brain injury caused by stroke [6].
In the brain after injury (e.g. stroke, haemorrhage, trauma), IL-1 family cytokines are produced by microglia, the resident brain macrophages [7]. IL-1α is produced in the cytosol as a 31 kDa protein that, following release from necrotic cells, activates the type I IL-1 receptor on responsive cell membranes [8;9]. The N-terminal domain of IL-1α contains a nuclear localization sequence (NLS) which mediates active nuclear import [10;11]. IL-1α has been reported to act within the nucleus to regulate cytokine transcription and RNA splicing [12;13]. In this study we sought to test the hypothesis that IL-1α nuclear import also inhibits IL-1α release following necrotic cell death. We report that IL-1α nuclear import and intranuclear retention reduce IL-1α release from necrotic microglia. Thus, IL-1α nuclear retention by necrotic cells may inhibit injury-induced inflammation.
Results
IL-1α nuclear localization is inhibited at high cell density
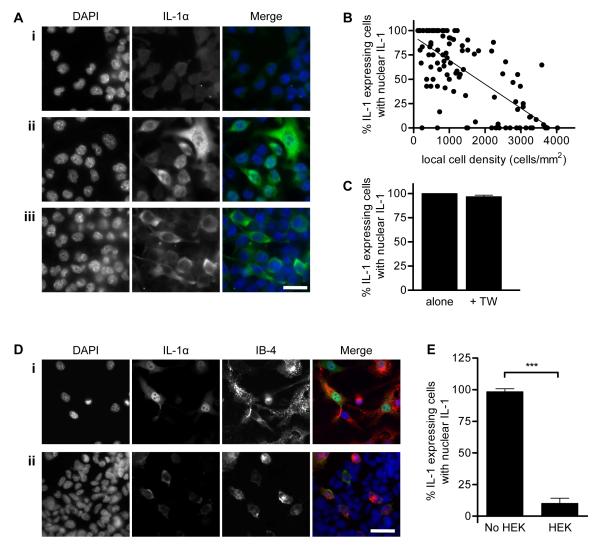
In order to investigate the effects of IL-1α nuclear localisation on IL-1α release after necrotic cell death, we set out to identify factors regulating IL-1α nuclear localisation. We have reported previously that IL-1α is located predominantly within the nucleus in both primary cultured murine microglia and BV-2 cells [a microglial cell line, [11]]. These cells were cultured at a relatively low cell density (1 × 10⁵ cells/mL). We observed that when the microglia were cultured at higher densities (3.5 - 5 × 10⁵ cells/mL) and treated with lipopolysaccharide (LPS, bacterial endotoxin, used to enhance IL-1 expression, 1 μg/mL, 6 hours) IL-1α was predominantly cytosolic (Fig 1Aiii). Local cell density varied within individual cultures, and the proportion of cells containing intranuclear IL-1α appeared to vary with cell density (e.g. compare DAPI in Fig. 1Aii vs. iii).
Figure 1. IL-1α nuclear localization in BV-2 microglia is inhibited by high local cell density.
BV-2 microglia were left untreated (Ai) or LPS-treated (Aii, iii, B-E 1 μg/mL, 6 hours), IL-1α-immunostained (green) and co-stained with DAPI (blue). The % IL-1α-expressing cells containing nuclear IL-1α in individual fields of view was quantified by blind manual cell counting (B, C, E). IL-1α was intranuclear in some microglia (Aii, low local cell density) and cytosolic in others (Aiii, high local cell density) when microglia were cultured at 3.5 - 5 × 10⁵ cells/mL. IL-1α localization was quantified in individual fields of view from microglia seeded at 0.25 - 5 × 10⁵ cells/mL, and correlated with local cell density (B). Individual points represent single fields of view, linear regression line (solid line) R2 = 0.49 p<0.0001 vs. slope of zero. IL-1α localisation was also quantified in low density microglia (1 × 10⁵ cells/mL) cultured with or without high density microglia (1 × 10⁶ cells/mL) in transwell inserts (+TW or alone respectively, C). BV-2 microglia (1 × 10⁵ cells/mL, isolectin B-4 stained, red, IB-4) were cultured alone (Di) or with HEK-293 cells (Dii). IL-1α localisation was quantified in microglia cultured with (HEK) or without (No HEK, E) HEK-293 cells. Data from n ≥ 3 independent experiments. Scale bars = 40 μm. ***p<0.0001, Student’s t-test.
On the basis of these data, we tested the initial hypothesis that nuclear localization of IL-1α is regulated by cell density. BV-2 microglia were seeded at different densities prior to LPS treatment and IL-1α immunostaining. The proportion of IL-1α-positive BV-2 cells containing intranuclear IL-1α was quantified and correlated with the local cell density in individual microscope fields of view. The proportion of IL-1α-expressing cells containing nuclear IL-1α decreased significantly as cell density increased (R2 = 0.49, p<0.0001 vs. slope of zero, Fig. 1B), confirming that nuclear localization of IL-1α in BV-2 microglia was inhibited at high cell density.
We next sought to identify which changes in the local microenvironment at high cell density were responsible for inhibiting IL-1α nuclear localisation (changes in secreted mediators, in the abundance of extracellular matrix (ECM), or in the extent of direct cell-cell contacts). Mediators released from microglia cultured at high density in a transwell insert, above microglia cultured at low density, did not affect IL-1α nuclear localization in the low density cells (Fig. 1C). IL-1α nuclear localization in low density BV-2 microglia was also unaltered when cells were cultured on laminin [part of the brain ECM, [14]] or fibronectin [extravasated after brain injury, [15], Fig. S1]. However, we found that IL-1α sub-cellular distribution was regulated by cell-contact. Co-culture of low density BV-2 microglia with a confluent HEK-293 cell monolayer (used as a source of generic non-myeloid, non-murine cells) induced a marked change in the subcellular distribution of IL-1α in BV-2 cells, from being both nuclear and cytosolic (Fig. 1Di) to being exclusively cytosolic (Fig. 1Dii). This redistribution of IL-1α occurred in the majority of BV-2 microglia (% cells with intranuclear IL-1α fell from 98 ± 2 % to 10 ± 4 %, p<0.0001, Fig. 1E). Microglial IL-1α nuclear localization was similarly inhibited by co-culture of primary murine microglia with HEK-293 cells, or with primary murine astrocytes (Fig S2). Thus, IL-1α nuclear localization in microglia is inhibited at high cell density via a generic cell contact-dependent mechanism.
Intranuclear IL-1α is retained by necrotic microglia
Since IL-1α release from necrotic cells is pro-inflammatory [4], we hypothesised that IL-1α nuclear localization represents a mechanism to inhibit IL-1α release, and so inhibit inflammation induced by necrotic cells. Thus, the reduced IL-1α nuclear localization in high density microglia would result in increased IL-1α release after necrosis. We induced microglial necrosis by oxygen-glucose deprivation (OGD), an in vitro paradigm of stroke [16].
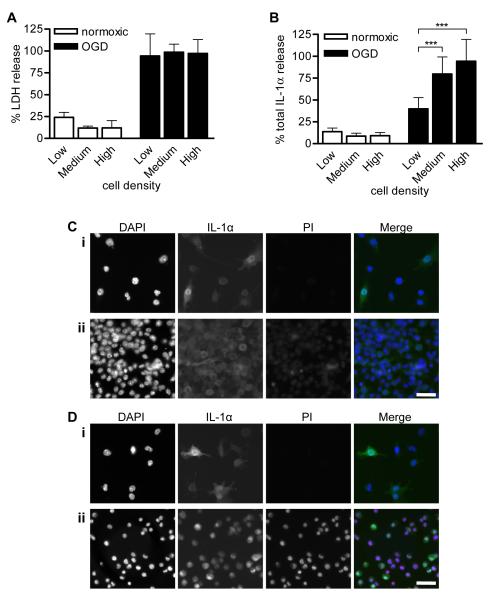
Necrosis was confirmed in >90% BV-2 microglia, by release of the cytosolic enzyme lactate dehydrogenase (LDH) from cells (Fig. 2A). Cell density had no effect on the proportion of microglia undergoing necrosis. In contrast, IL-1α release from necrotic BV-2 microglia was regulated by cell density. BV-2 microglia cultured at high density released significantly more of their IL-1α than microglia cultured at low density, where nuclear localization was greatest (Fig. 2B, 94 ± 25 % released from high density cells in comparison to 40 ± 13 %, p<0.001). Thus microglia containing nuclear IL-1α prior to a necrotic insult retain a greater proportion of their IL-1α than microglia containing only cytosolic IL-1α (Fig. 2B).
Figure 2. Intranuclear IL-1α is retained by necrotic microglia.
BV-2 microglia were seeded at low, medium or high density (1, 5 and 10 × 105 cells/mL respectively), LPS-treated (1μg/mL, 3 hours) and either kept in normoxic conditions or killed by 24 hours OGD. % total LDH (A) and IL-1α (B) release into media were quantified. Data are from n = 6 independent experiments. ***p<0.001 One-way ANOVA with post-hoc Bonferroni multiple comparison test. Remaining adherent cells in normoxia- (C) and OGD-treated (D) cultures of low density (Ci, Di) and high density BV-2 cells (Cii, Dii) were IL-1α-immunostained (green) with PI (red) and DAPI (blue) co-staining. Images are from one of n = 3 independent experiments. Scale bar = 40 μm.
In order to determine whether the IL-1α retained by necrotic microglia was intranuclear, we investigated the localization of IL-1α in the remaining adherent BV-2 microglia at the end of the experiment. Microglia were stained with propidium iodide (PI, a DNA-binding dye excluded from living cells) and immunostained for IL-1α. BV-2 microglia maintained in normoxic conditions remained alive (PI-negative) and IL-1α was predominantly intranuclear in low density cells (Fig. 2Ci) and predominantly cytosolic in high density cells (Fig. 2Cii). OGD led to the detachment of necrotic BV-2 microglia, and at low density, the only cells that remained adherent were still alive (PI-negative, Fig. 2Di), preventing investigation of IL-1α localization in the dead, detached cells. Intranuclear retention of IL-1α in these dead, detached cells presumably prevented detection in the supernatants by the IL-1α ELISA (Fig. 2B, low density OGD treated cells). In contrast, in high density microglia, some dead, PI-positive microglia remained adherent (Fig. 2Dii). Intranuclear IL-1α was detected in these dead, PI-positive cells, co-localizing with both PI and DAPI. Since IL-1α is normally cytosolic in these cells (Fig. 2Cii), IL-1α nuclear import must have occurred during the OGD insult. This may be the result of a gradual loss of cell-cell contacts as necrotic cells detached. This represents a new mechanism that may reduce IL-1α-induced sterile inflammation after necrotic cell death.
IL-1α-GFP is retained by necrotic COS-7 cells
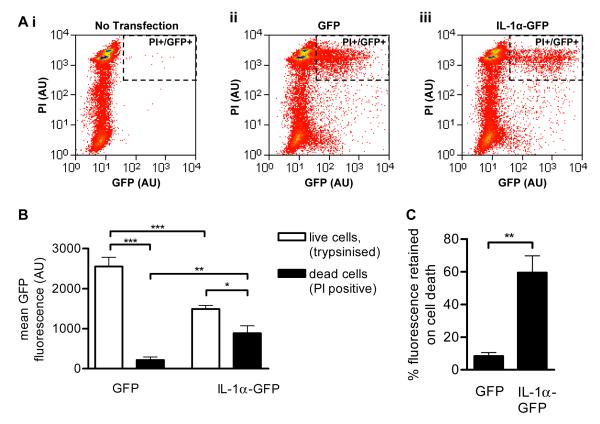
To further confirm that IL-1α is retained in necrotic cells, we investigated the retention of IL-1α-GFP versus GFP alone in necrotic COS-7 cells. IL-1α-GFP or GFP were transiently overexpressed in COS-7 cells, and the cells were killed by OGD (24 hours) combined with ATP-depletion by metabolic poisons (1 μM carbonyl cyanide 3-chlorophenylhydrazone (CCCP) and 15mM 2-deoxyglucose (2-DOG)). Necrotic COS-7 cells detached into the cell culture media and were analysed by FACS. Dead cells were identified by PI staining and the amount of IL-1α-GFP retained was quantified in PI-positive cells (Fig. 3Aiii, PI+/GFP+). IL-1α-GFP fluorescence retention was compared to retention of GFP alone (Fig. 3Aii). The baseline fluorescence of living, GFP or IL-1α-GFP-expressing cells, dissociated by trypsinisation, was also quantified.
Figure 3. IL-1α-GFP is retained by necrotic COS-7 cells.
COS-7 cells transiently transfected with GFP or IL-1α-GFP were killed by ATP-depletion (30 minutes, 1 μM CCCP, 15mM 2-DOG) and OGD (24 hours). Control cells were kept under normoxic conditions and trypsinised. Necrotic, detached cells and live, trypsinised cells were collected and PI-stained. Cellular GFP and PI fluorescence was measured by FACS. Scatter plots (A) show PI and GFP fluorescence intensities of necrotic cells in one representative experiment. Dashed rectangle indicates PI+/GFP+ cells. Mean GFP fluorescence of GFP and IL-1α-GFP positive COS-7 cells was measured in live, trypsinised cells and in dead, PI positive cells (C). *p<0.05, **p<0.01, ***p<0.001, One-way ANOVA with post-hoc Bonferroni multiple comparison. The proportion of GFP fluorescence retained on cell death was calculated for GFP- and IL-1α-GFP-expressing cells (D). **p<0.01, Student’s t-test. Data from n = 3 independent experiments.
The mean fluorescence of live GFP-expressing cells was significantly higher than that of IL-1α-GFP expressing cells (Fig. 3B, 2550 ± 230 AU vs. 1500 ± 90 AU, p<0.001), indicating that GFP is more highly expressed in these cells than IL-1α-GFP. GFP fluorescence was reduced following death of both GFP and IL-1α-GFP expressing cells (Fig. 3B). However, whilst GFP-expressing cells retained only 8% of their fluorescence after cell death, IL-1α-GFP expressing cells retained significantly more fluorescence (60% ± 10%, p<0.01, Fig. 3C). These data, combined with the evidence from necrotic microglia (Fig. 2) confirm that IL-1α can be retained by necrotic cells, potentially regulating sterile inflammation induced by necrotic cell death.
Nuclear retention of IL-1α by immobilisation
IL-1α can diffuse passively across the nuclear pore complex and so out of the nuclei of necrotic cells [17]. Thus we hypothesised that in order to be retained in necrotic cells, IL-1α must become immobilised in cell nuclei. Since OGD will cause cellular ATP depletion prior to necrosis, we proposed that this immobilisation would occur under conditions of ATP-depletion. Thus, we investigated IL-1α-GFP intranuclear mobility in COS-7 cells maintained under normal (glucose-maintained) and ATP-depleted (glucose-free imaging buffer + 1 μM CCCP and 15 mM 2-DOG, 30 minutes) culture conditions.
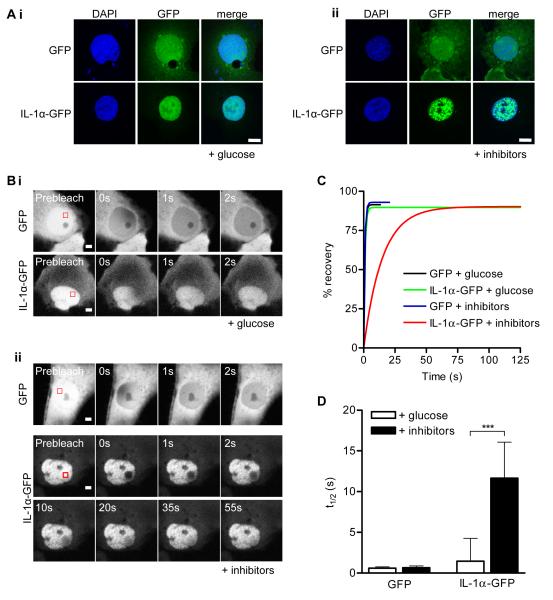
In control, glucose-maintained cells, both GFP and IL-1α-GFP were distributed evenly throughout the nucleoplasm (Fig. 4Ai). As has been reported previously [18], ATP depletion induced chromatin rearrangement (Fig. 4Aii, DAPI stain). However, the intranuclear distribution of GFP was unaffected in ATP-depleted cells (Fig. 4Aii). In contrast, ATP depletion stimulated the redistribution of intranuclear IL-1α-GFP to discrete speckles (Fig. 4Aii).
Figure 4. Intranuclear IL-1α is immobilised on depletion of cellular ATP.
GFP or IL-1α-GFP-expressing COS-7 cells were ATP depleted (30 minutes, “+ inhibitors”, Aii, Bii) or maintained in imaging buffer with glucose “+ glucose” Ai, Bi). Confocal images (Ai, ii) show GFP and IL-1α-GFP intranuclear distribution in DAPI stained cells. Scale bar = 10 μm. Time-lapse confocal images (B) show fluorescence recovery after photobleaching of an intranuclear ROI (red square). Scale bar = 5 μm. Mean nucleoplasmic fluorescence recovery curves (C) and half times (t1/2, D) for fluorescence recovery are shown for GFP and IL-1α-GFP expressing cells with and without ATP depletion. Data from n = 15 individual cells per construct. ***p<0.001, *p<0.05, One-way ANOVA with post-hoc Bonferroni multiple comparison test.
The nucleoplasmic mobility of IL-1α-GFP was investigated by FRAP. A nucleoplasmic region of interest (ROI, Fig. 4Bi, ii) was defined within a GFP-positive cell and photobleached. The kinetics of fluorescence recovery (due to exchange of bleached with unbleached fluorescent molecules in the surrounding nucleoplasm) was followed within the ROI (Fig 4Bi, ii). A one-phase exponential recovery curve was then fit to the fluorescence recovery data (Fig. 4C) and used to calculate the half-time (t1/2, 4D) for fluorescence recovery [19]. ATP depletion significantly attenuated IL-1α-GFP intranuclear mobility (Fig. 4D, t1/2 increased from 1.5 ± 2.8 seconds in glucose-maintained cells to 11.6 ± 4.4 seconds in ATP-depleted cells, p<0.001). In contrast, the intranuclear mobility of GFP was unaffected by ATP depletion (Fig. 4D, t1/2 = 0.6 ± 0.2 seconds for GFP in control cells). The cytoplasmic mobility of GFP and IL-1α-GFP were also unaffected by ATP depletion (Fig. S3) Thus, ATP depletion caused the specific immobilisation of intranuclear IL-1α-GFP in discrete speckles.
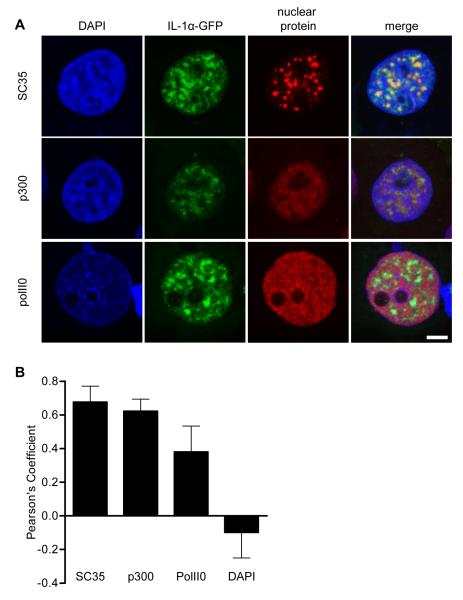
We next investigated the nature of the sub-nuclear domains to which IL-1α-GFP became confined under ATP-depleted conditions. The co-localization of IL-1α-GFP with DNA and specific nuclear proteins was assessed in ATP-depleted cells by immunocytochemistry and confocal microscopy. Co-localization was quantified using the Pearson’s co-localization coefficient, which assesses the strength of linear correlation between pixel fluorescence in two different channels. +1 indicates perfect co-localization, a value of zero indicates no co-localization, and −1 indicates a perfect negative correlation between the intensities in the two channels [20].
The IL-1α N-terminal domain has been reported previously to localize to SC-35-positive nuclear speckles [storage sites for RNA splicing factors, [13;21]]. We found that IL-1α-GFP similarly became partially restricted to SC-35-poitive nuclear speckles in ATP-depleted cells (Fig. 5, Pearson’s coefficient = 0.68 ± 0.09). IL-1α-GFP also co-localized partially with the histone acetyl transferase p300 (Fig. 5, Pearson’s coefficient = 0.62 ± 0.07), an intranuclear protein known to interact with IL-1α [22]. In contrast, IL-1α-GFP co-localized poorly with active transcription sites labelled with serine-2-phosphorylated C-terminal domain repeat RNA polymerase II [PolII0, Fig. 5, Pearson’s coefficient = 0.38 ± 0.15, [23;24]]. IL-1α-GFP was also excluded from regions containing heterochromatic DNA (Fig. 5, Pearson’s coefficient = −0.10 ± 0.15). These data indicate that ATP depletion enhances the previously reported associations of IL-1α with p300, and with RNA splicing factors [13;22]. These enhanced interactions may be responsible for the immobilisation of IL-1α-GFP that occurs after ATP-depletion and thus for IL-1α retention in the nucleus after necrotic cell death.
Figure 5. Intranuclear IL-1α co-localizes with nuclear speckles and p300 on depletion of cellular ATP.
IL-1α-GFP-expressing (green) COS-7 cells were ATP depleted (30 minutes), immunostained for p300 (a HAT), SC35 (nuclear speckle marker) or polII0 (active transcription site marker), and DAPI co-stained. Confocal images (A) are of representative cell nuclei from one of three independent experiments. Scale bar = 5 μm. The extent of co-localization of IL-1α-GFP with nuclear proteins and DNA (DAPI) was assessed using Pearson’s co-localization analysis (B). Data are from n ≥ 20 cells per co-stain.
Discussion
We report here that IL-1α can be retained in cell nuclei following necrotic cell death (Figs. 2 and 3). The finding that IL-1α can be immobilised in nuclear speckles with p300 following ATP depletion provides a potential mechanism for the intranuclear retention of IL-1α in necrotic cells (Figs. 4 and 5).
Since IL-1α released from necrotic cells is proinflammatory [4], we propose that intranuclear retention of IL-1α represents a mechanism for attenuating inflammation caused by the death of IL-1α-expressing cells. IL-1α is expressed by healthy cells in some tissues including skin, liver and spleen [25-27]. IL-1α released from these cells after tissue damage acts as a DAMP activating sterile inflammation [4]. IL-1α expression is also induced in immune cells by DAMPs [1], and will be released from immune cells following necrosis. Intranuclear retention of IL-1α may therefore both inhibit the induction of sterile inflammation and negatively regulate the continuing inflammatory response.
High mobility group box 1 (HMGB1), like IL-1α, is a nuclear protein that can regulate transcription, and can also be released from cells to act as a pro-inflammatory cytokine [28]. Scaffidi et al. (2002) [29] report that HMGB1 can be retained in apoptotic cell nuclei, limiting cell-death induced inflammation, via binding to hypoacetylated chromatin. While IL-1α is similarly retained in cell nuclei, we have found that this retention occurs in necrotic cells (confirmed by LDH release and PI staining, Figs. 2 and 3). Furthermore, IL-1α intranuclear retention does not appear to depend on chromatin binding, as immobilised IL-1α-GFP did not co-localize with DAPI-stained DNA (Figs. 4 and 5). Instead, our data (Fig. 5) suggests that IL-1α retention in the nucleus is more likely to depend on previously reported interactions with other intranuclear proteins; p300 and RNA splicing factors [13;22].
In summary, the results presented here provide new insights in to mechanisms regulating IL-1α-dependent inflammation after necrotic cell death. Future studies are required to determine the impact of IL-1α intranuclear retention on cell-death-induced inflammation in vivo.
Materials and Methods
Cell culture
BV-2, HEK-293 and COS-7 cells were maintained as described previously [11;19]. Confluent monolayers of HEK-293 cells were grown on poly-D-lysine-coated coverslips, prior to the addition of BV-2 cells (1 × 10⁵ cells/mL) on top of the monolayers. IL-1α expression in BV-2 microglia was induced with LPS (1 mg/mL, Escherichia coli 026:B6). COS-7 cells were ATP depleted by treatment with 1 μM CCCP + 15 mM 2-DOG (30 minutes) in glucose-free DMEM (OGD experiments, Invitrogen, UK) or imaging buffer [FRAP experiments, [19]]. IL-1α-GFP and GFP expression vectors [11] were transiently transfected into COS-7 cells using lipofectamine 2000 (Invitrogen).
Immunocytochemistry
BV-2 cells in HEK co-cultures were labeled with Alexa Fluor 594 conjugated isolectin B-4 (5 μg/mL, 15 minutes prior to fixation, Invitrogen). Necrotic cells were stained with PI (20 μg/mL, 5 minutes). Immunocytochemistry was performed as described previously [11], using goat anti-IL-1α (RnD Systems, UK), mouse anti-p300, rabbit anti-PolII0 (Abcam, UK) or mouse anti-SC35 (Sigma Aldrich, UK) antibodies.
Widefield microscopy and cell counting
Widefield images were captured on a BX51 upright microscope (40×/1.00 UPlan Apo objective, Olympus, UK) with a Coolsnap HQ camera (Photometrics, UK) and MetaVue Software (Molecular Devices, UK). Image scaling was adjusted using Image J software (http://rsb.info.gov/ij/) to exclude background immunostaining. Local cell density (density of DAPI-stained nuclei) and % IL-1α-expressing cells containing intranuclear IL-1α were quantified by blinded, manual cell counting in 8-10 fields of view per coverslip.
OGD, LDH Assay and IL-1α ELISA
BV-2 or COS-7 cells in glucose-free DMEM (Invitrogen) were transferred to a humidified hypoxic chamber (1% O2, 5% CO2, 37°C, 24 hours, Coy Laboratory Products, UK). Normoxic cells were maintained in DMEM with glucose under normal tissue culture conditions. LDH and IL-1α release into supernatants was quantified using a CytoTox 96® Non-Radioactive Cytotoxicity Assay (Promega, UK) and an anti-IL-1α DuoSet ELISA (RnD Systems, UK) respectively, according to manufacturer’s instructions.
FACS
GFP fluorescence in PI-stained COS-7 cells was quantified using a Cyan ADP flow cytometer (Beckman Coulter, UK). Fluorophores were excited with a 488nm laser and emission was detected though 530/40 (GFP) and 613/20 (PI) bandpass filters. Data analysis used Summit v4.3 software (Dako, USA). Compensation was applied for spillover between the two fluorescence signals, using PI-positive/GFP-negative (untransfected, dead, PI-stained), and PI-negative/GFP-positive (transfected, live, no PI staining) cells for calibration. Mean GFP fluorescence was measured in GFP/PI double-positive cells.
Confocal microscopy and FRAP
Confocal microscopy on fixed cells and FRAP on live cells were performed on a Leica SP5 AOBS tandem head confocal microscope (63×/1.40 HCX PL Apo objective) with Leica LAS AF software as described previously [11]. Pearson’s co-localization analysis was used to assess the co-localization of IL-1α-GFP with nuclear proteins and DAPI [20].
For nucleoplasmic FRAP, cells were maintained in 5% CO2 at 36°C, and imaged at 5 × zoom using the 488nm laser line (8% power) of an argon laser (set to 80% power). A nucleoplasmic ROI (4 × 4 μm) was defined, and 20 pre-bleach 256 × 256 pixel images were acquired followed by 10 ROI bleach cycles (frames captured while zoomed in on ROI and using 100% of 458, 476 and 488 nm laser line power) over 3.8 s. Recovery was followed over 100 frames acquired at 2.6 frames/s, and then over a further 100 frames acquired every 2 seconds when recovery was slow. Protein mobility (t1/2) was calculated as reported previously [19;30].
Statistical analysis
Statistical analyses were performed using GraphPad Prism version 4.00 for Windows, from GraphPad Software (USA, www.graphpad.com). Differences between two groups were identified using the Student’s t-test, and differences between several groups were identified using one -way analysis of variance (ANOVA) with post-hoc Bonferroni multiple comparison test. All data are expressed as mean ± standard deviation (s.d.).
Supplementary Material
Acknowledgements
Special thanks goes to staff at the Bioimaging and Flow Cytometry Facilities (Faculty of Life Sciences, University of Manchester) for their help with microscopy and FACS. The study was funded by the British Pharmacological Society (N.M.L.), BBSRC (B.M.) and the Wellcome Trust (D. B., N.M.L.). We are also grateful to Prof. Nancy Rothwell (University of Manchester) for useful discussions and for critically evaluating the manuscriipt.
Abbreviations
- AU
absorbance units
- CCCP
carbonyl cyanide 3-chlorophenylhydrazone
- DAMP
damage-associated molecular pattern
- 2-DOG
2-deoxyglucose
- ECM
extracellular matrix
- FRAP
fluorescence recovery after photobleaching
- HMGB1
high mobility group box 1
- LDH
lactate dehydrogenase
- LPS
lipopolysaccharide
- OGD
oxygen and glucose deprivation
- PI
propidium iodide
- PolII0
serine-2-phosphorylated C-terminal domain repeat RNA polymerase II
- ROI
region of interest
Footnotes
Conflict of interest
The authors declare no conflicts of interest.
Online supporting information
Fig. S1 shows the effect of adhesion to different ECM molecules on IL-1α localization in BV-2 microglia. Fig. S2 shows the effect of HEK-293 and astrocyte co-culture on IL-1α localization in primary murine microglia. Fig. S3 shows the effect of ATP-depletion on IL-1α-GFP cytoplasmic mobility in COS-7 cells.
References
- 1.Chen CJ, Kono H, Golenbock D, Reed G, Akira S, Rock KL. Identification of a key pathway required for the sterile inflammatory response triggered by dying cells. Nat.Med. 2007;13:851–856. doi: 10.1038/nm1603. [DOI] [PubMed] [Google Scholar]
- 2.Kono H, Rock KL. How dying cells alert the immune system to danger. Nat.Rev.Immunol. 2008;8:279–289. doi: 10.1038/nri2215. [DOI] [PMC free article] [PubMed] [Google Scholar]
- 3.Dinarello CA. Immunological and inflammatory functions of the interleukin-1 family. Annu.Rev.Immunol. 2009;27:519–550. doi: 10.1146/annurev.immunol.021908.132612. [DOI] [PubMed] [Google Scholar]
- 4.Eigenbrod T, Park JH, Harder J, Iwakura Y, Nunez G. Cutting edge: critical role for mesothelial cells in necrosis-induced inflammation through the recognition of IL-1 alpha released from dying cells. J.Immunol. 2008;181:8194–8198. doi: 10.4049/jimmunol.181.12.8194. [DOI] [PMC free article] [PubMed] [Google Scholar]
- 5.Allan SM, Tyrrell PJ, Rothwell NJ. Interleukin-1 and neuronal injury. Nat.Rev.Immunol. 2005;5:629–640. doi: 10.1038/nri1664. [DOI] [PubMed] [Google Scholar]
- 6.Boutin H, LeFeuvre RA, Horai R, Asano M, Iwakura Y, Rothwell NJ. Role of IL-1alpha and IL-1beta in ischemic brain damage. J.Neurosci. 2001;21:5528–5534. doi: 10.1523/JNEUROSCI.21-15-05528.2001. [DOI] [PMC free article] [PubMed] [Google Scholar]
- 7.Mabuchi T, Kitagawa K, Ohtsuki T, Kuwabara K, Yagita Y, Yanagihara T, Hori M, Matsumoto M. Contribution of microglia/macrophages to expansion of infarction and response of oligodendrocytes after focal cerebral ischemia in rats. Stroke. 2000;31:1735–1743. doi: 10.1161/01.str.31.7.1735. [DOI] [PubMed] [Google Scholar]
- 8.Mosley B, Urdal DL, Prickett KS, Larsen A, Cosman D, Conlon PJ, Gillis S, Dower SK. The interleukin-1 receptor binds the human interleukin-1 alpha precursor but not the interleukin-1 beta precursor. J.Biol.Chem. 1987;262:2941–2944. [PubMed] [Google Scholar]
- 9.Stevenson FT, Torrano F, Locksley RM, Lovett DH. Interleukin 1: the patterns of translation and intracellular distribution support alternative secretory mechanisms. J.Cell Physiol. 1992;152:223–231. doi: 10.1002/jcp.1041520202. [DOI] [PubMed] [Google Scholar]
- 10.Wessendorf JH, Garfinkel S, Zhan X, Brown S, Maciag T. Identification of a nuclear localization sequence within the structure of the human interleukin-1 alpha precursor. J Biol.Chem. 1993;268:22100–22104. [PubMed] [Google Scholar]
- 11.Luheshi NM, Rothwell NJ, Brough D. The dynamics and mechanisms of interleukin-1alpha and beta nuclear import. Traffic. 2009;10:16–25. doi: 10.1111/j.1600-0854.2008.00840.x. [DOI] [PMC free article] [PubMed] [Google Scholar]
- 12.Werman A, Werman-Venkert R, White R, Lee JK, Werman B, Krelin Y, Voronov E, Dinarello CA, Apte RN. The precursor form of IL-1alpha is an intracrine proinflammatory activator of transcription. Proc.Natl.Acad.Sci.U.S.A. 2004;101:2434–2439. doi: 10.1073/pnas.0308705101. [DOI] [PMC free article] [PubMed] [Google Scholar]
- 13.Pollock AS, Turck J, Lovett DH. The prodomain of interleukin 1alpha interacts with elements of the RNA processing apparatus and induces apoptosis in malignant cells. FASEB J. 2003;17:203–213. doi: 10.1096/fj.02-0602com. [DOI] [PubMed] [Google Scholar]
- 14.Colognato H, ffrench-Constant C, Feltri ML. Human diseases reveal novel roles for neural laminins. Trends Neurosci. 2005;28:480–486. doi: 10.1016/j.tins.2005.07.004. [DOI] [PubMed] [Google Scholar]
- 15.Sakai T, Johnson KJ, Murozono M, Sakai K, Magnuson MA, Wieloch T, Cronberg T, Isshiki A, Erickson HP, Fassler R. Plasma fibronectin supports neuronal survival and reduces brain injury following transient focal cerebral ischemia but is not essential for skin-wound healing and hemostasis. Nat.Med. 2001;7:324–330. doi: 10.1038/85471. [DOI] [PubMed] [Google Scholar]
- 16.Kaushal V, Schlichter LC. Mechanisms of microglia-mediated neurotoxicity in a new model of the stroke penumbra. J.Neurosci. 2008;28:2221–2230. doi: 10.1523/JNEUROSCI.5643-07.2008. [DOI] [PMC free article] [PubMed] [Google Scholar]
- 17.Paine PL. Nucleocytoplasmic movement of fluorescent tracers microinjected into living salivary gland cells. J.Cell Biol. 1975;66:652–657. doi: 10.1083/jcb.66.3.652. [DOI] [PMC free article] [PubMed] [Google Scholar]
- 18.Pack C, Saito K, Tamura M, Kinjo M. Microenvironment and effect of energy depletion in the nucleus analyzed by mobility of multiple oligomeric EGFPs. Biophys.J. 2006;91:3921–3936. doi: 10.1529/biophysj.105.079467. [DOI] [PMC free article] [PubMed] [Google Scholar]
- 19.Brough D, Bhatti F, Irvine RF. Mobility of proteins associated with the plasma membrane by interaction with inositol lipids. J.Cell Sci. 2005;118:3019–3025. doi: 10.1242/jcs.02426. [DOI] [PubMed] [Google Scholar]
- 20.French AP, Mills S, Swarup R, Bennett MJ, Pridmore TP. Colocalization of fluorescent markers in confocal microscope images of plant cells. Nat.Protoc. 2008;3:619–628. doi: 10.1038/nprot.2008.31. [DOI] [PubMed] [Google Scholar]
- 21.Lamond AI, Spector DL. Nuclear speckles: a model for nuclear organelles. Nat.Rev.Mol.Cell Biol. 2003;4:605–612. doi: 10.1038/nrm1172. [DOI] [PubMed] [Google Scholar]
- 22.Buryskova M, Pospisek M, Grothey A, Simmet T, Burysek L. Intracellular interleukin-1alpha functionally interacts with histone acetyltransferase complexes. J.Biol.Chem. 2004;279:4017–4026. doi: 10.1074/jbc.M306342200. [DOI] [PubMed] [Google Scholar]
- 23.Grande MA, van d.K I, de J L, van D R. Nuclear distribution of transcription factors in relation to sites of transcription and RNA polymerase II. J.Cell Sci. 1997;110(Pt 15):1781–1791. doi: 10.1242/jcs.110.15.1781. [DOI] [PubMed] [Google Scholar]
- 24.Phatnani HP, Greenleaf AL. Phosphorylation and functions of the RNA polymerase II CTD. Genes Dev. 2006;20:2922–2936. doi: 10.1101/gad.1477006. [DOI] [PubMed] [Google Scholar]
- 25.Hacham M, Argov S, White RM, Segal S, Apte RN. Distinct patterns of IL-1 alpha and IL-1 beta organ distribution--a possible basis for organ mechanisms of innate immunity. Adv.Exp.Med.Biol. 2000;479:185–202. doi: 10.1007/0-306-46831-x_16. [DOI] [PubMed] [Google Scholar]
- 26.Romero LI, Ikejima T, Pincus SH. In situ localization of interleukin-1 in normal and psoriatic skin. J.Invest Dermatol. 1989;93:518–522. doi: 10.1111/1523-1747.ep12284068. [DOI] [PubMed] [Google Scholar]
- 27.Takacs L, Kovacs EJ, Smith MR, Young HA, Durum SK. Detection of IL-1 alpha and IL-1 beta gene expression by in situ hybridization. Tissue localization of IL-1 mRNA in the normal C57BL/6 mouse. J.Immunol. 1988;141:3081–3095. [PubMed] [Google Scholar]
- 28.Lotze MT, Tracey KJ. High-mobility group box 1 protein (HMGB1): nuclear weapon in the immune arsenal. Nat.Rev.Immunol. 2005;5:331–342. doi: 10.1038/nri1594. [DOI] [PubMed] [Google Scholar]
- 29.Scaffidi P, Misteli T, Bianchi ME. Release of chromatin protein HMGB1 by necrotic cells triggers inflammation. Nature. 2002;418:191–195. doi: 10.1038/nature00858. [DOI] [PubMed] [Google Scholar]
- 30.Snapp E, Altan N, Lippincott-Schwartz J. Measuring Protein mobility by photobleaching GFP-chimeras in living cells. In: Bonifacino M, Dasso J, Harford J, Lippincott-Schwartz J, Yamada M, editors. Current Protocols in Cell Biology. John Wiley & Sons; New York: 2003. [DOI] [PubMed] [Google Scholar]
Associated Data
This section collects any data citations, data availability statements, or supplementary materials included in this article.


