Abstract
This article reports large item effects in a study of computer-based learning of neuroanatomy. Outcome measures of the efficiency of learning, transfer of learning, and generalization of knowledge diverged by a wide margin across test items, with certain sets of items emerging as particularly difficult to master. In addition, the outcomes of comparisons between instructional methods changed with the difficulty of the items to be learned. More challenging items better differentiated between instructional methods. This set of results is important for two reasons. First, it suggests that instruction may be more efficient if sets of consistently difficult items are the targets of instructional methods particularly suited to them. Second, there is wide variation in the published literature regarding the outcomes of empirical evaluations of computer-based instruction. As a consequence, many questions arise as to the factors that may affect such evaluations. The present paper demonstrates that the level of challenge in the material that is presented to learners is an important factor to consider in the evaluation of a computer-based instructional system.
Keywords: neuroanatomy education, item effects, difficulty, transfer of learning, generalization, computer assisted instruction, computer based learning, instruction, 3D graphics
INTRODUCTION
Gaining an education in the biomedical sciences is particularly challenging. In mastering neuroanatomy, for example, learning must encompass gray matter structures, white matter structures, major blood vessels, cranial nerves, and functional pathways. Each of these is a large and spatially complex system. In addition, students will have to identify structures in a variety of formats, which may include prosection, cryosection, and MRI, CT, and x-ray scans. It is therefore a matter of particular importance that there is potential for computer software systems to increase the efficiency and effectiveness of instruction in anatomical disciplines (Trelease, 2002; Sugand et al., 2010). Consistent with this potential, several computer-based instructional systems focused on anatomy have been reported recently as being in various stages of development (UW-SIG, 1999; Höhne et al., 2003; Crowley and Medvedeva, 2006; Nicholson et al., 2006; Kockro et al., 2007; Primal Pictures, 2007; Nowinski et al., 2009; Trelease, 2008; Petersson et al., 2009; Chariker et al., 2011; Yeung et al., 2011). There is also a growing corpus of studies that have evaluated the effectiveness of computer-based systems for anatomical instruction (Garg et al., 2002; Hallgren et al., 2002; Hariri et al., 2004; Luursema et al., 2006; Nicholson et al., 2006; Levinson et al., 2007; El Saadawi et al., 2008; Keehner et al., 2008; McNulty et al., 2009; Chariker et al., 2011; Keedy et al., 2011). However, conclusions vary widely, and it is clear that much work is left to be done both in developing and in evaluating new instructional systems (Cook, 2005; Winkelman, 2007; Collins, 2008; Ruiz et al., 2009; Tam et al., 2009; Malone et al., 2010).
The authors of the present article have previously reported work on computer-based instruction using three-dimensional computer graphical models. The work was aimed at improving the efficiency of learning sectional neuroanatomy (Chariker et al., 2011). In a longitudinal study with a broad spectrum of college undergraduates who were naive to neuroanatomy, students learned to recognize 19 neuroanatomical structures in whole (three-dimensional) form and in the three standard sectional views (coronal, sagittal, and axial). Learning to a high performance criterion required an average of 6.1 one-hour visits to the laboratory (SD = 2.58; range from 3 visits to 15 visits). A group that began with whole anatomy learned sectional anatomy more efficiently than a group that was exposed only to sectional anatomy. Methods of computer-based learning were not compared to more traditional methods, such as study of textbooks and atlases, because it was thought that optimal computer-based methods should be developed first (for a related view, see Friedman, 1994; Cook, 2005). However, there was an effort to test external validity in the form of tests of generalization of knowledge to recognition of structures in MRI and Visible Human images (neither of which had been presented as part of learning). When neuroanatomical structures were indicated by arrows on Visible Human images, for example, group mean performance in naming those structures was 80% correct across the three standard sectional views.
The present paper reports an alternative analysis of the data from this study that is aimed at a different question. We report large item effects in this study of learning and suggest that the relative effectiveness of instructional methods can depend very much on the difficulty of the items to be learned. More challenging items differentiate better between different instructional methods. These results are important for two reasons. First, it is likely that an approach to instruction that is uniform across a complex knowledge domain will be inefficient. If identifiable sets of items are particularly challenging to learn, it may be most efficient to develop methods that are better suited to those items. Characterization of item effects in learning is a step in the direction of implementing such an approach. Second, it is frequently observed that the literature on the evaluation of computer-based instruction varies widely in outcome (Issenberg et al., 2005; Cook et al., 2008). It is our reading of the literature that a use of materials, tests, or instructional designs that do not require high levels of competency are part of the problem. In apparent agreement with this conclusion, several authors have suggested in discussion sections of articles that the difficulty of materials in relation to the expertise of learners may be related to the outcomes of evaluations (Garg et al., 2002; Luursema et al., 2006; Nicholson et al., 2006; Levinson et al., 2007; Keedy et al., 2011). Issenberg and colleagues conducted a meta-analysis of studies of simulation-based instruction over a wide variety of content areas and concluded that repeated testing with materials that increase in difficulty is key to the success of instruction (Issenberg et al., 2005). The present article presents comparative data from a single study which suggests that the level of difficulty presented in instruction should indeed be taken into account in developing and evaluating computer-based instruction.
The data analysis begins with basic quantitative description. It is shown that there are extreme differences in the degree of difficulty across learning of individual neuroanatomical structures and sectional samples of those structures. A second stage of analysis develops a statistical procedure for assessing item difficulty. Using this procedure to identify difficult test items, it is shown that item difficulty interacts with several fundamental outcomes in transfer of learning (i.e., efficiencies of learning due to prior learning of related material) and in generalization of knowledge to recognition with novel materials (i.e., test performance with biomedical images not seen earlier).
A third analysis applies methods of cluster analysis to the item level test data in order to develop a qualitative explanation of which of the tested items are more difficult to learn. Certain items emerge as particularly difficult to learn and others as particularly easy. There is then a brief examination of the correlation between item difficulty in whole neuroanatomy (before sectional neuroanatomy has been introduced) and sectional neuroanatomy. Finally, we clarify issues that arise in the earlier analyses with an examination of the participants’ interactive selection of items during the learning trials (in particular, whether or not the more difficult items have been studied during learning). Because the experimental method has been described earlier (Chariker et al., 2011), we provide a relatively brief description of it.
METHODS
Participants
Recruitment of participants was through online and paper advertisements distributed across the University of Louisville campus. Volunteers were given a questionnaire to assess their knowledge of the 19 neuoanatomical structures learned in the study. Seventy-two undergraduate volunteers with minimal knowledge of neuroanatomy participated in the study. The sample consisted of 31 males and 41 females with a mean age of 22.6 years (SD = 5.7). Participants were paid $8.00 per hour. The study was approved by the university IRB, and informed consent was obtained from each participant before the study commenced.
Psychometric Tests
Prior to learning, each participant was administered the Space Relations subtest of the Differential Aptitude Tests (DAT-SR), a standard test of spatial ability (Bennett et al., 1989). Participants were placed into groups so that the mean and distribution of spatial ability scores were balanced (i.e., a stratified design). (Please note that concerns about gender differences in spatial domains are due to gender differences in tests of spatial ability; Halpern, 2000. By measuring spatial ability, this study has focused on the dimension of primary interest.)
Materials
Separate interactive computer programs supported instruction of whole (three-dimensional) neuroanatomy and sectional neuroanatomy. Computer displays were presented in color on 24 inch high resolution LCD screens. The programs were written in the Visual C++ computer language (Microsoft Inc., Redmond, WA) and used the Open Inventor graphics library (VSG, Burlington, MA). Participants used a standard mouse to interact with graphical objects shown on the screen.
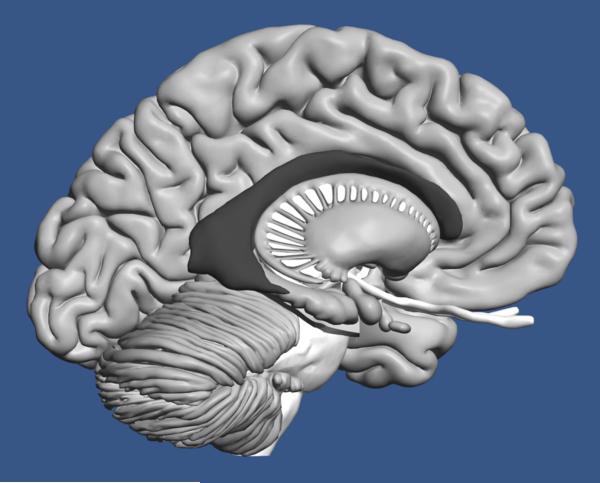
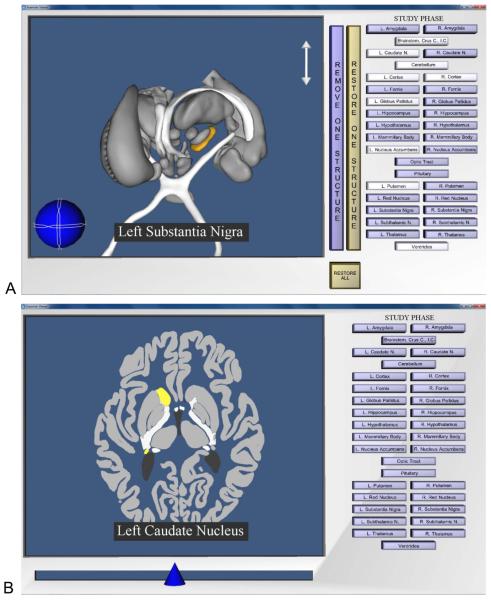
Instruction included a high quality three-dimensional computer graphical model of the human brain, illustrated in Figure 1. When participants studied the whole brain, they could smoothly rotate it around two axes and zoom in and out. Clicking on a structure highlighted it and placed its name prominently on the screen, as shown in Figure 2a. Participants could remove and replace structures and so perform a virtual dissection in order to learn the spatial relations of structures in the brain. Participants learned to label 19 structures, including amygdaloid body, brainstem (and attached structures), caudate nucleus, cerebellum, cortex, fornix, globus pallidus, hippocampus, hypothalamus, mamillary body, nucleus accumbens, optic tract, pituitary gland, putamen, red nucleus, substantia nigra, subthalamic nucleus, thalamus, and ventricles of the brain. (The computer graphical model is under active development and is not currently being distributed. However, there are plans to make it available in the near future.)
Figure 1.
The graphical model of the human brain used in this research. The right cortex has been removed for the illustration.
Figure 2.
A, Screenshot of the program for learning whole neuroanatomy. The user has removed several structures, rotated and zoomed in on the brain, and selected the left substantia nigra; B, Screenshot of the program for learning sectional neuroanatomy. The user has moved the slider at the bottom of the screen in order to view a slice near the middle of the brain. The left caudate nucleus has been selected.
Multiple sectional images were derived from the graphical model of the whole brain in the three standard orientations (60 coronal slices, 50 sagittal slices, and 46 axial slices). In any learning trial with sectional anatomy, shown in Figure 2b, participants viewed the sections in a single orientation. Participants could navigate between slices in serial order by moving a graphical slider across the bottom of the screen. As with whole anatomy, clicking on a structure would highlight it and place its name prominently at the bottom of the screen. Additional materials used in later testing included a set of digital images of MRI scans (Kikinis et al., 1996) and Visible Human Cryosections, version 2.0 (Ackerman, 1995; Ratiu et al., 2003).
Design and Procedure
The instructional programs were aimed at promoting an ability to identify the neuroanatomical structures in whole and/or sectional representation. The overall method, called adaptive exploration, included exploratory study, self-timed testing, and graphical feedback within single learning trials (see discussion in Chariker et al., 2011).
An individual trial began with a study phase that lasted for three minutes. During that time, participants explored the anatomy by using the appropriate tools to move through it, clicked on structures to highlight them, and saw the names for them. The computer program then moved automatically to a test. In the test, participants clicked on a structure to highlight it and then clicked on its label on a button panel. After a structure had been labeled, it turned blue to indicate that it had been considered. Testing was self-paced, and participants could omit structures if they chose. Testing in sectional anatomy was restricted in each section to items indicated by red arrows. This ensured that the same structure was not labeled repeatedly across the sections and that the number of test items did not become too large. Ten of the structures were relatively long and were tested twice across the set of slices. For example, in a coronal view, the caudate nucleus was tested once in the anterior half of the structure and once in the posterior half. There were 29 test items in the coronal and sagittal views and 27 test items in the axial view. With multiple sections available for most structures, repetition of individual test items across tests was rare.
When participants indicated that they were finished with a test, the program moved to a screen with numerical feedback that reported the number of structures labeled correctly, the number mislabeled, the number omitted, and the percentage correct. This screen was displayed until the participant chose to move to the graphical feedback. The graphical feedback phase was identical to the study phase except that the structures were now color coded. Structures named correctly were green, structures mislabeled were red, and omitted structures remained the original colors. For sectional anatomy, slices in which structures had been tested were clearly marked and the red arrows indicating the test items remained in the display. Participants could explore the brain in the context of the graphical feedback for three minutes, after which the program terminated the trial.
The study was organized in a 2 × 2 between groups factorial design. The primary variable of interest was whether or not whole anatomy was learned before sectional anatomy was learned. Half the participants learned whole anatomy and then learned sectional anatomy (this will be called the whole then sections group). The other half learned only sectional anatomy (the sections only group). The second variable was whether or not the navigation through sectional anatomy was completely continuous or was discrete. In the discrete presentation, the brain was invisible during movement through the series of slices. Slices were indicated by numbers that indicated the current position in the brain. This variable made little difference to measured outcomes and data are collapsed across this variable in the present article (leaving the whole then sections and the sections only groups).
A single learning trial consisted of the three phases described earlier: study, test, and feedback. On initiation of a learning program, a single orientation (e.g., front view in whole anatomy or coronal slices in sectional anatomy) was shown for two successive learning trials before the program terminated. This was considered a block of trials. Trial blocks alternated in the order coronal (or front), sagittal (side), and axial (top) until learning was completed. Participants continued learning whole or sectional anatomy until they scored at least a mean of 90% correct for three successive blocks of trials. This method of terminating learning after a uniformly high performance criterion had been reached was used for two reasons. First, it permitted measuring the efficiency of learning as an outcome. Second, any tests of transfer or long term retention were conducted with groups which had fully learned the material.
Immediately after learning was completed, participants were tested for their ability to identify structures both in MRI and Visible Human images. Three tests were conducted for each image type. In a test of Uncued Recognition, participants clicked on any structure in an image that was recognized. A red dot appeared on the image. They then clicked on the name of the structure using the button panel. In the Submit Structure test, a single image had a structure name at the bottom (e.g., “subthalamic nucleus”). The participant then clicked on that structure in the image. In the Submit Name test, a structure was indicated by a red arrow. The participant then named the structure by clicking the appropriate label on the button panel.
The three tests were purposely conducted in the order just given so that performance on the presumably more challenging tests would not benefit from experience with the easier tests. The same items were tested with the biomedical images as were tested in instruction. For example, if the caudate nucleus was tested twice in the coronal view during instruction, it was tested twice with MRI and Visible Human images. No feedback was given in this phase of testing to ensure that performance only reflected generalization from the earlier computer-based instruction to a new set of biomedical images.
After two to three weeks, there was a test of long-term retention of sectional anatomy using the instructional programs. This retention interval was chosen to accommodate the schedules of the student participants. The test phases of the learning programs were used for the tests of retention. All three sectional orientations were tested.
ANALYSIS OF ITEM DIFFICULTY
Basic Description of Quantitative Trends
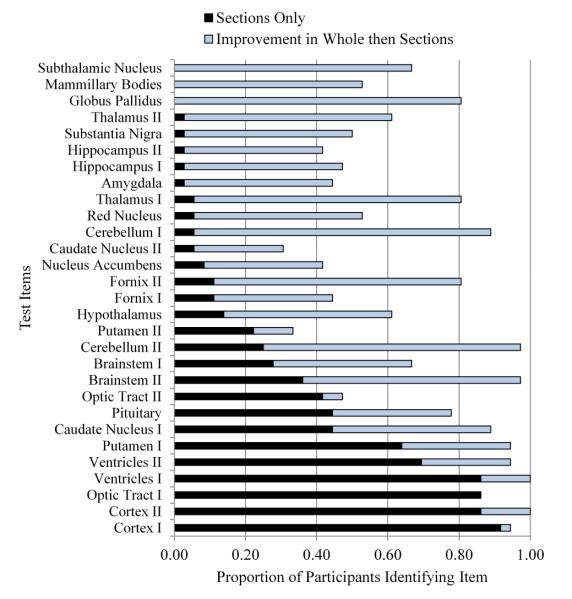
An initial question for the present analysis is whether there were notable differences among items on test performance (i.e., proportion of the groups identifying an item correctly). One critical area to examine is the degree of success in early trials of sectional anatomy learning. In the first trial, both groups had three minutes of study time with sectional anatomy before taking the first test. With this much time, the sections only group was serving as a control group for the measurement of transfer of learning from whole to sectional anatomy. Nonetheless, it is evident from examination of the graph in Figure 3 that there were large and smoothly varying differences in the proportion correct among the test items for the sections only group (shown in the black bars). Nearly everyone recognized cortex, and more than 85% of the participants recognized ventricles in one section and optic tract in one section. Between 30% and 70% of the participants recognized one sectional view of the brainstem, the second view of the optic tract, and single views of the caudate nucleus and putamen. No one recognized subthalamic nucleus, mamillary body, or globus pallidus.
Figure 3.
Proportion of participants correctly identifying neuroanatomical structures in Trial 1 of sectional anatomy learning, broken down by structure, depth of section, and experimental condition. All images were in the coronal (or frontward) orientation. Depth of section is indicated by the roman numerals I and II. Structures are ordered by performance in the sections only group. [Color figure can be viewed in the online issue which is available at wileyonlinelibrary.com]
It appears that item level variation in performance for the sections only group is masking the full value of the transfer of learning for the whole then sections group. In Figure 3, the light blue bars represent the increase in performance for the whole then sections group over the sections only group. For many of the test items, the performance of the sections only group left little room for transfer to make a difference. The scatterplot in Figure 4 illustrates that in general when performance in the sections only group was higher, the amount of transfer for the whole then sections group was lower, r = -0.684, p < 0.001.
Figure 4.
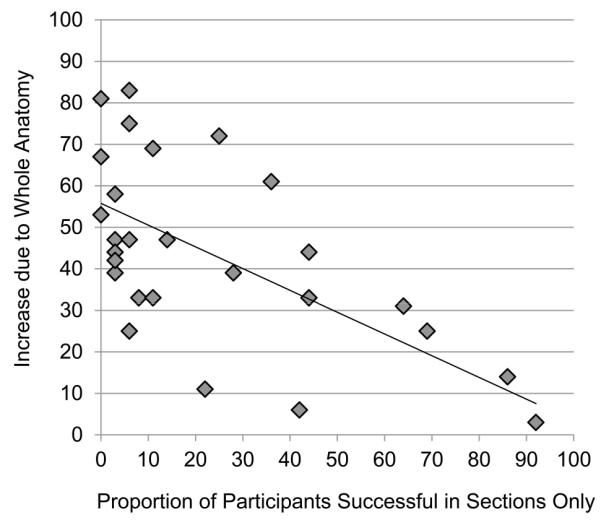
Each point represents a single test item. The scatterplot shows the relationship between the proportion of participants answering each item correctly in the sections only group and the increase in proportion correct for that item in the whole then sections group.
This pattern of outcomes was not confined to Trial 1. The test results in Trial 7 are representative. In that trial, all of the anatomical orientations had been seen and tested twice. It was the third trial for the coronal orientation. For the sections only group, the proportion of the participants identifying the individual items begins at 33% of the sample for nucleus accumbens, and 50% for mammillary body, and increased smoothly over test items. Both sectional views of brainstem, ventricles, cerebellum, and cortex were correctly identified by 97% of the participants or more. As before, the amount of transfer from knowing whole anatomy was more apparent where the control condition had more to learn, r = -0.707, p < 0.001.
An additional consideration that emerges from examination of Figure 3 is that within a single orientation of sectional cuts through the brain, single anatomical structures may vary in difficulty depending on the position of the cut. The anterior portion of the caudate nucleus, for example, was recognized correctly by 44% of the sections only group, while the posterior portion was recognized by 6% of the group. For the 10 structures tested with two sections, there was a mean difference of 18% in the percentage of participants identifying the two samples correctly.
Statistical Method for Determining Difficult Structures
There is no a priori system for predicting item difficulty in the domain of neuroanatomy. Psychologically, difficulty should vary with several basic properties: the perceptual salience of items, their distinctiveness among the set of items to be learned, whether a particular sample of a structure matches an established representation (e.g., “U-shaped”), and the expertise of the learner at the time of instruction. Physically, difficulty might reflect such properties as the shapes and spatial relations of the anatomical structures, the type of media used (e.g., graphical model, MRI image), the orientations of sectional cuts (coronal, sagittal, or axial), and the positions of the cuts (e.g., anterior, middle, or posterior). There is no current mapping, however, of physical representations of neuroanatomy onto psychological properties relevant to learning.
In viewing the data in detail, it appears that often it is particular combinations of physical factors that make structures easier or more difficult to identify, and this seems obvious on reflection. A particular position of a sectional cut, for example, is unlikely to be consistently associated with difficulty. Structures seen in an anterior coronal section are not inevitably difficult to identify. On the other hand, it is plausible that anterior coronal sections of particular structures might be relatively difficult to learn.
Because it may have been unpredictable combinations of factors that produced items difficult to learn, a process was developed for identifying difficult items based on the outcomes of the tests taken during learning. It is an approach that is consistent with established procedures for test development (Downing and Yudkowsky, 2009). It is adapted, however, to the particular circumstances of a study of learning, where there are multiple tests and performance approaches 100% correct. The approach also is in agreement with Item Response Theory (IRT; Nering and Ostini, 2010). IRT, however, requires minimum sample sizes for parameter estimation that are not realistic for most research studies. This is especially true for longitudinal studies in which substantial time is given to testing single participants. Basic elements and constraints of the current method include the following.
The fundamental measurement of item difficulty is the proportion of the group answering that item correctly.
Determine a numerical threshold that will define a low proportion correct of individual items in relation to the overall group mean and variance for the test. Items below the threshold are defined as difficult.
All test items are considered unique combinations of factors. For example, a single anatomical structure tested at two depths of cut is considered to be two unique items.
Items on a test are compared to performance only on that test. This allows adaptation of the system to each new variant and combination of items and to the fact that difficulty may be affected by the expertise of the learners.
Performance data that reflect learning vary between a proportion correct of 0 and 1.0. They fit a binomial distribution rather than a normal or other symmetric distribution. This is especially a concern where learning is advanced, and the group as a whole reaches high levels of performance (i.e., ceiling effects). Consequently, logistic regression techniques are appropriate for modeling test performance across learning trials.
No item with a proportion correct above 75% is considered difficult. This is an absolute cut-off that places a limit on the operation of the general method. It is based on a simple belief that the concept “difficult” does not apply to items recognized at a high level of competence.
We determined the thresholds for difficulty by using logistic regression across learning trials to determine the 95% confidence intervals around the mean proportion correct in each test. For learning data, predictors in the regression equation included trial number, anatomical orientation, and the number of times that the sequence of three anatomical orientations had been repeated (so-called “cycle”). The proportion of correct responses for each test item was then calculated for each test. This value was compared to the confidence interval derived from the regression for that test. Item proportions below the lower bound of the confidence interval were considered to be difficult. In essence, a test item that had group performance that was low enough to be very unlikely as a sample mean for the whole test was defined as difficult.
The logistic regression was implemented with multilevel modeling (Singer and Willett, 2003). The statistical model that applied the predictors and the higher level interactions of the predictors was not pruned in the usual way to include only factors that were statistically significant at the conventional level of p = 0.05. Rather, the model was configured to fit the data very closely and to provide confidence intervals that were well determined.
It is important to consider that a method that employs confidence intervals around test means would not require that a constant proportion of individual test items fall below the threshold for difficulty. Thus, it is different from using a percentile cutoff. Because logistic regression is used, the method also is not distorted by the high degree of skew that arises when a learning group approaches ceiling on the tests. Thus, it is different from using a standard score (often called z-score) cutoff.
Transfer of learning from whole to sectional anatomy
Returning to performance in Trial 1 of sectional anatomy learning, test performance in the sections only group was used to determine the difficulty of individual test items. In this case, there were 17 items determined to be difficult and 12 items that were not. Referring to Figure 3, the threshold was drawn between cerebellum II and putamen II.
The proportion of difficult items, and the effect on mean test performance when the difficult items were separated, is shown in Figure 5 for both experimental groups. Not surprisingly, there was a statistical main effect of difficulty on test performance, F(1, 68) = 848.754, p < 0.001, ηp2 = 0.926. There also was a main effect of group, F(1,68) = 209.712, p < 0.001, ηp2 = 0.755. Importantly, there was a group by difficulty interaction, F(1, 68) = 94.298, p < 0.001, ηp2 = 0.581. Transfer of learning from whole to sectional anatomy was much greater for the difficult items. This was true both in the absolute difference between conditions (an advantage of 50% correct for the difficult items vs. an advantage of 29% for the easier ones) and as a relative increase. The whole then sections group was 1.5 times better for the easier items and nearly 10 times better for the difficult items.
Figure 5.
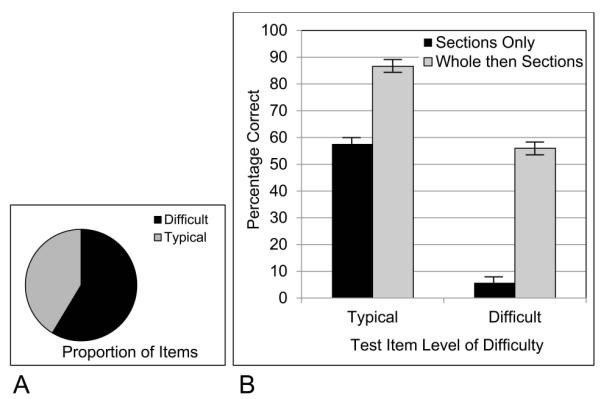
A, The proportion of test items categorized as difficult in Trial 1 of learning; B, The proportion of participants answering test items correctly, broken down by experimental group and level of item difficulty.
This set of statistical relationships continued across learning trials. Thus, across the first 8 trials (which was before participants began to reach criterion and conclude learning), there was a statistical interaction between difficulty and experimental condition, F(1, 68) = 81.659, p < 0.001, ηp2 = 0.546. Transfer of learning from whole to sectional anatomy was much greater for the difficult items. The whole then sections group had an overall advantage of 36% correct for difficult items vs. an advantage of 13% for more typical ones.
Generalization of Knowledge to Interpreting Biomedical images
After completion of learning, test items for the interpretation of biomedical images varied in combinations of image type (MRI or Visible Human), anatomical structure, section orientation (coronal, sagittal, and axial), and position of cut (e.g., anterior, posterior). The same procedure used to determine difficult test items for the learning data were used for each of the three tests of generalization (i.e., Uncued Recognition, Submit Structure, and Submit Name). As before, the data from the sections only group were used to determine the sets of difficult items for each test. The proportion of difficult items and the differences in mean test performance between difficult and typical items were relatively large for all groups in the three tests of generalization, as shown in Figure6.
Figure 6.
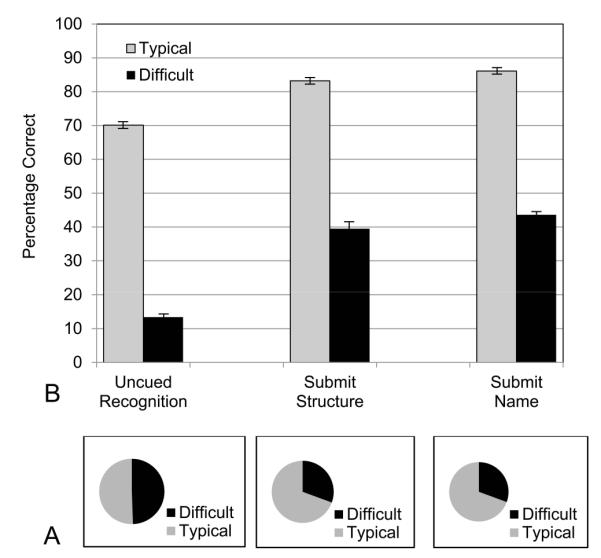
A, The proportions of test items categorized as difficult in the three tests of generalization to biomedical images; B, The proportions of participants answering items correctly in the three tests of generalization, broken down by experimental group and level of item difficulty.
The test items on the first and most challenging test, Uncued Recognition, split evenly into items that were categorized as easier (50.6% of the items) and items that were categorized as more difficult (49.4%; Figure 6). Mean performance on these two sets of items was very different, with 70.1% correct for the easier items and 13.4% for the difficult items, F(1,65) = 3375.952, p < 0.001, ηp2 = 0.981. Thus, performance on this test was encouraging for about half of the test items. For a second half, attention must be paid to modifying the instructional method. Note that this is a different use of data about difficulty from the earlier analysis of transfer of learning from whole to sectional anatomy. In learning, easier items were diluting the measured degree of transfer. In the test of Uncued Recognition, especially difficult items are masking the reasonable amount of generalization that occurred for about half of the items.
In the second test taken, Submit Structure, a structure label was given at the bottom of an image, and the participant clicked on the structure. For this test, 69.4% of the test items were categorized as easier, and 30.6% as difficult. The percentage correct once again was very different between these two sets of items. The easier items led to 83.2% correct, whereas the more difficult items tested at 39.5%, F(1,65) = 796.098, p < 0.001, ηp2 = 0.925. In a parametric breakdown of the biomedical images for this test of generalization, the best performance came from separating the half of the images that were from the Visible Human, for which mean performance was 72.3% correct. Dividing the images instead by difficulty indicates that a larger group of test items, more than two thirds of them, had a substantially higher level of performance (83.2%).
In the third test taken, Submit Name, structures in the images were indicated by small red arrows, and the participants provided the names for the structures. The proportions and means that followed from the breakdown of the items by difficulty were similar to the previous test (Submit Structure). In particular, 69.4% of the test items were categorized as easier, and 30.6% as difficult. The percentage correct was again very different between these two sets of items. The easier items led to 86.1% correct, whereas the more difficult items tested at 43.6%, F(1, 65) = 1426.734, p < 0.001, ηp2 = 0.956.
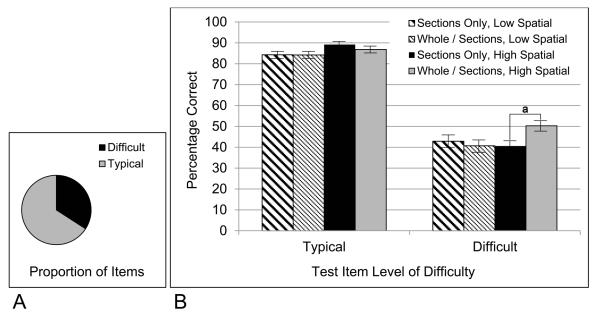
Data from the Submit Name test were particularly interesting because there was an interaction of learning condition by difficulty, F(1,65) = 5.038, p = 0.028, ηp2 = 0.072. As illustrated in Figure 7, this was clarified by a three-way interaction of learning condition by difficulty by spatial ability, F(1,65) = 10.125, p = 0.002, ηp2 = 0.135. The whole then sections group was superior to the sections only group for the participants with high spatial ability when they were judging the difficult items.
Figure 7.
A, The proportion of test items categorized as difficult in the Submit Name test of generalization; B, The proportion of participants answering test items correctly, broken down by experimental group, level of item difficulty, and high or low spatial ability; a, statistically significant at p = 0.002.
This result shows a generalization of knowledge from whole to sectional anatomy that involves interpreting biomedical images that were not part of learning. Because it is specific to participants with high spatial ability, it also suggests the character of this generalization. Some participants were able to use their knowledge of whole anatomy to make spatial inferences that rendered the difficult items more interpretable. Without consideration of item difficulty, there were no effects of learning condition on generalization of knowledge to the interpretation of biomedical images.
Long-term retention
Items in the tests of long-term retention of sectional anatomy varied by anatomical structure, section orientation, and position of cut. There were 85 test items, with 23.5% of them categorized as difficult and 81.3% of them categorized as easier. The mean performance of the two groups of participants for these two sets of items is shown in Figure 8. The items not categorized as difficult were identified at a very high level of performance (95.4%). For the difficult structures, performance was much lower (59.5%).
Figure 8.
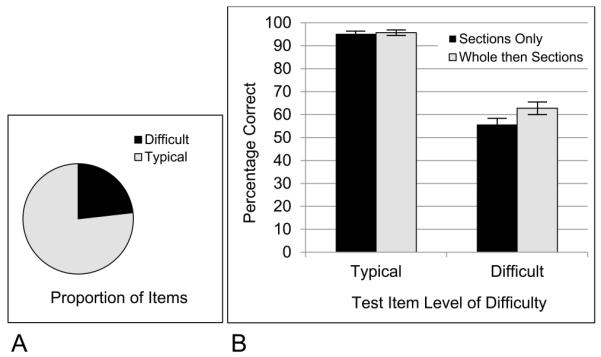
A, The proportion of test items categorized as difficult in the test of sectional long term retention; B, The proportion of participants answering test items correctly in long term retention, broken down by experimental group and level of item difficulty.
There was again an interaction of learning condition by difficulty, F(1,65) = 4.023, p = 0.049, ηp2 = 0.058. The whole plus sections group was 7.1% better than the sections only group for the difficult items (p = 0.05, Tukey; d = 0.46). Without taking account of item difficulty, there was a 4.8% percent superiority of the whole plus sections group that was associated specifically with the sagittal orientation. We will suggest later that it is not best to think of the advantage of the whole then sections group on these tests as being confined to the sagittal orientation. It is more accurate to say that the advantage is over a larger set of difficult items, a few of which are highly confusable when shown in the sagittal view.
QUALITATIVE DESCRIPTION: CLUSTER ANALYSIS
With quantitative evidence for the importance of item difficulty in this domain, it was decided to pursue formal methods that would permit a qualitative description of which items were more difficult. Cluster analysis was used for this purpose. It was conducted with the MathWorks 2011, a statistics module of the MATLAB software system (The MathWorks Inc., Natick, MA). The test data from the sections only group as they moved through the learning trials were organized into two-dimensional matrices of test item by test number. Thus, the cluster analyses were aimed at capturing patterns of relative difficulty that extended across learning trials, with the sections only group used as the standard condition.
The cells of the matrices were standard scores (z-scores) of proportions of the sample that identified each structure correctly, calculated over the structures in each test. Standard scores were used in order to emphasize the position of an item relative to the distribution of scores on the test (rather than the raw proportion correct). For example, an item may have had 40% correct early in learning and 70% correct later on, but may have maintained its position relative to the rest of the distribution of scores (e.g., remaining one standard deviation below the mean). Issues related to ceiling effects and the shapes of the distributions were not considered important in this case, because unique statistical thresholds were not being calculated. Standard scores do preserve the shape and relative positions of a distribution of scores.
The data were from the tests in 18 learning trials. The data matrices were set up in two ways, called the structure-only and the structure-view-combination matrices. These corresponded to two ways of defining a test item in the data matrix. The structure-only matrix was organized so that the objects to be clustered (the rows of the matrix), were defined only by neuroanatomical structure. All other variation (e.g., orientation of section) was used to provide data values to determine the clustering (the columns of the matrix). This generated a data matrix with 19 structures by 36 columns of test data (18 trials/orientations x 2 positions).
The structure-view-combination matrix defined the objects as neuroanatomical structures in unique orientations and positions. For example, caudateNucleus_coronal_anterior was an object that might be clustered separately from caudateNucleus_sagittal_medial. With this definition of the objects, each object had data from six tests. This matrix was 58 rows of structure/orientation/position by 6 columns of tests.
Both hierarchical and k-means clustering were explored with the data. It was found that hierarchical clustering had a better fit to the data, and those analyses will be reported here. The clustering algorithm began by computing Euclidean distances between items, and cluster formation used the Ward measurement, which seeks to minimize the squared distances within clusters. After a clustering solution was determined, the standard score input matrices were sorted by cluster and the sorted data were viewed in a heat map (e.g., with highly negative scores red and highly positive scores green). This permitted a ready visualization of the patterns of data detected by the clustering.
Structure-only clustering
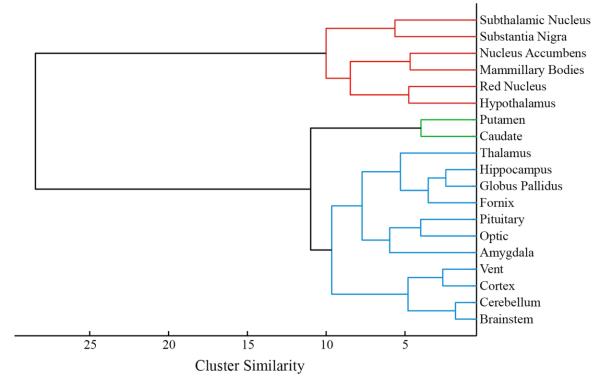
The cluster solution with the structure-only matrix is presented in Figure9. The cophenetic correlation, which measures the goodness of fit between the clustering solution and the initial distances, was 0.825. There was a clear separation into 3 main clusters. The most distinctive cluster was a set of six neuroanatomical structures that were consistently the most difficult to learn. These were hypothalamus, mamillary body, nucleus accumbens, red nucleus, substantia nigra, and subthalamic nucleus. The mean standard score for these structures was -1.29. As shown in Figure 10, all of them are small and compact, occur in laterally symmetric pairs, are near the middle of the brain, and are generally near to each other. Such structures would be easy to miss in an exploration of the brain and would tend to be highly confusable. It should be noted in addition that these 6 structures emerge as uniquely difficult no matter what method of clustering or elementary transformation of the data is used (e.g., raw proportions correct).
Figure 9.
Hierarchical clustering solution for the 19 neuroanatomical structures using test data from the learning trials. The farther that the line that joins two clusters is placed to the left, the more dissimilar the two clusters.
Figure 10.
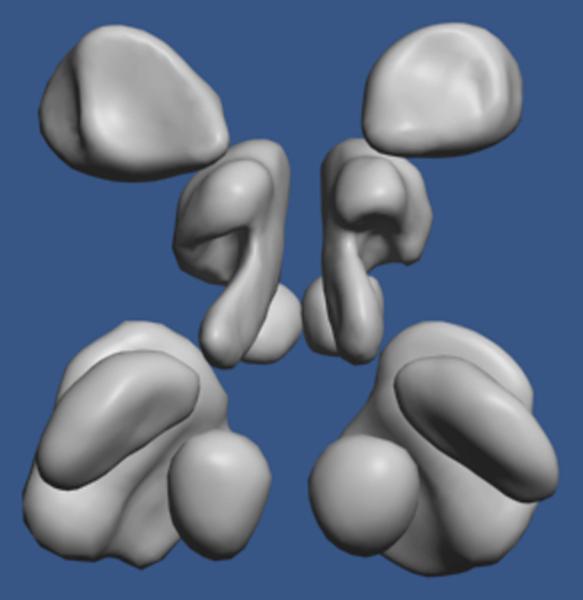
A dorso-posterior view of the six neuroanatomical structures identified as the consistently most difficult to learn and remember. From the top of the image, they are nucleus accumbens, hypothalamus, mammillary body (partially occluded), substantia nigra (partially occluded), subthalamic nucleus, and red nucleus.
The next most distinctive cluster consisted only of the caudate nucleus and the putamen. Visualization in the heat map made it clear why these two structures clustered together. They were both of a moderate level of difficulty overall (mean standard score = -0.08), but they were highly confusable with each other in a sagittal view throughout the learning trials.
A third primary cluster was structures that were of moderate or low difficulty. Within this cluster, a distinctive grouping was formed by the brainstem, cerebellum, cortex, and ventricles (Figure 9). The mean standard score for these structures was 0.75, and it was clear that they were rather easy to learn. They are relatively large structures with distinctive shapes.
Structure-view-combination clustering
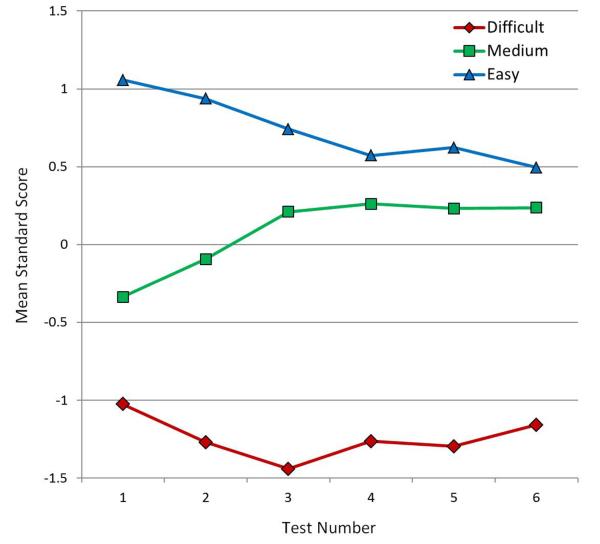
A further cluster analysis was conducted with the structure-view-combination matrix in order to see whether individual sectional views of neuroanatomical structures would fall into different primary clusters. The cophenetic correlation for the hierarchical clustering of the structure-view-combination matrix was 0.785. These data clearly separated into three primary clusters based on relative difficulty. The test items in the difficult cluster were an average of 1.24 standard deviations below the test means (z = -1.24); a cluster of items at medium difficulty were virtually at the test means (z = 0.09); a cluster of relatively easy items averaged 0.74 standard deviations above the test means (z = 0.74).
The cluster of difficult items included nearly all of the sectional samples of the six difficult neuroanatomical structures that emerged from the structure-only matrix. The highly confusable sagittal views of the caudate nucleus and putamen also were in the cluster of difficult items.
The cluster of easier items was highly populated with samples of the four structures that were identified as particularly easy in the structure-only matrix. There were three structures that had all sectional samples cluster in the medium level of difficulty, including amygdala, fornix, and pituitary. Figure 11 shows the change in mean standard score of these three clusters over the six tests. While the medium and easy clusters gradually converge, it is clear that the cluster of difficult items maintains its separation.
Figure 11.
Mean standard scores for the three main clusters from the structure-view-combination data matrix, broken down by test number. [Color figure can be viewed in the online issue which is available at wileyonlinelibrary.com]
An impressive outcome of the clustering with the structure-view-combination matrix was that many neuroanatomical structures had sectional views fall into more than one of the clusters. Three structures (caudate nucleus, putamen, and thalamus), or 16% of the total set of structures, entered into easy, medium, and difficult clusters depending on the particular orientation and position of the sectional sample. Eight of the structures fell into 2 clusters, one of which was always the cluster of medium difficulty. Only 42% of the structures (8 of 19), always were in a single cluster (4 difficult, 3 medium, 1 easy).
The results of the cluster analyses with the learning data are helpful in interpreting the results of the tests of generalization and long term retention. In the tests of long term retention of sectional anatomy, 21.4% of the total set of test items came from the 6 neuroanatomical structures identified in cluster analyses as consistently difficult to learn. However, 65% of the items determined to be difficult in long term retention came from that set of 6 structures. 85% of the test items determined to be difficult in long term retention came from the 6 difficult structures and the highly confusable sagittal views of the caudate nucleus and putamen. In essence, the set of items that were more difficult to learn were also more difficult to retain.
For the tests of generalization to the interpretation of biomedical images, the 6 neuroanatomical structures identified as difficult in the cluster analyses comprised more than double the proportion of difficult test items than their proportion of all test items (Uncued Recognition: 27.2% of the difficult test items; Submit Structure: 59.6% of the difficult test items; Submit Name: 57.9% of the difficult test items). For the Submit Name test (in which structures were indicated by arrows and the participant provided the name), 71.9% of the items that were identified as difficult were the 6 consistently difficult neuroanatomical structures and the confusable sagittal views of the caudate nucleus and putamen. As noted earlier, it was the difficult set of test items that revealed an advantage for the whole then sections group on this test.
ITEM DIFFICULTY IN WHOLE ANATOMY LEARNING
The foregoing determinations of item difficulty were conducted with the data from the sections only condition. An important question for interpreting these analyses is whether the same neuroanatomical structures were relatively difficult in the initial learning of whole anatomy. If the learning data from sectional anatomy learning are averaged over the sectional representations of individual neuroanatomical structures, the correlation between the relative difficulty of learning structures in whole and sectional anatomy can be calculated. Thus, the individual subject performance for two samples of a structure in a single trial of sectional anatomy learning were averaged (e.g., for sections from anterior and posterior views of the cortex). Then the mean percentage correct for each structure was calculated over the first 6 tests of whole anatomy for the whole then sections group and the first 12 tests of sectional anatomy for the sections only group (because sectional anatomy took longer to learn). Using these two sets of global means, there was substantial agreement between the relative difficulty of learning structures in whole and sectional anatomy, r = 0.91, p < 0.001. This result suggests that the spatial characteristics of the neuroanatomical structures, whether or not one is considering sectional samples of those structures, are a major component of the average difficulty of learning to recognize and label them.
It should be noted that although learning whole anatomy before learning sectional anatomy reduced the variation in item difficulty for sectional anatomy learning (shown in statistical interactions of difficulty and condition presented earlier, and graphically in Figure 3), variation in item difficulty was not eliminated. If one looks at sectional anatomy learning in the whole then sections condition, the neuroanatomical structures that were learned most slowly were the six difficult structures identified in the cluster analyses, along with the Caudate and Putamen. Across the first 12 trials of learning sectional anatomy for both conditions, there was substantial agreement in the overall ranking of structure performance between the two groups, r = 0.94, p < 0.001. The eight structures learned most slowly had a mean performance of 72.3% correct in the whole then sections condition and 57.9% correct in the sections only condition. Thus, learning whole before sectional anatomy significantly reduced the burden of learning the more difficult sectional representations of neuroanatomy, but the variation in difficulty was not eliminated.
Behavior Related to Learning Difficult Neuroanatomical Structures
The six neuroanatomical structures that were consistently difficult to learn across the course of the study share several features. Among them are that the structures are relatively small. In an instructional method that features the freedom to explore, it is likely that these structures would be encountered less often in search behavior. It is also possible that they would be explored less often just because learners perceive them to be small, relatively simple, and indistinct. The adaptive character of learning that includes testing and feedback should, in theory, counteract a tendency to neglect small structures just because they are small. However, it is an empirical question as to what human learners actually do. It is possible that in the present study, certain structures are defined as difficult to learn because they are neglected.
The learning programs used in this study recorded extensive information about user interaction. In this paper, we concentrate on the items that have been identified as difficult and ask focused questions about whether or not these items were selected during learning. To this end, data were examined that recorded item selection in the study phase of a learning trial and in the feedback phase of the previous trial. Using this data, a 2 × 2 contingency table was set up for each test item in each test. This table coded whether or not the item was recently selected prior to the test and whether or not the item was identified correctly in the test.
The selection-performance contingencies changed substantially between Trial 1 of sectional anatomy learning and later trials. In Trial 1, there was a relatively large proportion of test items that had been identified as difficult that were not selected in that trial. For the sections only group, 74.6% of the items classified as difficult had not been selected in that trial. For the whole then sections group, 49.2% of the difficult test items were not selected. Clearly, Trial 1 performance with the difficult items is largely driven by the fact that items were not examined, and this is especially true for the sections only group (which was just beginning neuroanatomy learning).
An interesting finding in Trial 1 of sectional anatomy learning was that for the whole then sections group, more than half of the unselected items were recognized correctly in the following test. For 26.5% of the difficult test items (selected or not), the whole then sections group inferred the correct identification without ever selecting the structure during study.
Beginning with Trial 2 of sectional anatomy learning, and continuing thereafter, the proportion of test items classified as difficult that also were not selected fell below 20% of the difficult items and rapidly approached zero. For the sections only group, the response category with the highest proportion of the participants was items that were selected but nonetheless were omitted or mislabeled on the test (58% of the difficult items in Trial 2). The proportion of participants in this category was more than double the proportion of participants in any other category. This result suggests that beginning with Trial 2, the primary source of variation in difficulty was not that participants had not seen the structures. The similarity and apparent confusability of the structures then becomes the more likely source of the difficulty.
DISCUSSION
In a study of computer-based learning of basic neuroanatomy, performance varied extremely across neuroanatomical structures and the sectional representations of them. This was true for the rate of learning to recognize structures in sectional form, later retention of this ability, and the generalization of knowledge to interpreting new biomedical imagery. In addition, the relative effectiveness of instructional methods was more apparent when analytical methods took account of item level difficulty. Mastering whole anatomy before learning sectional anatomy improved early performance by a factor of 1.5 for easier items and a factor of 10 for more difficult items. Identifying structures in biomedical images was more successful for participants when they had learned whole anatomy, and had high spatial ability, but only for the more difficult test items. In every case in which basic measurements were taken, mean test performance differed widely when broken down into more and less difficult items. In the most challenging test of generalization to reading new images (Uncued Recognition), for example, an overall test performance of 43.7% was more usefully seen as 70.1% for half of the items and 13.4% for the other half.
There were two ways in which the statistical separation of item difficulty aided understanding learner performance. In one case, easier items did not present sufficient challenge to learners for differences between learning methods to be clear. In the measurements of initial transfer of learning just noted, for example, easier items learned in the control group left little room for improvement. It was the subset of more difficult items that challenged learning and better revealed the benefits of transfer of learning from whole to sectional anatomy. In the second case, when measuring overall levels of performance, the more difficult items sometimes lead to especially low mean performance. Separating the more typical items from the difficult items gave a more encouraging picture of the performance that had been obtained, sometimes for a substantial majority of the test items (Figure 6).
A further outcome of this investigation was demonstration that the difficulty of individual items is sometimes not captured by a parametric breakdown of the domain according to physical parameters (in this case into sets of structures, types of images, sectional orientations, and positions of sections). Several neuroanatomical structures had sectional samples that fell across the spectrum of levels of difficulty identified by cluster analyses, with unique combinations of physical variables apparently responsible for the differences. The head of the caudate nucleus seen in an anterior coronal section is far easier to learn than is a middle section of the caudate seen in a sagittal section. It is ultimately psychological variables such as perceptual salience, item distinctiveness, and match to existing representations that determine difficulty, and there is no simple function of physical variables that maps directly to these psychological values.
On the other hand, it is possible to determine empirically what is difficult and what is not for learning in this domain. It then can be seen that because the caudate and putamen are close together and consistently lateral to each other, they will commonly be confused in a sagittal section. Instruction then can target the confusable structures that emerge from particular combinations of physical variables.
Finally, this study demonstrated in the domain of basic neuroanatomy that certain anatomical structures may be consistently difficult to learn and that it may be possible to describe this set of items in a way that points to improved methods of instruction. In the present study, there was a consistently difficult set of test items formed from a subset of neuroanatomical structures: hypothalamus, mamillary body, nucleus accumbens, red nucleus, substantia nigra, and subthalamic nucleus. These are all small and generally ovoid structures. They occur in laterally symmetric pairs, and they are located fairly near to each other in the subcortex. Analysis of learning behavior suggested that part of the challenge with these structures is that they are small and indistinct. Learners begin their examination of neuroanatomy elsewhere. On the other hand, these structures are relatively difficult to learn even after learners have begun to pay attention to them. This is likely due to their being similar to each other and, as a consequence, easily confused. Future efforts to develop neuroanatomy instruction should include a focus on this set of items. Attention to context, including relations to distinctive landmarks, and to spatial relations among the structures, should increase the efficiency of differentiating and recognizing them. In the present study, presenting whole brain anatomy before sectional anatomy went part of the way toward instruction of this type. The data suggest, however, that there is room for improvement. More generally, analysis of item difficulty in the context of exploratory learning can lead to targeted methods of instruction in which support is given specifically to items that have proven to be uniquely challenging to learn.
In regard to the published research literature, the level of challenge presented to participants in studies of computer-based learning of anatomy is generally considered only as brief comments in discussion sections (Garg et al., 2002; Luursema et al., 2006; Nicholson et al., 2006; Levinson et al., 2007; Keedy et al., 2011). This limitation is problematic in the first place due to the challenging character of learning in biomedical disciplines. If the materials and situations in studies do not match those in instruction, then it is unknown whether conclusions drawn from the studies are applicable to instruction. The present data make an empirical case that the degree of challenge in learning can affect the outcomes of tests of instructional methods. One can expect these results to generalize to a variety of factors that affect difficulty, such as the number of items to be learned, spatial complexity, the expertise of the learner, performance criteria, and the manner in which knowledge is tested. Indeed, a significant limitation of the present study is that it has focused only on item effects and has not addressed these many other factors related to the level of challenge in instruction.
CONCLUSION
New instructional technologies and advances in the study of learning and memory have promise to support further development of educational practice in biomedical disciplines. We have shown in this paper that items to be learned may vary greatly in their level of difficulty, and the effects of instructional practice may look different depending on the levels of difficulty in the material to be learned. Instructional design and evaluation will be more effective if it takes serious account of the level of challenge for learners in the system under study.
ACKNOWLEDGEMENTS
This research was supported by grant R01 LM008323 from the National Library of Medicine, National Institutes of Health (PI: J. Pani). The authors thank the Surgical Planning Laboratory in the Department of Radiology at Brigham and Women’s Hospital and Harvard Medical School for use of MRI images from the SPL-PNL Brain Atlas. Preparation of that atlas was supported by NIH grants P41 RR13218 and R01 MH050740. The authors also thank the National Library of Medicine for use of the Visible Human 2.0 photographs.
Footnotes
NOTES ON CONTRIBUTORS
JULIA H. CHARIKER, Ph.D., is a postdoctoral scholar in the Department of Psychological and Brain Sciences and the Bioinformatics Core at the University of Louisville, Louisville, Kentucky. She teaches courses in human cognition and learning. Her research combines the psychology of learning and cognition, new information technologies, and collaboration with experts in biology and medicine.
FARAH NAAZ, M.Sc., is a senior graduate student in the Department of Psychological and Brain Sciences at the University of Louisville, Louisville, Kentucky. She teaches the undergraduate course in human perception. Her research focuses on the incorporation of new information technologies into instruction.
JOHN R. PANI, Ph.D., is an associate professor in the Department of Psychological and Brain Sciences and the Bioinformatics Core at the University of Louisville, Louisville, Kentucky. He teaches courses in human cognition, cognitive neuroscience, and learning. His research combines the psychology of learning and cognition, new information technologies, and collaboration with experts in biology and medicine.
LITERATURE CITED
- Ackerman MJ. Accessing the Visible Human project. D-Lib Magazine, Corporation for National Research Initiatives; Reston, VA: [accessed 10 June 2011]. 1995. URL: http://www.dlib.org/dlib/october95/10ackerman.html. [Google Scholar]
- Bennett GK, Seashore HG, Wesman AG. Differential Aptitude Tests® for Personnel and Career Assessment: Space Relations. The Psychological Corporation, Harcourt Brace Jovanovich; San Antonio, TX: 1989. [Google Scholar]
- Chariker JH, Naaz F, Pani JR. Computer-based learning of neuroanatomy: A longitudinal study of learning, transfer, and retention. J Educ Psychol. 2011;103:19–31. doi: 10.1037/a0021680. [DOI] [PMC free article] [PubMed] [Google Scholar]
- Collins JP. Modern approaches to teaching and learning anatomy. BMJ. 2008;337:665–667. doi: 10.1136/bmj.a1310. [DOI] [PubMed] [Google Scholar]
- Cook DA. The research we still are not doing: An agenda for the study of computer-based learning. Acad Med. 2005;80:541–548. doi: 10.1097/00001888-200506000-00005. [DOI] [PubMed] [Google Scholar]
- Crowley RS, Medvedeva O. An intelligent tutoring system for visual classification problem solving. Artif Intell Med. 2006;36:85–117. doi: 10.1016/j.artmed.2005.01.005. [DOI] [PubMed] [Google Scholar]
- Downing SM, Yudkowsky R, editors. Assessment in Health Profession Education. 1st Ed Routledge, Taylor & Francis Group; New York, NY: 2009. p. 336. [Google Scholar]
- El Saadawi GM, Tseytlin E, Legowski E, Jukic D, Castine M, Fine J, Gormley R, Crowley RS. A natural language intelligent tutoring system for training pathologists: Implementation and evaluation. Adv Health Sci Educ Theory Pract. 2008;13:709–722. doi: 10.1007/s10459-007-9081-3. [DOI] [PMC free article] [PubMed] [Google Scholar]
- Friedman CP. The research we should be doing. Acad Med. 1994;69:455–457. doi: 10.1097/00001888-199406000-00005. [DOI] [PubMed] [Google Scholar]
- Garg AX, Norman GR, Eva KW, Spero L, Sharan S. Is there any real virtue of virtual reality?: The minor role of multiple orientations in learning anatomy from computers. Acad Med. 2002;77:S97–S99. doi: 10.1097/00001888-200210001-00030. [DOI] [PubMed] [Google Scholar]
- Hallgren RC, Parkhurst PE, Monson CL, Crewe NM. An interactive, web-based tool for learning anatomic landmarks. Acad Med. 2002;77:263–265. doi: 10.1097/00001888-200203000-00018. [DOI] [PubMed] [Google Scholar]
- Halpern DF. Sex Differences in Cognitive Abilities. 3rd Ed Lawrence Erlbaum Associates; Mahwah, NJ: 2000. p. 440. [Google Scholar]
- Hariri S, Rawn C, Srivastava S, Youngblood P, Ladd A. Evaluation of a surgical simulator for learning clinical anatomy. Med Educ. 2004;38:896–902. doi: 10.1111/j.1365-2929.2004.01897.x. [DOI] [PubMed] [Google Scholar]
- Höhne KH, Petersik A, Pflesser B, Pommert A, Priesmeyer K, Riemer M, Schiemann T, Schubert R, Tiede U, Urban M, Frederking H, Lowndes M, Morris J. Regional, Functional, and Radiological Anatomy (DVD) Springer Electronic Media; New York NY: 2003. Voxel-Man 3D-Navigator: Brain and Skull. [Google Scholar]
- Issenberg SB, McGaghie WC, Petrusa ER, Lee Gordon D, Scalese RJ. Features and uses of high-fidelity medical simulations that lead to effective learning: A BEME systematic review. Med Teach. 2005;27:10–28. doi: 10.1080/01421590500046924. [DOI] [PubMed] [Google Scholar]
- Keedy AW, Durack JC, Sandhu P, Chen EM, O’Sullivan PS, Breiman RS. Comparison of traditional methods with 3D computer models in the instruction of hepatobiliary anatomy. Anat Sci Educ. 2011;4:84–91. doi: 10.1002/ase.212. [DOI] [PubMed] [Google Scholar]
- Keehner M, Hegarty M, Cohen C, Khooshabeh P, Montello DR. Spatial reasoning with external visualizations: What matters is what you see, not whether you interact. Cognit Sci. 2008;32:1099–1132. doi: 10.1080/03640210801898177. [DOI] [PubMed] [Google Scholar]
- Kikinis R, Shenton ME, Iosifescu DV, McCarley RW, Saiviroonporn P, Hokama HH, Robatino A, Metcalf D, Wible CG, Portas CM, Donnino RM, Jolesz FA. A digital brain atlas for surgical planning, model driven segmentation and teaching. IEEE Trans Visual Comput Graph. 1996;2:232–241. [Google Scholar]
- Kockro RA, Stadie A, Schwandt E, Reisch R, Charalampaki C, Ng I, Yeo TT, Hwang P, Serra L, Perneczky A. A collaborative virtual reality environment for neurosurgical planning and training. Neurosurgery. 2007;61:379–391. doi: 10.1227/01.neu.0000303997.12645.26. [DOI] [PubMed] [Google Scholar]
- Levinson AJ, Weaver B, Garside S, McGinn H, Norman GR. Virtual reality and brain anatomy: A randomized trial of e-learning instructional designs. Med Educ. 2007;41:495–501. doi: 10.1111/j.1365-2929.2006.02694.x. [DOI] [PubMed] [Google Scholar]
- Luursema J-M, Verwey WB, Kommers PA, Geelkerken RH, Vos HJ. Optimizing conditions for computer-assisted anatomical learning. Interact Comput. 2006;18:1123–1138. [Google Scholar]
- Malone HR, Syed ON, Downes MS, D’Ambrosio AL, Quest DO, Kaiser MG. Simulation in neurosurgery: A review of computer-based simulation environments and their surgical applications. Neurosurgery. 2010;67:1105–1116. doi: 10.1227/NEU.0b013e3181ee46d0. [DOI] [PubMed] [Google Scholar]
- MathWorks . Accelerating innovations with MATLAB and Simulink. The MathWorks, Inc.; Natick, MA: [accessed 2 October 2011]. 2011. MATLAB Tour 2011. URL: www.mathworks.com. [Google Scholar]
- McNulty JA, Sonntag B, Sinacore JM. Evaluation of computer-aided instruction in a gross anatomy course: A six-year study. Anat Sci Educ. 2009;2:2–8. doi: 10.1002/ase.66. [DOI] [PubMed] [Google Scholar]
- Nering ML, Ostini R, editors. Handbook of Polytomous Item Response Theory Models. 1st Ed Routledge Academics, Taylor & Francis Group; New York, NY: 2010. p. 306. [Google Scholar]
- Nicholson DT, Chalk C, Funnell WR, Daniel SJ. Can virtual reality improve anatomy education? A randomised controlled study of a computer-generated three-dimensional anatomical ear model. Med Educ. 2006;40:1081–1087. doi: 10.1111/j.1365-2929.2006.02611.x. [DOI] [PubMed] [Google Scholar]
- Nowinski WL, Thirunavuukarasuu A, Ananthasubramaniam A, Chua BC, Qian G, Nowinska NG, Marchenko Y, Volkau I. Automatic testing and assessment of neuroanatomy using a digital brain atlas: Method and development of computer- and mobile-based applications. Anat Sci Educ. 2009;2:244–252. doi: 10.1002/ase.106. [DOI] [PubMed] [Google Scholar]
- Petersson H, Sinkvist D, Wang C, Smedby O. Web-based interactive 3D visualization as a tool for improved anatomy learning. Anat Sci Educ. 2009;2:61–68. doi: 10.1002/ase.76. [DOI] [PubMed] [Google Scholar]
- Primal Pictures . 3D Human Anatomy Software. Primal Pictures Ltd; London, UK: [accessed 2 October 2011]. 2007. URL: www.primalpictures.com. [Google Scholar]
- Ratiu P, Hillen B, Glaser J, Jenkins DP. Visible Human 2.0--the next generation. Stud Health Technol Inform. 2003;94:275–281. [PubMed] [Google Scholar]
- Ruiz JG, Cook DA, Levinson AJ. Computer animations in medical education: A critical literature review. Med Educ. 2009;43:838–846. doi: 10.1111/j.1365-2923.2009.03429.x. [DOI] [PubMed] [Google Scholar]
- Singer JD, Willett JB. Applied Longitudinal Data Analysis: Modeling Change and Event Occurrence. 1st Ed Oxford University Press; New York, NY: 2003. p. 672. [Google Scholar]
- Sugand K, Abrahams P, Khurana A. The anatomy of anatomy: A review for its modernization. Anat Sci Educ. 2010;3:83–93. doi: 10.1002/ase.139. [DOI] [PubMed] [Google Scholar]
- Tam MD, Hart AR, Williams S, Heylings D, Leinster S. Is learning anatomy facilitated by computer-aided learning? A review of the literature. Med Teach. 2009;31:e393–e396. doi: 10.1080/01421590802650092. [DOI] [PubMed] [Google Scholar]
- Trelease RB. Anatomical informatics: Millennial perspectives on a newer frontier. Anat Rec. 2002;269:224–235. doi: 10.1002/ar.10177. [DOI] [PubMed] [Google Scholar]
- Trelease RB. Diffusion of innovations: Smartphones and wireless anatomy learning resources. Anat Sci Educ. 2008;1:233–239. doi: 10.1002/ase.58. [DOI] [PubMed] [Google Scholar]
- UW-SIG. University of Washington. Structural Informatics Group. Department of Biological Structure . The digital anatomist information system. University of Washington; Seattle, WA: [accessed 6 September 2011]. 1999. University of Washington. URL: http://sig.biostr.washington.edu/projects/da/ [Google Scholar]
- Winkelman A. Anatomical dissection as a teaching method in medical school: A review of the evidence. Med Educ. 2007;41:15–22. doi: 10.1111/j.1365-2929.2006.02625.x. [DOI] [PubMed] [Google Scholar]
- Yeung JC, Fung K, Wilson TD. Development of a computer-assisted cranial nerve simulation from the visible human dataset. Anat Sci Educ. 2011;4:92–97. doi: 10.1002/ase.190. [DOI] [PubMed] [Google Scholar]


