

Abstract
The heteroaggregation rates of negatively charged multiwalled carbon nanotubes (CNTs) and positively charged hematite nanoparticles (HemNPs) were obtained over a broad range of nanoparticle distributions using time-resolved dynamic light scattering (DLS). Binary systems comprising CNTs and HemNPs were prepared using low ionic strength solutions to minimize the concurrent occurrence of homoaggregation. In order to elucidate the mechanisms of heteroaggregation, the structures of CNT–HemNP aggregates were observed using cryogenic transmission electron microscopy (cryo-TEM). An initial increase in the CNT concentration, while keeping the HemNP concentration constant, resulted in a corresponding increase in the rate of heteroaggregation which occurred through the bridging of HemNPs by CNT strands. At the optimal CNT/HemNP mass concentration ratio of 0.0316, the heteroaggregation rate reached 3.3 times of the HemNP homoaggregation rate in the diffusion-limited regime. Increasing the CNT/HemNP ratio above the optimal value, however, led to a dramatic decrease in the growth rate of heteroaggregates, likely through a blocking mechanism. In the presence of humic acid, the trends in the variation of the heteroaggregation rate with CNT/HemNP ratio were similar to that in the absence of humic acid. However, as the humic acid concentration was increased, the maximum aggregate growth rate decreased due to the lessening in the available surface of the HemNPs that CNTs can attach to through favorable electrostatic interaction.
Introduction
The utilization of carbon nanotubes (CNTs) in consumer products and industrial applications has increased significantly because of their extraordinary mechanical, electrical, and optical properties.1–3 For example, transparent conductive CNT films can potentially replace the brittle and expensive indium tin oxide films that are currently used in touch screens, liquid crystal displays, and solar cells.4, 5 The incorporation of CNTs in bicycle frames, car bodies, and windmill blades not only reduces the weight, but also significantly enhances the mechanical strength of these structures.6
It is possible, therefore, that CNTs can enter aquatic ecosystems during the use and disposal of CNT-containing products.7 Since CNTs have been shown to be toxic to bacteria and mammalian cells,8, 9 the release of these nanotubes into natural aquatic systems can potentially cause adverse impacts on ecosystems and human health. Although the mechanisms of CNT toxicity are still being investigated, results from several studies indicate that the aggregation behavior of these nanomaterials is likely an important parameter that influences their toxicity.9, 10
Recently, some studies have been conducted to investigate homoaggregation (that is, aggregation between the same type of colloidal particles) of CNTs in aquatic environments.11–15 It was observed that the homoaggregation behavior of CNTs conformed to the Derjaguin–Landau–Verwey–Overbeek (DLVO) theory for both monovalent and divalent electrolytes.11, 12, 15 Moreover, the colloidal stability of these nanotubes was found to be strongly influenced by the nanotube surface oxygen content12, 15 and solution chemistry, such as pH11, 12 and natural organic matter concentration.11
In a heterogeneous colloidal system, heteroaggregation, or aggregation between different types of colloidal particles, can take place.16–18 This process occurs in natural aquatic systems which contain a wide variety of naturally occurring inorganic, organic, and biological colloids, such as hematite (α-Fe2O3), colloidal organic matter, and microorganisms.19 The presence of heteroaggregates comprising different types of natural occurring colloids in surface waters had been observed through transmission electron microscopy (TEM).16, 19, 20 Since the concentration of natural organic colloids is expected to be much higher than CNTs in natural aquatic systems, heteroaggregation is likely to play a more important role than homoaggregation in determining the fate and transport of CNTs once these nanotubes are released into the environment.21 However, to date, heteroaggregation between CNTs and natural organic colloids has not been investigated.
The objective of this study is to determine the rates of heteroaggregation of CNTs and hematite nanoparticles (HemNPs), a natural organic colloid, over a broad range of nanoparticle distribution using time-resolved dynamic light scattering (DLS). The influence of humic acid, a key component of natural organic matter, on the heteroaggregation rates was also investigated. In addition, the structures of heteroaggregates formed at different nanoparticle distributions were evaluated using cryogenic TEM (cryo-TEM). The combinatorial use of DLS and cryo-TEM allowed the mechanisms of heteroaggregation of CNTs and HemNPs to be elucidated for the first time.
Materials and Methods
Preparation of Multiwalled Carbon Nanotubes and Hematite Nanoparticles
The multiwalled CNTs used in this study were identical to the ones used previously.15 Details for the purification of CNTs through acid treatment and preparation of CNT stock suspension are provided in the Supporting Information (SI) and elsewhere.12, 15 The total organic content (TOC) of the CNT stock suspension was determined to be 1.39 mg/L through combustion catalytic oxidation at 680 °C (TOC-VCSN, Shimadzu, Japan). At this temperature, the CNTs are likely to undergo close to complete combustion.8, 10, 11, 22 HemNPs were synthesized through the forced hydrolysis of FeCl3.23, 24 The concentration of the HemNP stock suspension was determined to be 4.4 g/L through gravimetric analysis.
Characterization of CNTs and HemNPs
The hydrodynamic diameters of CNTs and HemNPs in the stock suspensions were determined using DLS. The structures and size distributions of CNTs and HemNPs were determined through TEM imaging. The electrophoretic mobilities (EPMs) of CNTs and HemNPs were measured with a ZetaPALS analyzer (Brookhaven, Holtsville, NY) at 0.1 mM NaCl and pH 5.2 ± 0.2. Details are provided in the SI. Through XPS analysis,12, 25 the total surface oxygen content of CNTs was determined to be 10.3% in our earlier study.15 The carboxyl groups made up nearly 70% of the total surface oxygen content, while the carbonyl and hydroxyl groups contributed 15% and 10%, respectively.15
Solution Chemistry
A NaCl stock solution was prepared with ACS-grade NaCl and then filtered through a 0.1-μm alumina syringe filter (Anotop 25, Whatman). All aggregation experiments were performed at an unadjusted pH of 5.2 ± 0.2. A humic acid stock solution was prepared by dissolving 12.8 mg of Suwannee River humic acid (Standard II, International Humic Substances Society) in 25 mL of deionized water (Millipore, MA). The mixture was stirred overnight in the dark at room temperature and filtered through a 0.22-μm cellulose acetate membrane filter (Millipore). Following that, the pH of the filtrate was adjusted to 10.3 by using NaOH and stored in the dark at 4 °C. The TOC of the humic acid stock solution was determined to be 203.18 mg/L through UV-persulfate oxidation (Phoenix 800 TOC analyzer, Tekmar-Dohrmann, Mason, OH).
Time-Resolved Dynamic Light Scattering
Time-resolved DLS measurements were conducted to obtain the aggregate hydrodynamic diameters as a function of time when CNTs and HemNPs underwent homoaggregation or heteroaggregation. A light scattering unit comprising an argon laser (Lexel 95, Cambridge Laser) with a wavelength of 488 nm, a photomultiplier tube mounted on a goniometer (BI-200SM, Brookhaven), and a digital correlator (BI-9000AT, Brookhaven) was used to perform time-resolved DLS measurements. The goniometer houses a thermostated index-matching vat filled with a mixture of cis- and trans-decahydronaphthalene that was maintained at 25 °C. All DLS measurements were performed at a laser power of 2–3 W and a scattering angle of 90°. For each measurement, the autocorrelation function was accumulated over 15 s and an intensity-weighted diffusion coefficient was obtained through second-order cumulant analysis (Brookhaven software). The hydrodynamic diameter of the nanoparticles was then calculated using the Stokes-Einstein equation.26 Time-resolved DLS measurements were performed over time periods of between 10 min and 2 h to allow for a large enough increase in hydrodynamic diameter for accurate derivation of homoaggregation and heteroaggregation rates. The detailed procedures for time-resolved DLS measurements for the homoaggregation and heteroaggregation experiments are provided in the SI. All CNT, HemNP, and humic acid concentrations employed for the homoaggregation and heteroaggregation experiments are calculated based on the concentrations of the stock suspensions and solution and the dilution factors used to prepare the diluted suspensions.
Determination of Homoaggregation Kinetics
Before the investigation of heteroaggregation behavior of CNTs and HemNPs, it is necessary to first characterize the colloidal stability of both nanoparticles through homoaggregation experiments. These experiments were conducted at either a CNT concentration of 83 μg/L TOC or HemNP concentration of 0.44 mg/L. Attachment efficiencies, α, were used to quantify the homoaggregation kinetics of CNTs and HemNPs. The determination of α was presented in the SI and elsewhere.27–30 Briefly, α is calculated by normalizing the homoaggregation rate at the electrolyte concentration of interest to that under favorable aggregation conditions. The homoaggregation rates were determined through linear least-square analysis performed on the initial increase in aggregate hydrodynamic diameter, Dh, with time, t. The critical coagulation concentrations (CCCs) of CNTs and HemNPs can then be derived by determining the intersections of extrapolations through reaction-limited and diffusion-limited regimes of the inverse-stability profiles and used to quantify the colloidal stability of both nanoparticles.21
Determination of Heteroaggregation Rates
Time-resolved DLS was employed to determine heteroaggregation rates, (dDh/dt)t→0, in binary suspensions comprising CNTs and HemNPs. The heteroaggregation experiments were performed at a constant HemNP concentration of 0.44 mg/L, while the CNT concentrations were varied from 1 to 28 μg/L TOC. These nanoparticle concentrations resulted in the CNT/HemNP mass concentration ratios (CNT/HemNP ratios) to range from 0.0025 to 0.0632. The TOC content of CNTs was used for the calculation of CNT/HemNP ratios.
Before the heteroaggregation experiments were conducted, scattered light intensities from a HemNP suspension with a concentration of 0.44 mg/L, a CNT suspension with a concentration of 28 μg/L TOC, and a 0.1 mM NaCl solution (with no nanoparticles) were measured using the light scattering unit at the same incident laser intensity (Figure S1 in SI). At these nanoparticle concentrations, the scattered light intensity from the HemNP suspension was significantly higher (by ca. 20 times) than that of the CNT suspension. In comparison to the HemNP suspension, the scattered light intensity of the CNT suspension was only slightly higher than that of the NaCl solution, likely due to the relatively low concentration of CNTs and/or the optical properties of CNTs. Since the nanotube concentration of the CNT suspension (i.e., 28 μg/L TOC) is equal to the highest concentration used for the heteroaggregation experiments and the scattered light intensity contributed by CNTs is proportional to the concentration of nanotubes, these observations show that the scattered light from binary suspensions for all the heteroaggregation experiments was largely contributed by HemNPs. Hence, DLS can be employed to monitor the growth in the hydrodynamic diameter of the heteroaggregates, that is equivalent to the hydrodynamic diameter of HemNPs while they undergo heteroaggregation with CNTs. This approach to determine heteroaggregation rates is similar to that used by Ferretti et al.,31 who measured the time evolution of hydrodynamic diameter of HemNPs in the presence of extracellular polysaccharides.
For each CNT/HemNP ratio, the heteroaggregation rate was determined by performing linear least-square analysis on the increase in aggregate hydrodynamic diameter, Dh, with t. In most cases, the analysis was performed over a time period in that Dh reached 1.3 times of the initial hydrodynamic diameter of HemNPs, Dh,0. In the case of slow heteroaggregation, Dh failed to reach 1.3 Dh,0 and the linear regression was performed instead over a time period of greater than 30 minutes. For all analyses, the y-intercepts of the fitted lines did not exceed 8 nm in excess of Dh,0.
Cryogenic Transmission Electron Microscopy
Cryo-TEM was employed to examine the heteroaggregate structures formed at CNT/HemNP ratios of 0.0025, 0.0316, and 0.1265. The heteroaggregate suspensions were prepared in the same solution chemistry as that used for the heteroaggregation experiments (0.1 mM NaCl and pH 5.2) ca. 15 minutes before the vitrification process. Details for specimen vitrification and cryo-TEM imaging are provided in the SI. Briefly, 10 μL of suspension containing heteroaggregates of interest was deposited on a lacey carbon-coated TEM copper grid. The grid was blotted and vitrified in liquid ethane using an automated vitrification robot (Vitrobot™ Mark IV, FEI). Blotting allowed for the formation of a vitreous film of suspension that was thin enough (ca. 100–200 nm) for electrons to pass through during imaging (Tecnai 12 TWIN TEM, FEI, 100kV). During the imaging process, the temperature of the sample was maintained at ca. −174 °C.
Results and Discussion
Physicochemical Properties of CNTs and HemNPs
Representative TEM images of CNTs and HemNPs are presented in SI Figure 2. The CNTs were generally crooked due to the presence of defects on the tube walls that were formed during acid treatment, while the HemNPs were mostly spherical. High-resolution TEM imaging revealed multiple graphene layers making up the nanotube walls, as well as the angular features of the HemNPs (SI Figure S3). SI Figure S4 presents the length and size distributions of CNTs and HemNPs, respectively. The mean length of CNTs was 376 nm, while the HemNPs had an average diameter of 87 nm. The average hydrodynamic diameters of CNTs and HemNPs obtained from 20 DLS measurements were 109.8 nm (standard deviation of 2.9 nm) and 80.7 nm (standard deviation of 1.8 nm), respectively.
Electrokinetic Properties of CNTs and HemNPs
The average EPM of CNTs prepared in a 0.1 mM NaCl and pH 5.2 solution was −2.09 × 10⁻⁸ m2/(V·s) (standard deviation = 0.53 × 10⁻⁸ m2/(V·s)). The dissociation of surface carboxyl groups of the CNTs is expected to result in the negative surface charge of the nanotubes. Since carbonyl and hydroxide groups are not likely to dissociate at the experimental condition32, 33 and their surface densities are relatively small, both groups are not expected to contribute significantly to the surface charge of CNTs. The average EPM of HemNPs prepared in a 0.1 mM NaCl and pH 5.2 solution was 1.79 × 10⁻⁸ m2/(V·s) (standard deviation = 0.82 × 10⁻⁸ m2/(V·s)). HemNPs are expected to be positively charged in this solution chemistry since their isoelectric point is 9.34, 35
Homoaggregation Kinetics of CNTs and HemNPs
Representative homoaggregation profiles of CNTs and HemNPs at 4 different NaCl concentrations are shown in Figure S5a and b, respectively. For both CNTs and HemNPs, as the NaCl concentration was increased, the initial slope of the aggregation profiles increased until it reached a maximum. The reaction-limited and diffusion-limited regimes can be observed from the inverse-stability profiles for both CNTs and HemNPs (Figure 1), indicating that their aggregation behavior was in qualitative agreement with DLVO theory. In the reaction-limited regime (i.e., α < 1), an increase in NaCl concentration resulted in an increase in the degree of charge screening of the CNTs and HemNPs and reduced the energy barrier to homoaggregation, as reflected by an increase in attachment efficiencies.
FIGURE 1.

Attachment efficiencies of CNTs and HemNPs as functions of NaCl concentration at pH 5.2.
At electrolyte concentrations above the CCCs, the surface charge of both nanoparticles was completely screened and the energy barrier was eliminated. Under such conditions, the nanoparticles undergo diffusion-limited (fast) homoaggregation (i.e., α = 1). A representative cryo-TEM image of a CNT homoaggregate formed in the diffusion-limited regime at 500 mM NaCl shows that the homoaggregate had a loose, net-like structure (SI Figure S6). At pH 5.2, the CCC of CNTs (123.2 mM NaCl) was considerably higher than that of HemNPs (35.7 mM NaCl), indicating that the CNTs were colloidally more stable than the HemNPs. Furthermore, the CCC of CNTs at pH 5.2 was lower than that at pH 7.1 (i.e., 210 mM NaCl15) because fewer carboxyl groups on CNT surfaces are protonated at the lower pH.
CNTs and HemNPs Undergo Exclusive Heteroaggregation at Low NaCl Concentration
Figure 2 presents homoaggregation profiles of CNTs and HemNPs, as well as a heteroaggregation profile of CNTs and HemNPs at a CNT/HemNP ratio of 0.0316. All the profiles were obtained at 0.1 mM NaCl. The HemNP homoaggregation experiment was conducted at the same nanoparticle concentration that was used for all the heteroaggregation experiments (i.e., 0.44 mg/L). The CNT homoaggregation experiment was conducted at a concentration of 83 μg/L TOC, that is ca. 3 times of the highest CNT concentration used for the heteroaggregation experiments (i.e., 28 μg/L TOC). It was necessary to employ an elevated CNT concentration for the CNT homoaggregation experiment because CNTs at a concentration of 28 μg/L TOC did not scatter sufficient light for accurate DLS measurements. Over the time period of 1500 s, no significant increase in hydrodynamic diameter of both CNTs and HemNPs was observed, indicating that these nanoparticles were stable to homoaggregation at 0.1 mM NaCl.
FIGURE 2.
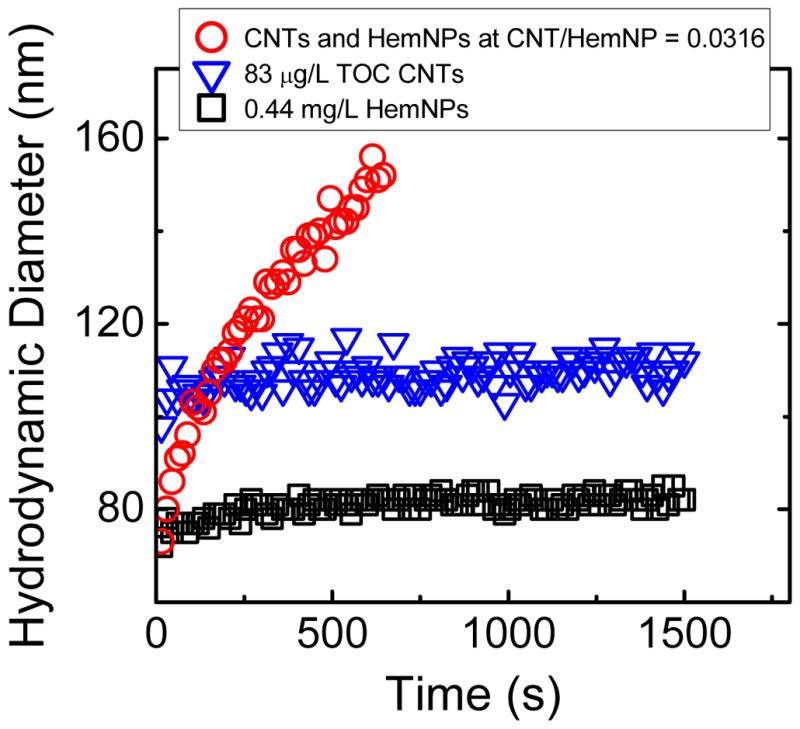
Homoaggregation profiles of CNTs and HemNPs, as well as heteroaggregation profile of CNTs and HemNPs at CNT/HemNP ratio of 0.0316. All the experiments were conducted at 0.1 mM NaCl and pH 5.2.
In contrast to the homoaggregation experiments, when CNTs were introduced into a HemNP suspension to form a binary suspension with final CNT and HemNP concentrations of 14 μg/L TOC and 0.44 mg/L, respectively, (i.e., CNT/HemNP ratio = 0.0316) at 0.1 mM NaCl, the hydrodynamic diameter increased significantly by almost 80 nm over a time period of only 645 s (Figure 2). Because the earlier homoaggregation experiments had shown that both nanoparticles were stable to homoaggregation, we conclude that the substantial rise in hydrodynamic diameter of the aggregates in the binary system was a result of heteroaggregation that had occurred exclusively. Since the CCCs of CNTs and HemNPs were much higher than 0.1 mM NaCl (Figure 1), both nanoparticles experienced a large electrostatic repulsion among the same type of nanoparticles that inhibited homoaggregation. Conversely, the low degree of charge screening at 0.1 mM NaCl allowed for favorable heteroaggregation between oppositely charged CNTs and HemNPs through both electrostatic and van der Waals attraction.
Influence of CNT/HemNP Ratios on Rates of Heteroaggregation
Heteroaggregation experiments were conducted over a range of CNT/HemNP ratios in the presence of 0.1 mM NaCl. Representative heteroaggregation profiles at different CNT/HemNP ratios are shown in Figure 3a, while the rates of heteroaggregation are presented as a function of CNT/HemNP ratio in Figure 3b. For comparison, the homoaggregation rate of HemNPs under diffusion-limited conditions is also presented in Figure 3b. It was noted from Figure 3a that the initial hydrodynamic diameter of the binary suspension with CNT/HemNP ratio of 0.0632, which was the highest ratio used in the heteroaggregation experiments in this study, was equal to the hydrodynamic diameter of HemNPs (ca. 80 nm). This observation confirmed that HemNPs were the dominant light scatterers for all binary suspensions tested.
FIGURE 3.

(a) Heteroaggregation profiles of CNTs and HemNPs at different CNT/HemNP ratios. (b) Heteroaggregation rate of CNTs and HemNPs as a function of CNT/HemNP ratio. Error bars represent standard deviations of at least three replicates. The dashed line represents the homoaggregation rate of HemNPs in the diffusion-limited regime.
At extremely low CNT/HemNP ratios (0.0025), the HemNPs in the binary systems were relatively resistant to aggregation. As the CNT/HemNP ratio increased from 0.0025 to 0.0316, the rate of heteroaggregation increased correspondingly. At the optimal CNT/HemNP ratio of 0.0316, the heteroaggregation rate reached a maximum that was ca. 3.3 times of the diffusion-limited homoaggregation rate of HemNPs. As the CNT/HemNP ratio was further increased above 0.0316, the growth rates of heteroaggregates decreased dramatically until the growth rates approached zero at CNT/HemNP ratios of 0.0500 and higher.
Gregory36 observed a similar trend in the variation of heteroaggregation rates with colloid/polymer ratio in suspensions that contained negatively charged polystyrene colloids and cationic dimethylaminoethyl methacrylate polymers. The heteroaggregation rate obtained at the optimal colloid/polymer ratio under low ionic strength conditions was about twice the colloid homoaggregation rate in the diffusion-limited regime. Gregory36 attributed the fast heteroaggregation to the formation of positively charged polymer patches on the colloid surface which resulted in long-range electrostatic attraction between oppositely charged polymer and uncovered patches on approaching colloids. In our CNT–HemNP system, however, CNTs are rigid37, 38 and much longer than HemNPs, and thus are unlikely to form negatively charged patches on HemNPs.36, 39 Hence, neither patchwise adsorption26 nor charge neutralization39 are expected to be the predominant mechanism resulting in the enhanced heteroaggregation of CNTs and HemNPs at the optimal CNT/HemNP ratio.
In order to investigate the effect of total nanoparticle concentrations on the heteroaggregation rate, additional heteroaggregation experiments were conducted at the optimal CNT/HemNP ratio, but at CNT and HemNP concentrations twice of their respective concentrations used for the previous heteroaggregation experiments (i.e., 28 μg/L TOC CNTs and 0.88 mg/L HemNPs). The heteroaggregate rate obtained from the binary suspension with twice the original concentrations was 0.55 nm/s, which was twice the rate obtained for the original suspension (i.e., 0.26 nm/s). Thus, when the CNT/HemNP ratio is maintained constant, the heteroaggregation rate is proportional to the total concentrations of CNTs and HemNPs.
Cryogenic TEM Imaging of Heteroaggregates
In order to elucidate the role of nanoparticle distribution on the heteroaggregation rates of CNTs and HemNPs, the structures of heteroaggregates were examined at different CNT/HemNP ratios by cryo-TEM. Unlike conventional TEM, cryo-TEM does not require the drying of the sample on a TEM grid which will result in artifacts, such as deformation of aggregates and agglomeration of particles and their aggregates.40, 41 Instead, a grid with a thin film of colloidal suspension is rapidly plunged into liquid ethane (boiling point = −88.6 °C42) to freeze the colloidal sample. The instantaneous freezing of the film of suspension (cooling rate ca. 105 K/s43) ensures that the structure of heteroaggregates in solution is preserved with no alteration.
At a low CNT/HemNP ratio of 0.0025, isolated HemNPs and some small heteroaggregates were observed in the cryo-TEM images. A representative image of a CNT–HemNP heteroaggregate formed at this CNT/HemNP ratio is presented in Figure 4a. In this image, a carbon lace (carbon film) separates two holes, one of which contains a frozen film of heteroaggregate suspension (ice layer) and the other that does not contain a film of suspension (empty region). Because the heteroaggregate sample was deposited on a grid coated with a lacey carbon film, a film of heteroaggregate suspension should form in some of the holes of the carbon film when the sample is blotted/frozen. Since the heteroaggregate is immobilized in an ice layer contained within the holes of the carbon film (instead of being dried and deposited on a carbon film, as is often the case for samples prepared for conventional TEM imaging), the structure of the heteroaggregate is expected to be representative of the heteroaggregate that is suspended in solution.
FIGURE 4.

Representative cryo-TEM images of heteroaggregates at (a) low CNT/HemNP ratio (0.0025), (b) optimal CNT/HemNP ratio (0.0316), and (c) high CNT/HemNP ratio (0.1265) after ca. 15 min of heteroaggregation. (d) Proposed heteroaggregation mechanisms at different nanoparticle distributions.
At the optimal CNT/HemNP ratio of 0.0316, HemNPs were interconnected by multiple strands of CNTs to form extensive and open heteroaggregate structures. A representative image of a heteroaggregate in a frozen film formed over three holes is presented in Figure 4b. It is important to note that the formation of the film of heteroaggregate suspension on the lacey carbon grid was likely to cause the heteroaggregates to collapse into flattened structures with thicknesses similar to that of the film of suspension. It is evident from the “overlapping” of HemNPs within the heteroaggregates (circles in Figure 4b) that about 2 or 3 HemNPs can stack above one another within the ice film, implying that the film thickness was ca. 200 nm. Nevertheless, the flattened structures are still much more representative of the original structures in solution compared to heteroaggregates that have been dried on a TEM grid.
Representative heteroaggregates prepared at a high CNT/HemNP ratio of 0.1265 are presented in Figure 4c. Similar to the heteroaggregates in Figure 4a and b, the heteroaggregates were entrapped in a film of frozen solution that was formed within a hole of a lacey carbon film. These heteroaggregates were frequently observed to comprise a CNT and a HemNP.
Proposed Heteroaggregation Mechanisms of CNTs and HemNPs
On the basis of the results from EPM and DLS measurements, as well as the observations from cryo-TEM imaging, the mechanisms for heteroaggregation of CNTs and HemNPs at different nanoparticle distributions were proposed (Figure 4d). At all CNT/HemNP ratios, HemNPs and CNTs are resistant to homoaggregation due to electrostatic repulsion. At extremely low CNT/HemNP ratios, HemNPs greatly outnumber CNTs. Thus, the chances of a CNT encountering HemNPs are extremely high. Because of the electrostatic and van der Waals attraction between a CNT and a HemNP, every collision between these oppositely charged nanoparticles will initially result in an attachment. However, as multiple HemNPs are attached to a single CNT, less space along the nanotube is available for more HemNPs to attach to. At this point in time, the strand of nanotube that is now lined with HemNPs practically becomes a stable heteroaggregate. This heteroaggregate repels other HemNPs, as well as other CNTs that are lined with HemNPs, and ceases to grow in size. At such a low CNT/HemNP ratio (e.g., 0.0025), however, the occurrence of heteroaggregation is relatively rare due to the low concentration of CNTs. Thus, even though a few heteroaggregates were observed under cryo-TEM, negligible change in hydrodynamic diameter of the suspension was detected through time-resolved DLS.
As the CNT/HemNP ratio increases, the opportunities for HemNPs to encounter CNTs increase correspondingly. Because of the large aspect ratio of CNTs, the nanotubes can effectively bridge HemNPs, akin to the bridging of colloidal particles by long-chain polymers or polyelectrolytes.26, 44 Since most of the CNTs are longer than the theoretical Debye length at an ionic strength of 0.1 mM (i.e., ca. 30 nm),26, 45 the bridging of HemNPs by CNTs can occur even before HemNPs approach close enough to experience significant electrostatic repulsion. This bridging mechanism results in the formation of an extensive network of CNTs and HemNPs. Therefore, the growth rate of heteroaggregates increases as the CNT/HemNP ratio initially increases until it reaches a maximum at the optimal CNT/HemNP ratio of 0.0316.
As the CNT/HemNP ratio is further increased, the number concentration of CNTs greatly exceeds that of HemNPs, resulting in every HemNP to attach to a CNT to form a composite nanoparticle. The negatively charged “nanotubular arms” of a composite nanoparticle can repel the arms of other approaching composite nanoparticles, as well as isolated CNTs, and prevent their attachment to the composite nanoparticle. Since the arms are considerably longer than the hematite constituent of a composite nanoparticle, repulsion between the arms is likely to dominate the interaction between composite nanoparticles. The growth of heteroaggregates is thus inhibited through this blocking mechanism and is reflected by the non-detectable change in hydrodynamic diameter of the heteroaggregates at CNT/HemNP ratios above 0.0500 (Figure 3b).
Influence of Humic Acid on Heteroaggregation Rates
In order to investigate the effects of natural organic matter on the heteroaggregation behavior of CNTs and HemNPs, heteroaggregation experiments were conducted at four humic acid concentrations (0.15, 0.20, 0.25, and 500.00 μg/L TOC). For these experiments, the hematite concentration was kept constant at 0.44 mg/L, while the CNT concentration was varied from 1 to 28 μg/L TOC. The growth rates of aggregates at the four humic acid concentrations are presented as functions of CNT/HemNP ratios in Figure 5a. The heteroaggregation rates obtained in the absence of humic acid are also included for comparison.
FIGURE 5.

(a) Heteroaggregation rate of CNTs and HemNPs as a function of CNT/HemNP ratio at different humic acid (HA) concentrations. The rates in the absence of humic acid are reproduced from Figure 3b. The dash line represents the homoaggregation rate of HemNPs in the diffusion-limited regime. (b) Electrophoretic mobilities (EPMs) of CNTs and HemNPs at 0.1 mM NaCl and pH 5.2 in the presence of humic acid.
Generally, the trends in the variation of the aggregate growth rate with CNT/HemNP ratio at different humic acid concentrations are similar to that in the absence of humic acid. Specifically, the aggregate growth rate increases with an initial increase in CNT/HemNP ratio, reaches a maximum at an optimal CNT/HemNP ratio, and then decreases as the CNT/HemNP ratio is further increased. It is also observed that as the humic acid concentration increases, the maximum aggregate growth rate decreases. Similarly, within the higher range of CNT/HemNP ratios (> 0.02), an increase in humic acid concentration from 0 to 500.00 μg/L TOC resulted in a decrease in the aggregate growth rate at each CNT/HemNP ratio. Within the lower range of CNT/HemNP ratios (< 0.01), in contrast, the presence of humic acid with concentrations between 0.15 and 0.25 μg/L TOC elevated the aggregate growth rate at each CNT/HemNP ratio. At the highest humic acid concentration employed (500.00 μg/L TOC), no increase in aggregate size was detected regardless of the CNT/HemNP ratio.
In order to elucidate the effect of humic acid on the heteroaggregation behavior of CNTs and HemNPs, the EPMs of both nanoparticles were measured at the same humic acid concentrations employed for the heteroaggregation experiments (Figure 5b). As the humic acid concentration was increased from 0 to 0.25 μg/L TOC, the EPMs of HemNPs became noticeably less positive due to the increasing adsorption of humic acid macromolecules that contained negatively charged carboxyl functional groups. When the humic acid concentration was further raised to 500.00 μg/L TOC, the EPM of HemNPs decreased to −3.01 × 10⁻⁸ m2/(V·s), indicating that sufficient humic acid macromolecules had adsorbed on the HemNPs to cause charge reversal to take place. The results imply that HemNPs were not completely coated with humic acid at humic acid concentrations lower than 0.25 μg/L TOC and that the fraction of HemNP surface that remained uncoated decreased with increasing humic acid concentrations. At the highest humic acid concentration of 500.00 μg/L TOC, a significant fraction of HemNP surface was likely to be coated with humic acid. Conversely, an increase in humic acid concentration from 0 to 500.00 μg/L TOC had no significant effect on the EPM of CNTs, which was also observed by Saleh et al.,11 possibly because the charge densities of CNTs and humic acid were very similar.
On the basis of the results from EPM measurements, an increase in humic acid concentration from 0 to 0.25 μg/L TOC will result in a decrease in the uncoated, positively charged HemNP surface that CNTs can attach to through favorable electrostatic interaction. Within the higher range of CNT/HemNP ratios (> 0.02), the reduction in favorable electrostatic interaction between CNTs and HemNPs with increasing humic acid concentration was evident from the decrease in the aggregate growth rate at each CNT/HemNP ratio (Figure 5a). In this regime in which CNT concentrations were relatively high, HemNPs were more likely to encounter CNTs than other HemNPs. Thus, the growth in aggregate size detected through DLS can be attributed to heteroaggregation.
Within the lower range of CNT/HemNP ratios (< 0.01), the HemNP concentrations were relatively high and HemNP–HemNP interactions were expected to dominate in the binary systems. The increase in humic acid concentration from 0 to 0.25 μg/L TOC will result in an increase in the HemNP surface that will be coated with the macromolecules to form negatively charged patches. Thus, homoaggregation of HemNPs may occur through the attraction of oppositely charged patches on approaching nanoparticles and contribute to the growth in aggregate size that was detected through DLS at the lower range of CNT/HemNP ratios (Figure 5a).
To verify that homoaggregation of HemNPs can occur at low concentrations of humic acid, additional DLS measurements were conducted on suspensions containing only HemNPs at humic acid concentrations of 0.15, 0.20, and 0.25 μg/L TOC (SI Figure S7). At all three humic acid concentrations, the hydrodynamic diameter increased slightly from 80 nm to 90–100 nm over a time period of 2000 s, indicating that slow homoaggregation took place under these conditions. When the same experiments were conducted in the presence of CNTs at the lowest CNT/HemNP ratio used (i.e., 0.0025), the aggregate growth rates were considerably higher than those in the absence of CNTs. Over the same time period, the hydrodynamic diameters increased to 115–170 nm in the presence of CNTs and humic acid (SI Figure S7). The addition of humic acid does not cause CNTs to undergo homoaggregation since the EPMs of CNTs were found to be unchanged (Figure 5b). We therefore conclude that the faster aggregate growth in the presence of CNTs is due to heteroaggregation of CNTs and HemNPs that had occurred concomitantly with the slow homoaggregation of HemNPs. This observation also confirms that both homoaggregation and heteroaggregation contributed to the growth in aggregate size detected through time-resolved DLS at the lower CNT/HemNP ratios (< 0.01). Within this lower range of CNT/HemNP ratios, the faster aggregate growth observed in the presence of humic acid, as shown in Figure 5a, may be due to the bridging of HemNP homoaggregates by CNTs. In contrast, the aggregate growth in the absence of humic acid is slower since the bridging of isolated HemNPs by CNTs is more likely to occur.
At the highest humic acid concentration of 500.00 μg/L, both HemNPs and CNTs were negatively charged (Figure 5b). Thus, they experienced significant electrostatic and electrosteric repulsion26, 29, 46 that inhibited both homoaggregation and heteroaggregation. The stabilization of the binary systems is reflected by the non-detectable growth in aggregate size across the entire range of CNT/HemNP ratios studied (Figure 5a).
Environmental Implications
DLS measurements show that nanoparticle distribution has a significant influence on the heteroaggregation behavior of CNTs and HemNPs. Hence, it is critical to consider this parameter in the modeling and prediction of the fate and transport of CNTs in natural aquatic systems. The presence of humic acid at the highest concentration employed in this study (500.00 μg/L TOC) was found to completely inhibit heteroaggregation regardless of CNT/HemNP ratios. Because the studied humic acid concentrations are smaller than those typically found in freshwater systems, CNTs are anticipated to be mobile in these environments. Due to the wide variety of natural organic colloids present in natural aquatic systems, further heteroaggregation studies between CNTs and other classes of natural organic colloids will be required. In the present study, CNTs with relatively high oxygen content (10.3 %) are employed. Additional investigation on binary systems comprising lowly oxidized CNTs and natural occurring colloids in which homoaggregation and heteroaggregation are expected to occur simultaneously will be needed.
Supplementary Material
Acknowledgments
K.A.H. was funded by the Vietnam Education Foundation and the Johns Hopkins University (JHU) NIEHS Center in Urban Environmental Health (P30ES03819). We acknowledge Dr. Kenneth Livi from the Department of Earth and Planetary Sciences (JHU) for performing high-resolution TEM imaging of the CNTs and HemNPs. We thank Drs. Howard Fairbrother, Kevin Wepasnick, and Billy Smith from the Department of Chemistry (JHU) for preparing the CNTs and characterizing them with the XPS.
Footnotes
Supporting Information Available
Additional figures and details for Materials and Methods are presented. This material is available free of charge via the Internet at http://pubs.acs.org.
Literature Cited
- 1.Endo M, Hayashi T, Kim YA, Terrones M, Dresselhaus MS. Applications of carbon nanotubes in the twenty-first century. Philosophical Transactions of the Royal Society of London Series a-Mathematical Physical and Engineering Sciences. 2004;362(1823):2223–2238. doi: 10.1098/rsta.2004.1437. [DOI] [PubMed] [Google Scholar]
- 2.Aitken RJ, Chaudhry MQ, Boxall ABA, Hull M. Manufacture and use of nanomaterials: current status in the UK and global trends. Occupational Medicine-Oxford. 2006;56(5):300–306. doi: 10.1093/occmed/kql051. [DOI] [PubMed] [Google Scholar]
- 3.Paradise M, Goswami T. Carbon nanotubes - Production and industrial applications. Materials & Design. 2007;28(5):1477–1489. [Google Scholar]
- 4.Kumar A, Zhou CW. The Race To Replace Tin-Doped Indium Oxide: Which Material Will Win? ACS Nano. 2010;4(1):11–14. doi: 10.1021/nn901903b. [DOI] [PubMed] [Google Scholar]
- 5.Transparent conductive films. 2011 Jul 31; http://www.unidym.com/products/transparent.html.
- 6.Amroy. 2011 Jul 31; http://www.amroy.fi/index.php.
- 7.Petersen EJ, Zhang L, Mattison NT, O’Carroll DM, Whelton AJ, Uddin N, Nguyen T, Huang Q, Henry TB, Holbrook RD, Chen KL. Potential Release Pathways, Environmental Fate, And Ecological Risks of Carbon Nanotubes. Environmental Science & Technology. 2011;45(23):9837–9856. doi: 10.1021/es201579y. [DOI] [PubMed] [Google Scholar]
- 8.Kang S, Herzberg M, Rodrigues DF, Elimelech M. Antibacterial effects of carbon nanotubes: Size does matter. Langmuir. 2008;24(13):6409–6413. doi: 10.1021/la800951v. [DOI] [PubMed] [Google Scholar]
- 9.Johnston HJ, Hutchison GR, Christensen FM, Peters S, Hankin S, Aschberger K, Stone V. A critical review of the biological mechanisms underlying the in vivo and in vitro toxicity of carbon nanotubes: The contribution of physico-chemical characteristics. Nanotoxicology. 2010;4(2):207–246. doi: 10.3109/17435390903569639. [DOI] [PubMed] [Google Scholar]
- 10.Kang S, Mauter MS, Elimelech M. Physicochemical determinants of multiwalled carbon nanotube bacterial cytotoxicity. Environmental Science & Technology. 2008;42(19):7528–7534. doi: 10.1021/es8010173. [DOI] [PubMed] [Google Scholar]
- 11.Saleh NB, Pfefferle LD, Elimelech M. Aggregation Kinetics of Multiwalled Carbon Nanotubes in Aquatic Systems: Measurements and Environmental Implications. Environmental Science & Technology. 2008;42(21):7963–7969. doi: 10.1021/es801251c. [DOI] [PubMed] [Google Scholar]
- 12.Smith B, Wepasnick K, Schrote KE, Cho HH, Ball WP, Fairbrother DH. Influence of Surface Oxides on the Colloidal Stability of Multi-Walled Carbon Nanotubes: A Structure-Property Relationship. Langmuir. 2009;25(17):9767–9776. doi: 10.1021/la901128k. [DOI] [PubMed] [Google Scholar]
- 13.Smith B, Wepasnick K, Schrote KE, Bertele AH, Ball WP, O’Melia C, Fairbrother DH. Colloidal Properties of Aqueous Suspensions of Acid-Treated, Multi-Walled Carbon Nanotubes. Environmental Science & Technology. 2009;43(3):819–825. doi: 10.1021/es802011e. [DOI] [PubMed] [Google Scholar]
- 14.Petosa AR, Jaisi DP, Quevedo IR, Elimelech M, Tufenkji N. Aggregation and Deposition of Engineered Nanomaterials in Aquatic Environments: Role of Physicochemical Interactions. Environmental Science & Technology. 2010;44(17):6532–6549. doi: 10.1021/es100598h. [DOI] [PubMed] [Google Scholar]
- 15.Yi P, Chen KL. Influence of Surface Oxidation on the Aggregation and Deposition Kinetics of Multiwalled Carbon Nanotubes in Monovalent and Divalent Electrolytes. Langmuir. 2011;27(7):3588–3599. doi: 10.1021/la104682b. [DOI] [PubMed] [Google Scholar]
- 16.Buffle J, Wilkinson KJ, Stoll S, Filella M, Zhang JW. A generalized description of aquatic colloidal interactions: The three-colloidal component approach. Environmental Science & Technology. 1998;32(19):2887–2899. [Google Scholar]
- 17.Yu WL, Matijevic E, Borkovec M. Absolute heteroaggregation rate constants by multiangle static and dynamic light scattering. Langmuir. 2002;18(21):7853–7860. [Google Scholar]
- 18.Lin W, Kobayashi M, Skarba M, Nu CD, Galletto P, Borkovec M. Heteroaggregation in binary mixtures of oppositely charged colloidal particles. Langmuir. 2006;22(3):1038–1047. doi: 10.1021/la0522808. [DOI] [PubMed] [Google Scholar]
- 19.Buffle J, Leppard GG. Characterization of Aquatic Colloids and Macromolecules .1. Structure and Behavior of Colloidal Material. Environmental Science & Technology. 1995;29(9):2169–2175. doi: 10.1021/es00009a004. [DOI] [PubMed] [Google Scholar]
- 20.Wilkinson KJ, Stoll S, Buffle J. Characterization of Nom-Colloid Aggregates in Surface Waters - Coupling Transmission Electron-Microscopy Staining Techniques and Mathematical-Modeling. Fresenius Journal of Analytical Chemistry. 1995;351(1):54–61. [Google Scholar]
- 21.Chen KL, Smith BA, Ball WP, Fairbrother DH. Assessing the colloidal properties of engineered nanoparticles in water: case studies from fullerene C(60) nanoparticles and carbon nanotubes. Environmental Chemistry. 2010;7(1):10–27. [Google Scholar]
- 22.Scheibe B, Borowiak-Palen E, Kalenczuk RJ. Oxidation and reduction of multiwalled carbon nanotubes - preparation and characterization. Materials Characterization. 2010;61(2):185–191. [Google Scholar]
- 23.Mylon SE, Chen KL, Elimelech M. Influence of natural organic matter and ionic composition on the kinetics and structure of hematite colloid aggregation: Implications to iron depletion in estuaries. Langmuir. 2004;20(21):9000–9006. doi: 10.1021/la049153g. [DOI] [PubMed] [Google Scholar]
- 24.Chen KL, Mylon SE, Elimelech M. Aggregation kinetics of alginate-coated hematite nanoparticles in monovalent and divalent electrolytes. Environmental Science & Technology. 2006;40(5):1516–1523. doi: 10.1021/es0518068. [DOI] [PubMed] [Google Scholar]
- 25.Cho HH, Smith BA, Wnuk JD, Fairbrother DH, Ball WP. Influence of surface oxides on the adsorption of naphthalene onto multiwalled carbon nanotubes. Environmental Science & Technology. 2008;42(8):2899–2905. doi: 10.1021/es702363e. [DOI] [PubMed] [Google Scholar]
- 26.Elimelech M, Gregory J, Jia X, Williams RA. Particle Deposition and Aggregation: Measurement, Modelling and Simulation. Butterworth-Heinemann; Oxford, England: 1995. [Google Scholar]
- 27.Chen KL, Elimelech M. Aggregation and Deposition Kinetics of Fullerene (C60) Nanoparticles. Langmuir. 2006;22(26):10994–11001. doi: 10.1021/la062072v. [DOI] [PubMed] [Google Scholar]
- 28.Holthoff H, Egelhaaf S, Borkovec M, Schurtenberger P, Sticher H. Coagulation rate measurements of colloidal particles by simultaneous static and dynamic light scattering. Langmuir. 1996;12(23):5541–5549. [Google Scholar]
- 29.Huynh KA, Chen KL. Aggregation Kinetics of Citrate and Polyvinylpyrrolidone Coated Silver Nanoparticles in Monovalent and Divalent Electrolyte Solutions. Environmental Science & Technology. 2011;(45):5564–5571. doi: 10.1021/es200157h. [DOI] [PMC free article] [PubMed] [Google Scholar]
- 30.Liu X, Wazne M, Chou T, Xiao R, Xu S. Influence of Ca2+ and Suwannee River Humic Acid on aggregation of silicon nanoparticles in aqueous media. Water Research. 2011;45(1):105–112. doi: 10.1016/j.watres.2010.08.022. [DOI] [PubMed] [Google Scholar]
- 31.Ferretti R, Stoll S, Zhang JW, Buffle J. Flocculation of hematite particles by a comparatively large rigid polysaccharide: schizophyllan. Journal of Colloid and Interface Science. 2003;266(2):328–338. doi: 10.1016/s0021-9797(03)00527-7. [DOI] [PubMed] [Google Scholar]
- 32.Carey FA, Sundberg RJ. Advanced Organic Chemistry Part B: Reactions and Synthesis. Springer; US: 2007. [Google Scholar]
- 33.Schwarzenbach RP, Gschwend PM, Imboden DM. Environmental Organic Chemistry. John Wiley & Sons, Inc; 2003. [Google Scholar]
- 34.Zhang JW, Buffle J. Kinetics of Hematite Aggregation by Polyacrylic-Acid - Importance of Charge Neutralization. Journal of Colloid and Interface Science. 1995;174(2):500–509. doi: 10.1006/jcis.1998.5864. [DOI] [PubMed] [Google Scholar]
- 35.Chen KL, Mylon SE, Elimelech M. Enhanced aggregation of alginate-coated iron oxide (hematite) nanoparticles in the presence of calcium, strontium, and barium cations. Langmuir. 2007;23(11):5920–5928. doi: 10.1021/la063744k. [DOI] [PubMed] [Google Scholar]
- 36.Gregory J. Rates of Flocculation of Latex Particles by Cationic Polymers. Journal of Colloid and Interface Science. 1973;42(2):448–456. [Google Scholar]
- 37.Treacy MMJ, Ebbesen TW, Gibson JM. Exceptionally high Young’s modulus observed for individual carbon nanotubes. Nature. 1996;381(6584):678–680. [Google Scholar]
- 38.Falvo MR, Clary GJ, Taylor RM, Chi V, Brooks FP, Washburn S, Superfine R. Bending and buckling of carbon nanotubes under large strain. Nature. 1997;389(6651):582–584. doi: 10.1038/39282. [DOI] [PubMed] [Google Scholar]
- 39.Kleimann J, Gehin-Delval C, Auweter H, Borkovec M. Super-stoichiometric charge neutralization in particle-polyelectrolyte systems. Langmuir. 2005;21(8):3688–3698. doi: 10.1021/la046911u. [DOI] [PubMed] [Google Scholar]
- 40.Talmon Y. Staining and Drying-Induced Artifacts in Electron-Microscopy of Surfactant Dispersions. Journal of Colloid and Interface Science. 1983;93(2):366–382. [Google Scholar]
- 41.Kilpatrick PK, Miller WG, Talmon Y. Staining and Drying-Induced Artifacts in Electron-Microscopy of Surfactant Dispersions .2. Change in Phase-Behavior Produced by Variation in Ph Modifiers, Stain, and Concentration. Journal of Colloid and Interface Science. 1985;107(1):146–158. [Google Scholar]
- 42.Cui H, Hodgdon TK, Kaler EW, Abezgauz L, Danino D, Lubovsky M, Talmon Y, Pochan DJ. Elucidating the assembled structure of amphiphiles in solution via cryogenic transmission electron microscopy. Soft Matter. 2007;3(8):945–955. doi: 10.1039/b704194b. [DOI] [PubMed] [Google Scholar]
- 43.Siegel DP, Green WJ, Talmon Y. The mechanism of lamellar-to-inverted hexagonal phase transitions: a study using temperature-jump cryo-electron microscopy. Biophysical Journal. 1994;66(2 Part 1):402–414. doi: 10.1016/s0006-3495(94)80790-8. [DOI] [PMC free article] [PubMed] [Google Scholar]
- 44.Hunter RJ. Foundations of Colloid Science. Oxford University Press; Oxford, England: 2002. [Google Scholar]
- 45.Israelachvili J. Intermolecular and Surface Forces. Academic Press; London, England: 1991. [Google Scholar]
- 46.Stankus DP, Lohse SE, Hutchison JE, Nason JA. Environmental Science & Technology. ASAP; Interactions between Natural Organic Matter and Gold Nanoparticles Stabilized with Different Organic Capping Agents. [DOI] [PubMed] [Google Scholar]
Associated Data
This section collects any data citations, data availability statements, or supplementary materials included in this article.