Abstract
Background
Polymyxin B is an old antibiotic with increasing clinical relevance in the treatment of multi-drug resistant Gram-negative bacterial infections. However, current dosing regimens are largely empiric as clinical pharmacological characterization of the drug has been hindered by the lack of assays to measure polymyxin B in human plasma.
Methods
A high performance liquid chromatography-mass spectrometry (LC-MS) assay was developed to quantify polymyxin B1 and B2 in human plasma using pure calibrators. After purification with a solid-phase extraction column, polymyxin B1 and B2 were separated on a C18 column by gradient chromatography with an overall runtime of 12 minutes. Polymyxin B1 and B2 were ionized by positive electron spray ionization and the resulting ions specific to polymyxin B1 and B2 were monitored (selected ion recording).
Results
The dominant ions produced were [M + 2H]2+ at m/z 602.6 and 595.5 for polymyxin B1 and polymyxin B2, respectively. The assay was linear between concentrations of 100 and 2500 ng/ml, with inter-day precision of 5.9% and 3.4% at 100 ng/mL and 5.3% and 4.0% at 2000 ng/ml for polymyxin B1 and polymyxin B2, respectively. Accuracy was 80.2% and 82.2% at 100 ng/mL and 99.9% and 109.6% at 2000 ng/ml for polymyxin B1 and polymyxin B2, respectively. No interference from other drugs commonly administered with polymyxin B was detected. The performance of the assay is affected by gross hemolysis and hyperlipemia. The method was successfully applied to patient samples. Interestingly, in a single patient the ratio of B1 and B2 did not change over a period of 12 hours after administration of the drug.
Conclusions
A simple method for the simultaneous measurement of polymyxin B1 and polymyxin B2 in human plasma is described, which has the potential to optimize clinical use of this valuable antibiotic by permitting pharmacokinetic studies and therapeutic drug monitoring.
Keywords: Polymyxin B, liquid chromatography-mass spectrometry, pharmacokinetics, therapeutic drug monitoring, multidrug-resistant gram-negative bacterial infections
Introduction
Polymyxin B is a lipopeptide antibiotic with concentration-dependent bactericidal activity against Gram-negative bacteria. Derived from Bacillus polymyxa (Family Bacillacea), its two major constituents are polymyxin B1 and B2, although more than 30 separate polypeptide components have been identified1. Originally developed for clinical use in the 1950s and 1960s, it was abandoned in favor of less toxic alternatives, including the ß-lactams and aminoglycosides2. The emergence of multidrug-resistant (MDR) Gram-negative bacteria and a dearth of new antibiotics to combat these resistant strains have led to a recent resurgence in the use of parenteral polymyxin B as the last therapeutic option for MDR Gram-negative bacterial infections2–4. However, because polymyxin B has not been widely used or studied for the past fifty years, there is limited knowledge of its pharmacokinetic (PK) and pharmacodynamic (PD) properties2,5. In addition, there is growing evidence that current therapeutic regimens may be inadequate4,6–9. Rigorous PK and PD studies and perhaps therapeutic drug monitoring (TDM) are required to optimize the clinical use of polymyxin B10.
Despite the indication for further pharmacologic characterization of polymyxin B, this analysis has been stalled by the lack of a rapid and accurate means with which to measure polymyxin B in human body fluids. Several methods have been developed to analyze the composition and activity of polymyxin B, but few are suited for the efficient analysis of clinical samples1,11–22. Also, all of these methods base the quantification of polymyxin B1 and polymyxin B2 on calibrators consisting of mixtures of polymyxin Bs rather than pure polymyxin B1 and polymyxin B2, preventing the accurate measurement of these components and their further characterization. This might be misleading because batch-to-batch variation exists in the ratio of the different components23,24.
With these considerations in mind, the objective of this research was to design a rapid high performance liquid chromatography-mass spectrometry (LC-MS) method that quantifies polymyxin B1 and polymyxin B2 in human plasma using pure calibrators. The goal is to use this assay in clinical studies to further characterize the pharmacokinetics of polymyxin B1 and polymyxin B2 in patients so that optimal dosing regimens and TDM strategies can be developed.
Materials and Methods
Chemicals and reagents
Polymyxin B1 (sulfate) and polymyxin B2 (sulfate) were kindly provided by Pfizer (New York, NY, USA). Colistin (sulfate) was purchased from MP Biomedicals (Solon, OH, USA). Formic acid (98–100% purity) was purchased from Sigma-Aldrich (St. Louis, MO, USA). Methanol (HPLC grade) was purchased from Fisher Scientific (Pittsburg, PA, USA). Oasis HLB solid-phase extraction (SPE) cartridges (1 ml, 30mg) were from Waters (Milford, MA, USA). Acetonitrile and water used were LC/MS grade purchased from Fisher Scientific. Blank human ethylenediaminetetraacetic acid (EDTA) plasma was obtained from Innovative Research (Novi, MI, USA).
Equipment
A solid phase extraction manifold, 24 port, Visiprep-DL (Supelco, Bellefonte, PA, USA) was used to perform the extractions. The analysis was conducted on an high performance liquid chromatography-tandem mass spectrometry (LC-MS/MS) system that consisted of a Waters Alliance 2795 separation module with autosampler controlled at 4°C and a Micromass Quattro Micro API triple-quadrupole tandem mass spectrometer (Waters, Milford, MA, USA).
LC/MS Analytical Conditions
An Atlantis dC18, column, 3 μm, 50 mm × 2.1 mm (Waters, Milford, MA, USA) was used for the analysis. Gradient chromatography was performed with 0.1% formic acid in water (A) and 0.1% formic acid in acetonitrile (B) at a flow rate of 0.3 ml/min. The gradient used was 5% B at 0 min; a linear increase to 18% B at 5 min; a hold of 18% B to 5.5 min; a wash with 95% B from 5.5–7.5 min; and equilibration with 5% B from 7.5–12 min. The injection volume was 10 μl.
Samples were detected in positive electron spray ionization mode with selected ion recording. The dominant ions produced were [M + 2H]2+ at m/z 602.6 and 595.5 for polymyxin B1 and polymyxin B2, respectively. The optimal working parameters for the mass spectrometer were as follows: capillary voltage 2.0 kV, desolvation gas flow 600 L/h and temperature 450°C, source temperature 120°C, cone voltage 35 V and 30 V for polymyxin B1 and polymyxin B2 respectively. No significant product ions were detected. All data were acquired and processed using MassLynx 4.1 software (Waters, Milford, MA, USA).
Preparation of Standard Solutions
A primary stock solution of 1000 μg/ml polymyxin B1 and polymyxin B2 (as sulfate) was prepared in LC/MS grade water. Standard solutions with polymyxin B concentrations of 100 μg/ml, 10 μg/ml and 1 μg/ml were prepared by serial solution of the primary stock standard in 0.1% formic acid in LC/MS grade water. All solutions were stored at −80°C.
Preparation of Calibration Standards and Quality Control Samples
Calibrators were prepared on the day of analysis by spiking 250 μl of blank EDTA plasma with the appropriate amount of polymyxin B standard solutions to obtain final concentrations of 100, 250, 500, 1000, 1500, and 2500 ng/ml in plasma. Quality control (QC) samples in EDTA plasma were prepared using standard solutions to provide final concentrations of 400 and 2000 ng/ml for the polymyxin B analytes. The calibrators and QC samples were diluted with 850 μL of water and mixed by vortex. After conditioning with 1 ml of methanol followed by 2 × 1 ml of water, 950 μl of each sample mixture was loaded onto an SPE column. The solutions were allowed to run through by gravity followed by a 1 ml water wash. The compounds were eluted into 2 ml Maximum Recovery LC-MS vials (Waters, Milford, MA, USA) with 1 ml of 0.1% (v/v) formic acid in methanol. The eluted samples were evaporated to dryness under a gentle stream of nitrogen at 45°C and reconstituted in 100 μl of 0.1% (v/v) formic acid in LC/MS grade water.
Clinical Sample Preparation
All plasma samples were stored at −80°C until analysis. After thawing at room temperature (22°C), 250 μl of the plasma sample was diluted with 850 μl of water and mixed by vortex. SPE columns were conditioned, and 950 μl of the mixture was loaded onto a column and processed as described above.
Quantification
Polymyxin B1 and polymyxin B2 in samples and quality controls were quantified using calibration curves between 100 and 2500 ng/mL based on the area under the polymyxin B1 and polymyxin B2 peaks.
Method Validation
The method for quantifying polymyxin B1 and polymyxin B2 was validated for linearity, accuracy, precision, recovery, stability, and matrix effect. Interference from hemolysis, hyperlipemia and drugs which might be administered in combination with polymyxin B was also evaluated.
Linearity was determined by analyzing three different calibration curves prepared and run on three different days. Six point calibration curves in the range of 100–2500 ng/ml were produced by plotting the peak areas of polymyxin B1 and polymyxin B2 versus the concentrations of the calibrators. A weighted linear regression (weighting factor 1/x) was used to fit the calibration curve. Acceptance criteria were correlation coefficients of 0.99 or better and residuals within 15% at all calibration levels.
Accuracy and precision of the method were evaluated by analyzing three levels of QC samples (100,_ 400 and 2000 ng/mL) in sets of five replicates on five consecutive days. A calibration curve was included each day. Accuracy was required to be within ±15% and intra-day and inter-day precision below 15%.
Stability was investigated for two levels of QC samples (400 and 2000 ng/mL; n = 3) during storage for 24 h at 22°C, 72 h at 4°C, 90 days at −80°C and during three repetitive freeze-thawing cycles.
The extraction recovery was evaluated by comparing the peak areas of the analytes in blank plasma spiked before the SPE procedure with those of blank plasma spiked after the SPE procedure. The recovery studies were conducted for polymyxin B1 and polymyxin B2 at 2000 ng/mL, five replicates each. The matrix effect, and therefore ion-suppression or enhancement, was evaluated by comparing the peak area of the analytes dissolved in 0.1% formic acid in water with that of blank plasma spiked with analytes after SPE extraction. The matrix effect was evaluated for polymyxin B1 and polymyxin B2 by analyzing five replicates at 2000 ng/mL.
Interference from drugs was evaluated by spiking QC samples (400 ng/ml polymyxin B1 and polymyxin B2) with drugs likely to be administered to the patient in combination with polymyxin B: vancomycin, gentamicin, tobramycin and meropenem, all at a concentration of 100 μg/ml, and vasopressin at 1000 pg/mL. The areas of the analytes in the spiked samples were compared to the peak areas of the analytes in an unspiked sample. Interference from lipids and hemoglobin was investigated by comparing polymyxin B1 and polymyxin B2 peak areas in samples with increasing concentrations of lipids (Intralipid 25–200 mg/dL) and increasing concentrations of hemoglobin (1,870–11,250 mg/L).
Patient samples
Blood samples were collected from patients who provided written informed consent to participate in a clinical study investigating the pharmacokinetics and pharmacodynamics of polymyxin B. The study was approved by the Institutional Review Board of Columbia University Medical Center. A full concentration-time curve was collected from a 27 year-old Caucasian female patient with cystic fibrosis who was treated with intravenous polymyxin B 1.5 mg/kg administered every 12 h for treatment of Pseudomonas aeruginosa pneumonia. The minimum inhibitory concentration (MIC) of polymyxin B for this organism determined by the Columbia University Medical Center's Microbiology Laboratory was 0.5 mg/L by Etest (bioMerieux Inc., Marcy l'Etoile, France). Actual body weight and height of the patient were 62 kg and 196 cm, respectively, and creatinine clearance calculated using the Cockcroft-Gault equation was 83 mL/min. Samples were collected on the third day of treatment at 0, 3.2, 3.7, 4.3, 5.3, 7.3, 9.3 and 12 h after the start of a 3 h infusion. Blood samples were processed immediately to plasma, and all plasma samples were stored immediately at −80°C until analysis. Noncompartmental analysis of the plasma concentration time data was performed with WinNonlin version 5.3 (Pharsight, Sunnyvale, CA). Trough levels were determined in n=4 additional patients who were receiving intravenous polymyxin B at dose regimens ranging from 1.4 mg/kg/12 h to 1 mg/kg/48h.
Results
Mass Spectroscopy
The positive electrospray ionization produced the dominant ions [M + 2H]2+ at m/z 602.6 and m/z 595.5 for polymyxin B1 and polymyxin B2 respectively. The application of collision energy did produce product ions (241.1 for polymyxin B1 with 101.2 as confirmation ion, and 227.1 for polymyxin B2 with 101.2 as confirmation ion). However, the sensitivity of the assay in MRM mode was less than in SIR mode. The lower limit of quantification of the assay in MRM mode was >100 ng/mL for both polymyxin B1 and B2. The experiments were repeated on an Agilent 6410 triple quadrupole mass spectrometer (Agilent Technologies, Santa Clara, CA, USA). Using this instrument product ions were also observed but sensitivity of the assay in MRM mode was again insufficient.
Liquid Chromatography
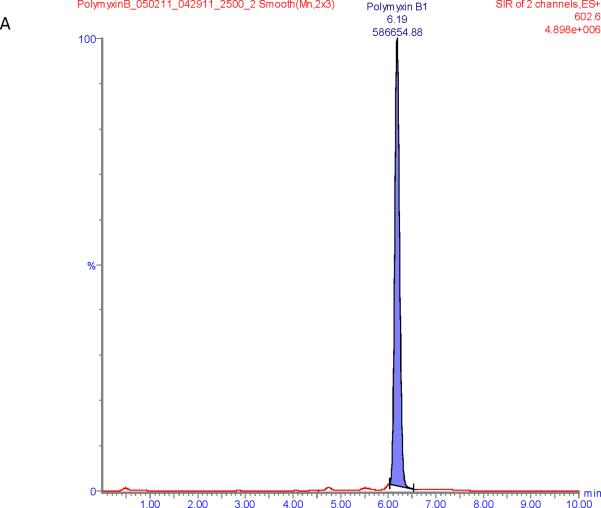
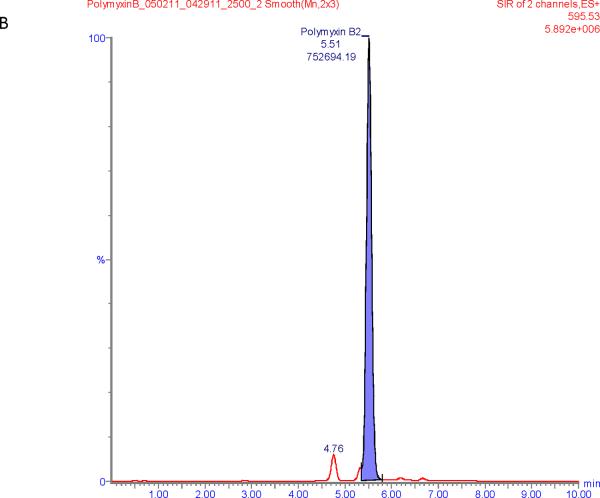
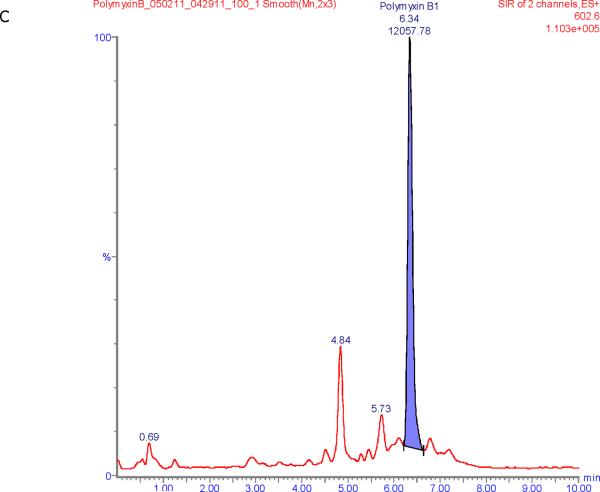
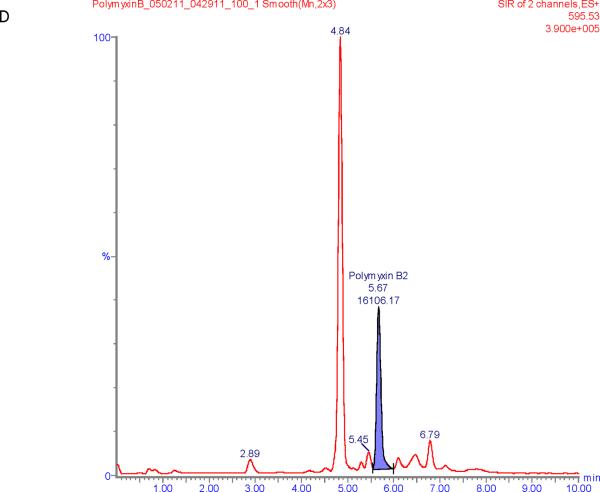
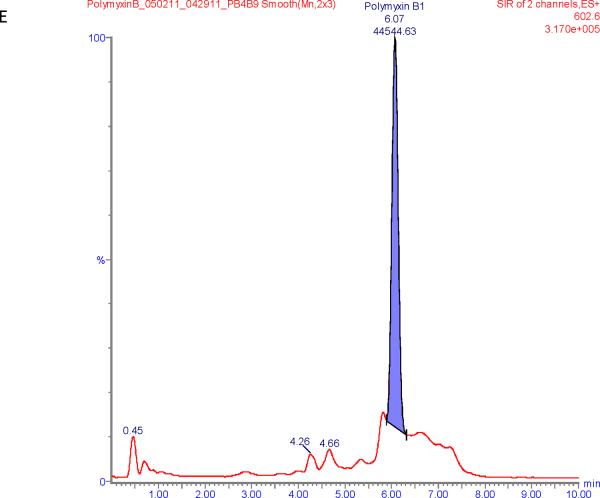
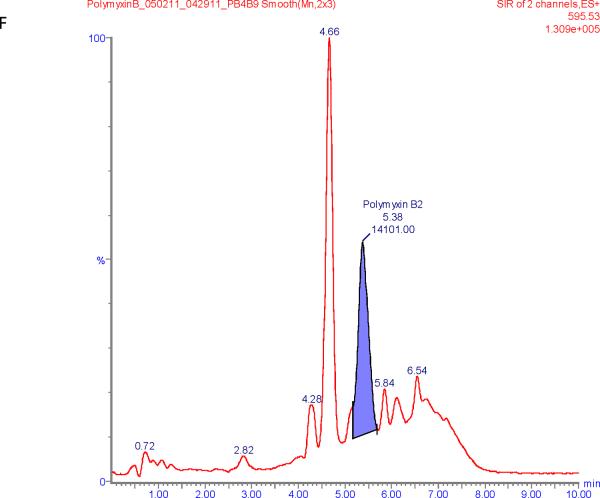
Figure 1 shows chromatograms of polymyxin B calibrators at 100 and 2500 ng/mL and chromatograms of a patient sample. The polymyxin B1 and polymyxin B2 peaks were well separated from other peaks with m/z of 602.6 and 595.5 respectively in the chromatograms of the calibrators with retention times of 6.6 and 5.9 min. Patient samples show more interference (illustrated in Figure 1E and F) but both the polymyxin B1 and polymyxin B2 peaks were integrated well in all of the samples investigated.
Figure 1.
SIR chromatograms of polymyxin B1 and polymyxin B2; Figure A = calibrator with polymyxin B1 plasma concentration of 2500 ng/mL; Figure B = calibrator with polymyxin B2 plasma concentration of 2500 ng/mL; Figure C = calibrator with polymyxin B1 plasma concentration of 100 ng/mL; Figure D = calibrator with polymyxin B2 plasma concentration of 100 ng/mL; Figure E = Patient sample with polymyxin B1 plasma concentration of 615 ng/mL; Figure F = Patient sample with polymyxin B2 plasma concentration of 322 ng/mL.
Linearity
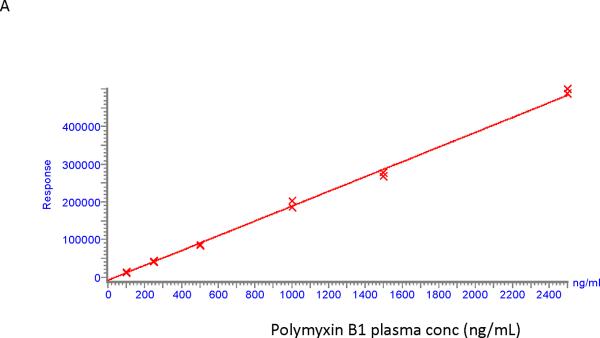
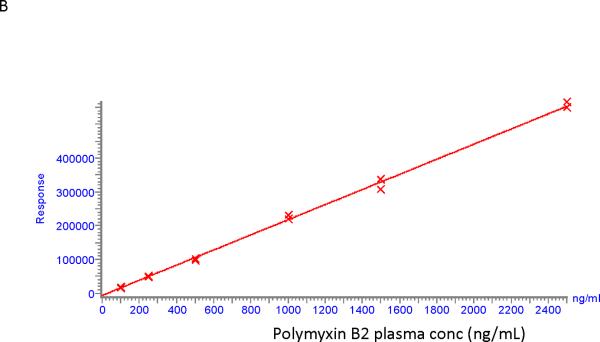
Calibration curves for polymyxin B1 and polymyxin B2 were found to be linear in the concentration range of 100 – 2500 ng/ml. An example of two calibration curves is shown in Figure 2. Correlation coefficients were > 0.99 for polymyxin B1 and polymyxin B2 with residuals of less than 15% at all concentrations.
Figure 2.
Calibration curves for polymyxin B1 (A) and polymyxin B2 (B).
Attempts to use colistin A or B as an internal standard (IS), produced calibration data that were fitted to a polynomial function rather than a linear curve fit. There was significant ionization enhancement at lower concentrations of polymyxin B1 and polymyxin B2 when the IS was present, which became less with increasing concentrations of polymyxin B1 and polymyxin B2. This was independent of the solid phase extraction step and independent of whether colistin A or B was used as the IS. In addition, there was an increase in the peak area of colistin A and B with increasing concentrations of polymyxin B1 and polymyxin B2. When results were calculated without using the IS, a linear curve fit was obtained as indicated above. It was thus decided to continue developing this assay without using an IS.
Sensitivity, Accuracy, and Precision
Mean signal-to-noise ratios were 337 and 67 for polymyxin B1 and polymyxin B2, respectively at a concentration of 100 ng/mL, which was the lowest calibrator that was investigated. In samples from patients not on polymyxin B the signal at the retention time of the peaks of polymyxin B1 and polymyxin B2 multiplied by 5 resulted in concentrations of 11 ± 2 And 3 ± 1 ng/mL for polymyxin B1 and B2 respectively suggesting that the lower limit of quantification is lower than 100 ng/mL. However, given the applied range of calibrators of 100–2500 ng/mL the lower limit of quantification (LOQ) was conservatively set at 100 ng/mL at which the intra-day precision was 2.2% and the inter-day precision 5.9% for polymyxin B1 and 0.9% and 3.4% for polymyxin B2, respectively (n=5). The accuracy was 80.2% and 82.2% at 100 ng/mL, 99.7% and 109.2% at 400 ng/ml and 99.9% and 109.6% at 2000 ng/ml for polymyxin B1 and polymyxin B2, respectively. Intra-day precision (n = 5) was 4.2% and 4.8% at 400 ng/ml and 3.0% and 2.6% at 2000 ng/ml for polymyxin B1 and polymyxin B2, respectively. Inter-day precision (n=5) was 7.2% and 5.2% at 400 ng/ml and 5.3% and 4.0% at 2000 ng/ml for polymyxin B1 and polymyxin B2, respectively.
Recovery and Matrix Effect
Extraction efficiency at 2000 ng/mL was 71±5% for polymyxin B1 and 69±4% for polymyxin B2 (n=5). Ion enhancement at this concentration was 16% for polymyxin B1 and 10% for polymyxin B2.
Interference
There was no substantial interference from any of the drugs investigated on the polymyxin B1 and polymyxin B2 levels (Table 1). Addition of Intralipid® led to a 19 and 24% increase in the area under the concentration-time curve (AUC) of polymyxin B1 and polymyxin B2, respectively, at 400 ng/mL independent of the concentration of Intralipid®. Addition of hemoglobin resulted in a concentration-dependent increase of the measured polymyxin B1 and polymyxin B2 at a level of 400 ng/mL. Hemoglobin concentrations greater than 3,750 mg/L were associated with an increase of greater than 25% for polymyxin B1 (Table 1).
Table 1.
Interference of Polymyxin B1 and B2 with lipids, hemoglobin and various drugs
| Lipids | PMB1 | PMB2 | Hemoglobin | PMB1 | PMB2 | Drug | PMB1 | PMB2 |
|---|---|---|---|---|---|---|---|---|
| (mg/dL) | (% of 0 mg/dL signal) | (mg/L) | (% of 0 mg/dL signal) | (% of 0 mg/L signal) | ||||
| 0 | 100 | 100 | 0 | 100 | 100 | Gentamycin | 90 | 96 |
| 25 | 117 | 123 | 1870 | 105 | 98 | Tobramycin | 98 | 110 |
| 50 | 120 | 121 | 3750 | 123 | 110 | Vancomycin | 83 | 101 |
| 100 | 134 | 140 | 7500 | 156 | 141 | Meropenem | 86 | 99 |
| 200 | 119 | 127 | 11250 | 170 | 144 | Vasopressin | 94 | 104 |
Stability
Stability during storage at various temperatures and during repetitive freeze-thawing cycles is shown in Table 2. Polymyxin B1 and polymyxin B2 are stable for at least 24 h at room temperature (22°C), at least 72 h at 4°C, for at least 3 months at −80°C and during at least three repetitive freeze-thaw cycles.
Table 2.
Stability of Polymyxin B1 and B2
| Polymyxin | B1 | B1 | B2 | B2 |
|---|---|---|---|---|
| Concentration QC (ng/mL) | 399 | 2138 | 400 | 2192 |
| RT for 24h | 94±2% | 94±3% | 99±0% | 97±4% |
| 4°C for 72h | 114±6% | 106±2% | 110±4% | 111±4% |
| −80°C for 90 days | 114±4% | 102±3% | 111±4% | 108±5% |
| 3 freeze/thaw cycle | 107±5% | 100±1% | 112±6% | 109±5% |
Data presented as mean ± standard deviation % of initial value (n=3)
Patient samples
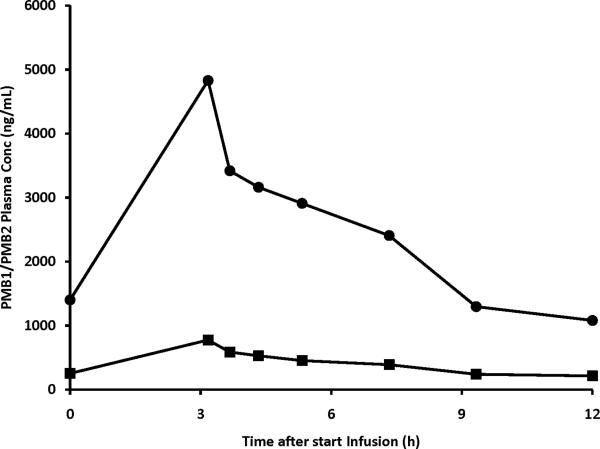
Figure 3 shows polymyxin B1 and polymyxin B2 plasma concentrations in the patient treated with intravenous polymyxin B. All concentrations were above the LOQ of 100 ng/mL. Pre-infusion levels (1402 and 252 ng/mL for polymyxin B1 and polymyxin B2, respectively) were similar to the concentrations at 12 h after start of the infusion (1080 and 214 ng/mL) suggesting that steady state had been reached. The maximum plasma concentration (Cmax) was 4830 and 775 ng/mL for polymyxin B1 and polymyxin B2, respectively. The terminal half-lives of polymyxin B1 and polymyxin B2 were 4.7 and 5.4 h, respectively. Area under the concentration-time curve over 24 h (AUC0–24h) was 29330 and 4903 h*ng/mL for polymyxin B1 and polymyxin B2, respectively. The ratio of polymyxin B2 to polymyxin B1+polymyxin B2 ranged between 0.13 and 0.16, with a mean of 0.15. The combined plasma concentration of polymyxin B1 and polymyxin B2 was higher than the MIC of 0.5 mg/L throughout the entire dosing interval.
Figure 3.
Polymyxin B1 and polymyxin B2 plasma concentration in time in a 27 year-old patient with cystic fibrosis receiving polymyxin B intravenously at a dose of 1.5 mg/kg/12h.
Trough levels of polymyxin B1 and B2, respectively in four additional patients were 854 and 163 ng/mL (Dose 1.4 mg/kg q 24h), 511 and 128 ng/mL (Dose 1.2 mg/kg q 12h), 643 and 160 ng/mL (Dose 1 mg/kg q 24h) and 196 and 74 ng/mL (Dose 1 mg/kg q 48h).
Discussion
A rapid LC-MS assay for the simultaneous measurement of polymyxin B1 and polymyxin B2 in human plasma was developed. The method can be used for pharmacokinetic studies and TDM of polymyxin B and enables optimization of the clinical use of intravenous polymyxin B.
Earlier methods described for the measurement of polymyxin B were either developed for pharmaceutical analysis or they were bio-assays14,15,17,18,20,22. Recently, several methods have been described for the measurement of polymyxin B in plasma, such as high performance liquid chromatography (HPLC)-fluorometry and LC-MS/MS methods11,12,19,25. Similar to earlier methods for colistin, an HPLC-fluorometry method was described for polymyxin B1 and polymyxin B2, which includes solid-phase extraction with on-SPE column derivatization of polymyxin B1 and polymyxin B2 with 9-fluorenylmethyl chloroformate (FMOC-Cl)11. Although this method showed good performance characteristics and was applied successfully to clinical studies26, we were not able to adequately reproduce it in our laboratory. An LC-MS method has been mentioned in the peer-reviewed literature but the details of this method have not been disclosed therein19,25. This method has only been used to measure polymyxin B1 in human plasma, most likely because polymyxin B1 was the only component of which an analytical grade form was available at the time. Recently a sensitive LC-MS/MS method was described by Cheng et al. to measure polymyxin B1 and polymyxin B212. However, this method was only validated in rat plasma, not in human samples.
Reversing the internal standard (polymyxin B1) and the analytes of interest of the method described earlier for colistin by Gobin, et al., we initially started to develop an LC-MS/MS method for polymyxin B1 and polymyxin B2 using colistin as an IS13. Although we used the same LC-MS/MS system as used in that study, we were not able to generate sufficient product ions in the multiple reaction monitoring (MRM) mode as described in the manuscript. The instrument used for our study is serviced periodically and input for the method development was received from the manufacturer._The same problem was experienced using an alternative LC-MS/MS system from a different manufacturer. Sensitivity and ionization are known to differ from instrument to instrument even if it is the same model. On our specific instrument the sensitivity of the polymyxin B assay in the selected ion recording (SIR) mode was better than in MRM mode and we therefore decided to develop the method in the SIR mode. Running their instrument in MRM mode and using polymyxin B1 as an IS, Gobin et al. used a polynomial function rather than a linear regression line to fit their seven-point calibration curve for colistin13. Interestingly, despite running the instrument in SIR rather than MRM mode, and independent of the SPE step, we observed a similar non-linear behavior when using colistin A or B as an IS, strongly suggesting an interaction between colistin and polymyxin B1 and polymyxin B2 on the mass spectrometry level. We therefore decided to further develop the assay without an IS.
Although not validated in human plasma, the LC-MS/MS method described very recently by Cheng et al. seems more sensitive (LOQ 5 ng/mL) than our method12. A reasonable explanation for this difference in sensitivity is that we used a considerably older and less sensitive mass spectrometer. However, this older instrument is still in use in numerous clinical laboratories, and we therefore think that our LC-MS_method, which was validated in human rather than rat plasma, is also useful, especially when it is not possible to develop an LC-MS/MS method. In addition, with a sensitivity of <100 ng/mL, our method is sufficiently sensitive to measure polymyxin B1 and polymyxin B2 in clinical samples.
One of the known problems with an MS method is relatively more interference within the chromatogram, which was indeed observed. However, polymyxin B1 and polymyxin B2 peaks could be quantified in samples from n=5 patients, and specific interference from several concurrently used drugs was excluded. Our data do suggest though that hemolysis and lipemia would alter the levels of polymyxin B1 and polymyxin B2.
The described method is suitable for PK studies. As illustrated, the method is able to generate plasma concentration time data for both polymyxin B1 and polymyxin B2 after an intravenous infusion. Previous methods often only had polymyxin B1 available as an analytical standard and inferred the concentration of the other forms of polymyxin B from this. Quantifying polymyxin B1 and polymyxin B2 separately is relevant as they are the predominant forms of polymyxin B, and most importantly, the ratio of polymyxin B1 and polymyxin B2 can differ from batch to batch and from manufacturer to manufacturer4,23,24. Interestingly, the ratio of polymyxin B1 to polymyxin B2 in the patient presented was relatively stable during the observation period, suggesting similar pharmacokinetics of the two entities.
Our method may also be suitable for therapeutic drug monitoring (TDM) of polymyxin B. In terms of sensitivity the method seems adequate for TDM as the trough levels of both polymyxin B1 and B2 could be determined in all five patient samples that we investigated, with the exception of polymyxin B2 in one patient who received a relatively low dose at a relatively long dose interval. Little is known about the application of TDM to polymyxin B. For the other clinically used polymyxin, colistin, the British National Formulary (BNF) recommends monitoring of the serum concentration, especially in renal impairment, cystic fibrosis, and neonates, with a target peak concentration (30 minutes after intravenous administration) of 10–15 mg/L10. Couet et al concluded that colistin concentration monitoring may be advisable to provide security for clinicians when, at the same time, they are encouraged to increase colistin dosing regimens27. Structurally, polymyxin B differs from colistin by only one amino acid, and it has shown concentration-dependent killing similar to colistin4,28. In an in vitro static system, polymyxin B was rapidly bactericidal at super-MIC concentrations against four P. aeruginosa strains (MICs 0.5–1 mg/L)5. Regrowth was noted in these time-kill studies. The post-antibiotic effect was not assessed in this study. Using an in vitro hollow-fibre PD infection model with a simulated dose of 2.5 mg/kg/day and half-life of 6 h, polymyxin B showed an initial rapid bacterial killing of P. aeruginosa, but regrowth occurred after 24 h irrespective of the dosing interval employed (once daily, every 12h or every 8h)5. The lack of difference in bacterial killing with the same daily dose may indicate that the antibacterial effect of polymyxin B was most closely related to the ratio of the AUC to MIC (AUC/MIC)4,5. However, further experiments are required to determine which PK/PD index (i.e. AUC/MIC, Cmax/MIC and % of time polymyxin B plasma concentration is higher than the MIC) is best correlated to the efficacy of polymyxin B, as well as which PK index (AUC, Cmax, Cmin) might be correlated with toxicity4. Relative to earlier plasma concentration data in patients, the sensitivity of the present LC/MS method is more than sufficient to determine these PK and PKPD indices19,26. For samples with low concentrations the method is most likely not sensitive enough to determine the free fraction of polymyxin B, which has been reported as 10–20% in critically ill patients26.
Conclusion
In summary, we describe a sensitive LC-MS method for the simultaneous measurement of polymyxin B1 and polymyxin B2 in human plasma. The method is currently used for pharmacokinetic studies. Given its sensitivity and simplicity it can also be applied to TDM of polymyxin B, thereby potentially improving treatment outcomes of the growing number of patients of patients with MDR Gram-negative bacterial infections.
Acknowledgements
NIH CTSA Grant UL1 RR024156, Doris Duke Charitable Foundation
Footnotes
Conflicts of Interest: The authors declare no conflicts of interest.
Publisher's Disclaimer: This is a PDF file of an unedited manuscript that has been accepted for publication. As a service to our customers we are providing this early version of the manuscript. The manuscript will undergo copyediting, typesetting, and review of the resulting proof before it is published in its final citable form. Please note that during the production process errors may be discovered which could affect the content, and all legal disclaimers that apply to the journal pertain.
References
- 1.Orwa JA, Van Gerven A, Roets E, et al. Liquid chromatography of polymyxin B sulphate. J Chromatogr A. 2000;870:237–43. doi: 10.1016/s0021-9673(99)00936-x. [DOI] [PubMed] [Google Scholar]
- 2.Evans ME, Feola DJ, Rapp RP. Polymyxin B sulfate and colistin: old antibiotics for emerging multiresistant gram-negative bacteria. Ann Pharmacother. 1999;33:960–7. doi: 10.1345/aph.18426. [DOI] [PubMed] [Google Scholar]
- 3.Livermore DM. The need for new antibiotics. Clin Microbiol Infect. (Suppl 4) 2004;10:1–9. doi: 10.1111/j.1465-0691.2004.1004.x. [DOI] [PubMed] [Google Scholar]
- 4.Zavascki AP, Goldani LZ, Li J, et al. Polymyxin B for the treatment of multidrug-resistant pathogens: a critical review. J Antimicrob Chemother. 2007;60:1206–15. doi: 10.1093/jac/dkm357. [DOI] [PubMed] [Google Scholar]
- 5.Tam VH, Schilling AN, Vo G, et al. Pharmacodynamics of polymyxin B against Pseudomonas aeruginosa. Antimicrob Agents Chemother. 2005;49:3624–30. doi: 10.1128/AAC.49.9.3624-3630.2005. [DOI] [PMC free article] [PubMed] [Google Scholar]
- 6.Antoniadou A, Kontopidou F, Poulakou G, et al. Colistin-resistant isolates of Klebsiella pneumoniae emerging in intensive care unit patients: first report of a multiclonal cluster. J Antimicrob Chemother. 2007;59:786–90. doi: 10.1093/jac/dkl562. [DOI] [PubMed] [Google Scholar]
- 7.Falagas ME, Bliziotis IA. Pandrug-resistant Gram-negative bacteria: the dawn of the post-antibiotic era? Int J Antimicrob Agents. 2007;29:630–6. doi: 10.1016/j.ijantimicag.2006.12.012. [DOI] [PubMed] [Google Scholar]
- 8.Reis AO, Luz DA, Tognim MC, et al. Polymyxin-resistant Acinetobacter spp. isolates: what is next? Emerg Infect Dis. 2003;9:1025–7. doi: 10.3201/eid0908.030052. [DOI] [PMC free article] [PubMed] [Google Scholar]
- 9.Urban C, Mariano N, Rahal JJ, et al. Polymyxin B-Resistant Acinetobacter baumannii Clinical Isolate Susceptible to Recombinant BPI and Cecropin P1. Antimicrob Agents Chemother. 2001;45:994–5. doi: 10.1128/AAC.45.3.994-995.2001. [DOI] [PMC free article] [PubMed] [Google Scholar]
- 10.David MD, Gill MJ. Potential for underdosing and emergence of resistance in Acinetobacter baumannii during treatment with colistin. J Antimicrob Chemother. 2008;61:962–4. doi: 10.1093/jac/dkn009. [DOI] [PubMed] [Google Scholar]
- 11.Cao G, Ali FE, Chiu F, et al. Development and validation of a reversed-phase high-performance liquid chromatography assay for polymyxin B in human plasma. J Antimicrob Chemother. 2008;62:1009–14. doi: 10.1093/jac/dkn343. [DOI] [PubMed] [Google Scholar]
- 12.Cheng C, Liu S, Xiao D, Hollembaek J, Yao L, Lin J, Hansel S. LC-MS/MS method development and validation of polymyxins and vancomycin in rat plasma. J Chromatogr B. 2010;878:2831–2838. doi: 10.1016/j.jchromb.2010.08.037. [DOI] [PubMed] [Google Scholar]
- 13.Gobin P, Lemaitre F, Marchand S, et al. Assay of colistin and colistin methanesulfonate in plasma and urine by liquid chromatography-tandem mass spectrometry. Antimicrob Agents Chemother. 2010;54:1941–8. doi: 10.1128/AAC.01367-09. [DOI] [PMC free article] [PubMed] [Google Scholar]
- 14.Haemers A, De Moerloose P. The identification of polymyxin B sulphate. J Chromatogr. 1970;52:154–7. doi: 10.1016/s0021-9673(01)96557-4. [DOI] [PubMed] [Google Scholar]
- 15.Howlett MR, Selzer GB. The identification of colistin and polymyxin B by thin-layer chromatography. J Chromatogr. 1967;30:630–1. doi: 10.1016/s0021-9673(00)84206-5. [DOI] [PubMed] [Google Scholar]
- 16.Jacobson M, Koch A, Kuntzman R, et al. The distribution and binding of tritiated polymyxin B in the mouse. J Pharmacol Exp Ther. 1972;183:433–9. [PubMed] [Google Scholar]
- 17.Kang JW, Van Schepdael A, Orwa JA, et al. Analysis of polymyxin B sulfate by capillary zone electrophoresis with cyclodextrin as additive. Method development and validation. J Chromatogr A. 2000;879:211–8. doi: 10.1016/s0021-9673(00)00343-5. [DOI] [PubMed] [Google Scholar]
- 18.Kotula Z, Piekut S, Kowszyk-Gindifer Z. Thin layer chromatography of polymyxin E and its methanesulfonate. Acta Pol Pharm. 1974;31:621–5. [PubMed] [Google Scholar]
- 19.Kwa AL, Lim TP, Low JG, et al. Pharmacokinetics of polymyxin B1 in patients with multidrug-resistant Gram-negative bacterial infections. Diagn Microbiol Infect. Dis. 2008;60:163–7. doi: 10.1016/j.diagmicrobio.2007.08.008. [DOI] [PubMed] [Google Scholar]
- 20.Lemus Gallego JM, Perez Arroyo J. Micellar electrokinetic capillary chromatography as an alternative method for the determination of dexamethasone, trimethoprim, and polymyxin B. Fresenius. J Anal Chem. 2001;370:973–5. doi: 10.1007/s002160100895. [DOI] [PubMed] [Google Scholar]
- 21.Srisom P, Liawruangrath B, Liawruangrath S, et al. Simultaneous determination of neomycin sulfate and polymyxin B sulfate by capillary electrophoresis with indirect UV detection. J Pharm Biomed Anal. 2007;43:1013–8. doi: 10.1016/j.jpba.2006.09.041. [DOI] [PubMed] [Google Scholar]
- 22.Stretton RJ, Carr JP, Watson-Walker J. The separation of neomycin sulphate, polymyxin B sulphate and zinc bacitracin. J Chromatogr. 1969;45:155–8. doi: 10.1016/s0021-9673(01)86197-5. [DOI] [PubMed] [Google Scholar]
- 23.He J, Ledesma KR, Lam WY, et al. Variability of polymyxin B major components in commercial formulations. Int J Antimicrob Agents. 2010;35:308–10. doi: 10.1016/j.ijantimicag.2009.11.005. [DOI] [PubMed] [Google Scholar]
- 24.Hermsen ED, Sullivan CJ, Rotschafer JC. Polymyxins: pharmacology, pharmacokinetics, pharmacodynamics, and clinical applications. Infect Dis Clin North Am. 2003;17:545–62. doi: 10.1016/s0891-5520(03)00058-8. [DOI] [PubMed] [Google Scholar]
- 25.Tam VH, Hou J, Kwa AL, et al. Comment on: Development and validation of a reversed-phase high-performance liquid chromatography assay for polymyxin B in human plasma. J Antimicrob Chemother. 2009;63:627–8. doi: 10.1093/jac/dkn483. author reply 628-9. [DOI] [PubMed] [Google Scholar]
- 26.Zavascki AP, Goldani LZ, Cao G, et al. Pharmacokinetics of intravenous polymyxin B in critically ill patients. Clin Infect Dis. 2008;47:1298–304. doi: 10.1086/592577. [DOI] [PubMed] [Google Scholar]
- 27.Couet W, Gregoire N, Marchand S, et al. Colistin pharmacokinetics: the fog is lifting. Clin Microbiol Infect. 2012;18:30–9. doi: 10.1111/j.1469-0691.2011.03667.x. [DOI] [PubMed] [Google Scholar]
- 28.Li J, Turnidge J, Milne R, et al. In vitro pharmacodynamic properties of colistin and colistin methanesulfonate against Pseudomonas aeruginosa isolates from patients with cystic fibrosis. Antimicrob Agents Chemother. 2001;45:781–5. doi: 10.1128/AAC.45.3.781-785.2001. [DOI] [PMC free article] [PubMed] [Google Scholar]


