Abstract
Deiters cells extend from the basilar membrane to the reticular lamina and, together with pillar cells and outer hair cells, structurally define the micro-architecture of the organ of Corti. Studying vibrotome sections of the mouse organ of Corti with confocal and scanning electron microscopy we found that the basal pole of every Deiters cell, independently of their position in the organ of Corti and along the cochlear spiral, attached to the basilar membrane within a 15.1±0.3 µm-wide stripe running the length of the cochlear spiral adjacent to the row of outer pillar cells. All Deiters cells’ basal poles had similar diameter and general morphology, and distributed on the stripe in a precise arrangement with a center-to-center distance of 7.1±0.3 µm between neighbor cells of the same row and 5.9±0.4 µm for neighbor cells in adjacent rows. Complete detachment of Deiters cells revealed an elliptical imprint on the top surface of the basilar membrane consisting of a smaller central structure with a very smooth surface surrounded by a rougher area, suggesting the presence of two different anchoring junctions. These previously unidentified morphological features of Deiters cells could be critical for the mechanical response of the organ of Corti.
Keywords: Deiters cells, pillar cells, basilar membrane, cochlear micromechanics, organ of Corti, cochlea
1. Introduction
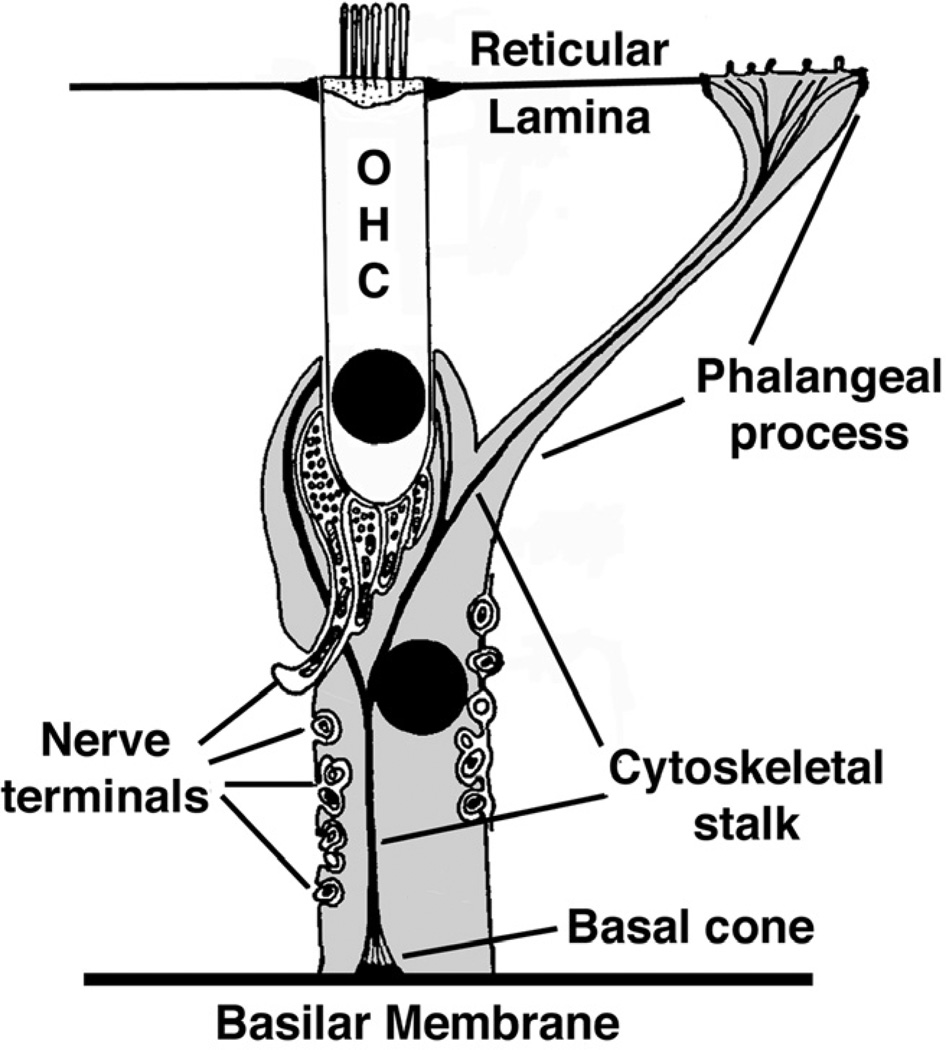
Deiters cells (DCs) are described as having an elongated body, spanning from the basilar membrane (BM) to the reticular lamina, and holding the base of the outer hair cells (OHCs) at their cup-shaped middle regions (Slepecky, 1996). From a morphological point of view each cell is usually divided into two portions, apical and basal. The apical portion consists of a thin branch, the phalangeal process, which extends from the mid-region of the cell to the reticular lamina where it fill the spaces between the OHCs; the basal portion, which extends from the region cradling the base of the OHCs to the BM, contains the nucleus and most of the organelles. This basal portion has been usually described as having a polygonal cylindrical shape (Engstrom et al., 1958a; Engstrom et al., 1958b; Iurato, 1961; Slepecky, 1996) (Fig. 1), although Deiters (Deiters, 1860) and Retzius (Retzius, 1884) illustrated DCs with a basal region significantly more slender than the mid-cell region, and others like Bredberg and coworkers depicted DCs basal portion as an upside-down truncated cone, with the smaller base contacting the BM in a very narrow area next to the feet of the outer pillar cells (see Fig. 2 in (Bredberg et al., 1972)).
Figure 1.
Classical depiction of a Deiters cell (in grey) illustrating the cytoskeletal stalk and the afferent and efferent nerve terminals. An OHC is also shown. Modified from (Engstrom et al., 1958b).
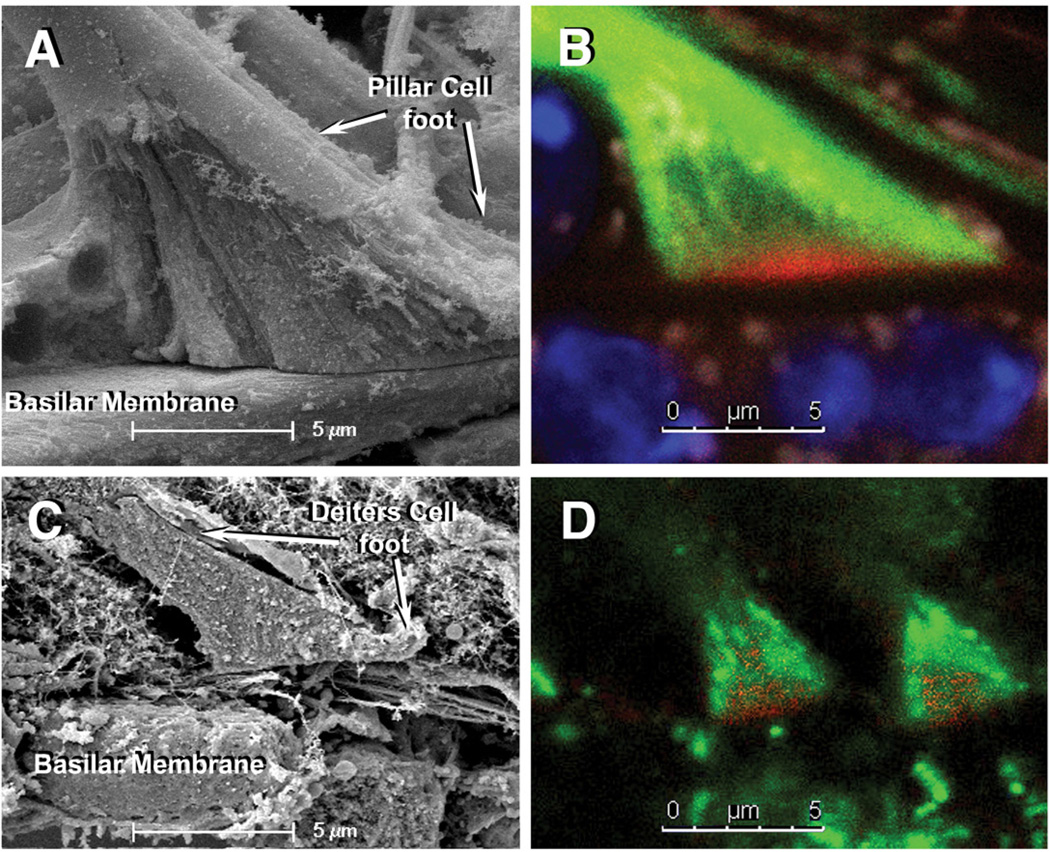
Figure 2.
SEM and cLSM images of pillar cells’ feet (A and B) and DCs’ feet (C and D). In cLSM images note that the feet resting on the top of the BM contain a central core of actin (red) wrapped by tubulin fibers (green). Green=β-tubulin, Red=rhodamine phalloidin. Scale bars = 5 µm.
DCs possess an unusual rope-like cytoskeletal element extending from a conical foundation contacting the BM, known as the basal cone, to the reticular lamina (Engstrom et al., 1953; Kimura, 1975; Smith et al., 1957) (Fig. 1). This cytoskeletal structure consists mostly of microtubules, intermediate filaments and actin (Angelborg et al., 1972; Slepecky et al., 1983; Slepecky et al., 1986) and is also referred to as the Deiters’ stalk (Slepecky, 1996; Spicer et al., 1993). The Deiters’ stalk is similar to the cytoskeletal structure that nearly fills the pillar cells, and it appears to be unique to these two cell types (Angelborg et al., 1972). The region of Deiters and pillar cells that contact the BM has been described as a “footplate” (Angelborg et al., 1972), and it is usually referred to as pillar’s or Deiters’ foot. In addition, DCs show in their medial region a distinctive envelopment of unmyelinated afferent nerves that are thought to establish no synapsis with the cells (Engstrom et al., 1958a; Engstrom et al., 1958b) (Fig. 1).
Although several studies on the structure and ultrastructure of DCs in different species have been published they were mostly focused on the phalangeal process or in the supranuclear region cupping the OHCs, and little attention has been directed to the basal, infranuclear region. As an exception, in a report on ultrastructural features of gerbil (Meriones unguiculatus) DCs, Spicer and Schulte (1993) described a sharp demarcation between a supranuclear region rich in organelles and other cytoplasmic structures and an almost empty infranuclear region. These authors discussed that DCs’ more basal portion might function mainly in transmission or absorption of mechanoenergy.
In the present report we describe findings indicating that mouse DCs possess a morphologically distinct infranuclear region, and Deiters’ feet —corresponding to little more than the basal cones anchoring the cells to the BM described by other authors (Angelborg et al., 1972)— localize next to each other in a narrow stripe extending all along the length of the organ of Corti. Our findings shed new lights on the morphology of DCs and their role in the cytoarchitecture of the organ of Corti, and could have a profound influence on our understanding of cochlear micromechanics.
2. Materials and Methods
2.1. Animals
A total of 50 C57BL/6 mice, obtained from The Jackson Laboratory (Bar Harbor, ME) and our own colony, were used in the present study. They were 1 to 10 months old, either sex, and their auditory function was evaluated with auditory brainstem response (ABR) and distortion product otoacoustic emission (DPOAE) techniques (only animals with normal auditory function were included in the protocol). ABR and DPOAE evaluations were performed inside an acoustically insulated booth (Industrial Acoustics, Bronx, NY) using a computer-controlled data acquisition system (BioSigRP Computer Software, Tucker Davis Technologies, Alachua, FL), calibrated in a cavity that approximates the volume of the ear canal with a 1/8" measurement microphone Grass 40DP (Grass Technologies, West Warwick, RI). ABRs were measured under computer control in response to broadband clicks (50-µs duration, at 27 stimuli/s) from 80 dB SPL to levels below threshold in 5 dB steps. Responses were detected with subcutaneous needle electrodes placed at the vertex and ventrolaterally to the left and right pinna. Responses were amplified (10,000 times), filtered (100 Hz to 3 kHz bandpass) and averaged (across 512 sweeps at each frequency-level combination). DPOAE (2f1−f2) Input/output functions were recorded as a function of L2 (L1−L2=10dB); primaries incremented together in 5 dB steps (from 20 to 80 dB SPL) spanning the frequency range f2 = 8 to 48 kHz. Mice were euthanized with CO2 following procedures approved by the House Research Institute’s IACUC.
2.2. Microscopy techniques
Mouse temporal bones were extracted immediately after euthanasia and fixed in 4% paraformaldehyde (Electron Microscopy Sciences, EMS, Hatfield PA) in 100mM HEPES buffer for at least 24 hour. After fixation, decalcification was carried out for 7 to14 days in a solution consisting of 125mM EDTA and 2% paraformaldehyde in 200 mM HEPES buffer (pH 7.2) (Sigma, St. Louis, MO), and 40, 45, 50, 55 and 60µm thick sections at different planes were obtained using a vibratome (Vibratome-3000, Leica Microsystems Inc, Deerfield, IL). Scanning Electron Microscopy: Vibratome sections were fixed with 2.5% glutaraldehyde in 100mM sodium cacodylate buffer (EMS; pH 7.2) for 30 minutes before processing for scanning electron microscopy (SEM). Specimens were processed using the TOTO method, which involves immersing the sections in 2% tannic acid (Sigma), saturated thiocarbohydrazide (EMS) and 1% OsO4 (EMS) two times, one before and other after thiocarbohydrazide (Davies et al., 1987; Forge et al., 1992). Sections were then dehydrated in increasing concentrations (30% to 100%) of ethanol (Pharmco-AAPER, Brookfield, CT) and critical point dried (EMS 850 Critical Point Dryer). Dried sections were mounted on aluminum specimen stubs, sputter coated (EMS 575 high resolution sputter coater with thin film monitor) with a thin layer of platinum (10 nm) and examined with a XL 30S FEG scanning EM (FEI Inc, Hillsboro, OR) operating at 5 and 10 kVa. Confocal microscopy: Specimens used for confocal laser scanning microscopy (cLSM) were produced by vibratome sectioning (60µm) of fixed-decalcified mouse temporal bones embedded in 4% low melting point agarose. On a glass slide and in a humidity chamber, after melting away the agarose, the sections were immersed in a drop of blocking solution (10% fish gelatin, Norland Inc., Cranbury, NJ) for 30 minutes before addition of anti-β-tubulin antibodies (monoclonal anti-β-tubulin/mouse; 1:200. Sigma); sections along with the antibody in blocking solution were incubated overnight at 4°C. The following day, sections were thoroughly washed with 1X PBS (Invitrogen Corporation, Grand Island, NY) and labeled with the secondary antibody (Alexa 488, 1:200. Molecular Probes-Invitrogen, Eugene, Oregon). In addition, actin filaments, nuclei, and plasma membranes were respectively labeled with rhodamin phalloidin (1:200), DAPI, and Cellmask dye (Cellmask plasma membrane stain-deep red, 1:1000. Molecular Probes-Invitrogen). The specimens were then analyzed on a Leica TCS SP5 microscope (objective: HCXPLAPO lambda blue 63X/1.2 water).
2.3. Measurements
Measurements were performed in at least three images per region (apical and basal turns) of cochleae from 21 different animals using the feature “Analysis” in Adobe Photoshop CS5 Extended Version. Values are expressed as mean±SE.
2.4. Statistical Analysis
Statistical analysis was performed using ANOVA techniques (JMP 9 software, SAS Institute, Cary, NC) and p < 0.05 as the criterion for statistical significance.
3. Results
Pillars’ and Deiters’ feet, in spite of obvious differences in size, share some common morphological features. They are pyramidal and comprise little more than the basal cones described by earlier morphologists that anchor the cells to the BM (Fig. 2). cLSM images confirmed that basal cones consist mostly of an actin-rich core wrapped by microtubules, and support the currently accepted concept that neither actin filaments nor microtubules penetrate into the basilar membrane (Fig. 2B,D). Notably, in spite of differences in size between Deiters cells from different rows and different cochlear regions, Deiters’ feet were all similar in shape and size.
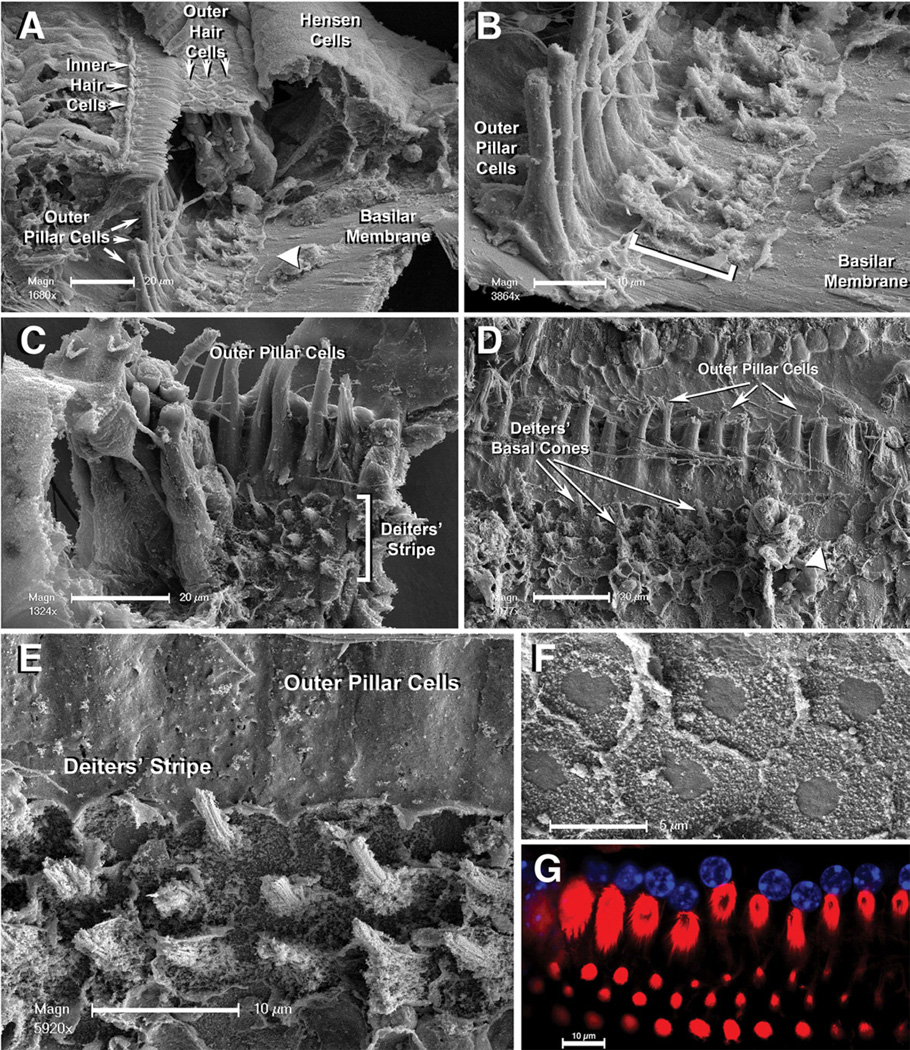
Some vibratome sections showed fractures in the organ of Corti with partial removal of the auditory epithelium. In these cases we observed a generally smooth upper surface of the BM except for a narrow stripe of cellular debris, running parallel to the feet of the outer pillar cells, congruent with the DCs’ attachment region (Figs. 3A,B). In other sections we observed some DCs still in position while others in their neighborhood were detached leaving short conical stumps of fibers attached to the BM (Figs. 3C,E). Closer inspection suggested that these conical stumps were actually remains of the DCs’ basal cones. Interestingly, Fig. 11 A of the 1972 paper by Bredberg and co-workers shows conical stumps similar to those illustrated here, but the authors did not describe them or associate them with any cell or cell structure (Bredberg et al., 1972).
Figure 3.
A: SEM image of an accidentally fractured mouse organ of Corti. Note the BM surface and the narrow stripe of cellular debris (arrowhead). Scale bar = 20 µm. B: A close up of the stripe showed in 3A. Debris in the stripe actually corresponds to remains of DCs feet in the area where they were attached to the BM. Scale bar = 10 µm. C: In some cases, as shown in this image, some DCs are still present whereas next to them short stumps of fibers are visible as the sole remaining of DCs’ basal cones. Scale bar = 20 µm. D: In others, only basal cones’ remains are visible and regions where they were completely removed and the BM surface looks smooth are observed (arrowhead). Scale bar = 20 µm. E: Close-up showing details of DCs’ basal cones, residuals of plasma membranes from DCs’ feet, and the BM surface showing the full area of contact with DCs’ feet. Scale bar = 10 µm. F: Close-up of a region where DCs were completely removed, and only imprints of DCs’ feet are visible. Note the elliptical shape of these areas of contact and the characteristic smooth central area surrounded for a region with a more roughed appearance. Scale bar = 5 µm. G: cLSM image showing the single row of outer pillars’ feet and the three rows of DC’s feet. Red- rhodamine phalloidin; Blue- DAPI. Scale bar = 10 µm.
Whereas in some cases the basal cones were still wrapped by pieces of plasma membrane, in others not even the basal cone remained attached to the BM, revealing an imprint consisting of a smaller central circle with a very smooth surface surrounded by a more rough area (Figs. 3D,F). Since the basal cone, as described in earlier studies and suggested by our data, would be composed by an actin-rich core wrapped by microtubules, we speculated that these distinct surfaces might represent different zones of the anchoring junction connecting the cytoskeletal elements of the basal cone to the top surface of the BM.
We measured several geometrical parameters associated with these structures and performed statistical analysis to estimate their values. The width of the stripe defined by the place of attachment of DCs’ feet to the top surface of the BM had a mean value of 15.1±0.3 µm, with no differences between the base, mid and apical portions of the cochlea. The dimensions of feet’ imprints were also homogeneous for DCs in different regions of the cochlea and similar among the 3 rows of DCs. The imprints were elliptical rather than circular, with a shorter axis transversal to the stripe) estimated in 5.6±0.2 µm and a longer axis (parallel to the stripe) of 6.1±0.3 µm, subtending an area of approximately 25.8±1.1 µm2. The center-to-center distance between the feet of two adjacent, same row DCs was bigger than the same distance between the feet of two adjacent DCs from different rows (7.1±0.3 µm vs. 5.9±0.4 µm, P≤0.03). The smooth surface in the DCs’ foot imprint, on the other hand, was found to have a diameter of 2.3±0.1 µm and an area of 3.9±0.1 µm2.
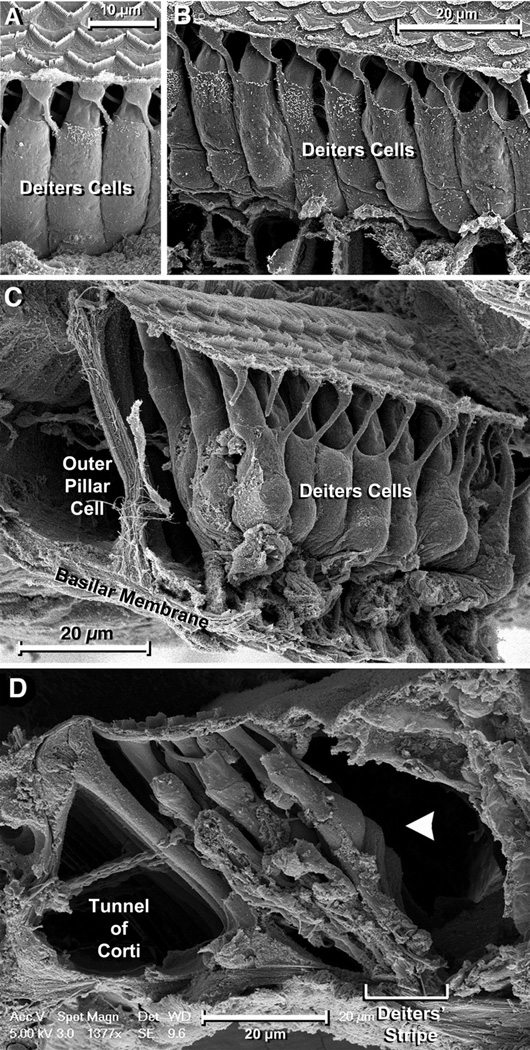
Since the width of the stripe defined by DCs’ feet was clearly inconsistent with the traditional view of the basal region of DCs as a polygonal prism of about 10 µm in diameter, we investigated the morphology of this region along the cochlear spiral. A SEM image of the third row of mouse DCs is shown in Figure 4A. The phalangeal processes and the middle region of the cells are clearly delimited, and the cells appear to rest on the floor of the organ of Corti. However, this “floor” is not the BM but the basal part of Hensen cells penetrating underneath the body of the 3rd row DCs (Fig. 4B). If these cells are removed the actual shape of the basal region of DCs is revealed, showing that below the nucleus (recognizable as a prominence on the mid5 region of the cells) the cell bodies become more slender, forming a slim column that ultimately makes contact with the BM (Fig. 4C). Thus, whereas at nuclear level (Fig. 4D, arrowhead) the three rows of DCs may be as wide as 40 µM, they contact the BM in the about 15-µM wide stripe (Fig. 4D, bar).
Figure 4.
A: Typical “front view” SEM image of 3rd row DCs. The cylindrical cell body seems to finish in a floor apparently formed by the top of the BM. Scale bar = 10 µm. B: The floor, however, corresponds to the basal part of Hensen cells. Scale bar = 20 µm. C: If these cells are removed, a slender basal region of the DCs becomes apparent. Scale bar = 20 µm. D: The basal regions of 3rd row DCs join those of the neighboring DCs in the other rows and contact the BM in the narrow stripe. Scale bar = 20 µm.
We found consistent evidence that DCs’ infranuclear portion is morphologically different from the middle and apical regions. At the level of the nucleus the cells were ellipsoidal, with a short axis (width when observed from the front of the 3rd row toward the tunnel of Corti; see Fig. 4A) of about 9 µm, and a long (antero-posterior) axis varying from 9 to 11 µm (Fig. 4D, arrowhead). Below the nuclear region the cells’ diameter decreased progressively, defining a region looking like an inverted truncated cone. This region was followed by a cylindrical segment of variable length but uniform diameter (3.8±0.2 µm) ending at the foot that is in contact with the BM (Figs. 4A,B). Because this ending portion of DCs has been known as “foot” for a long time, we called the full basal region DCs’ “lower limb”.
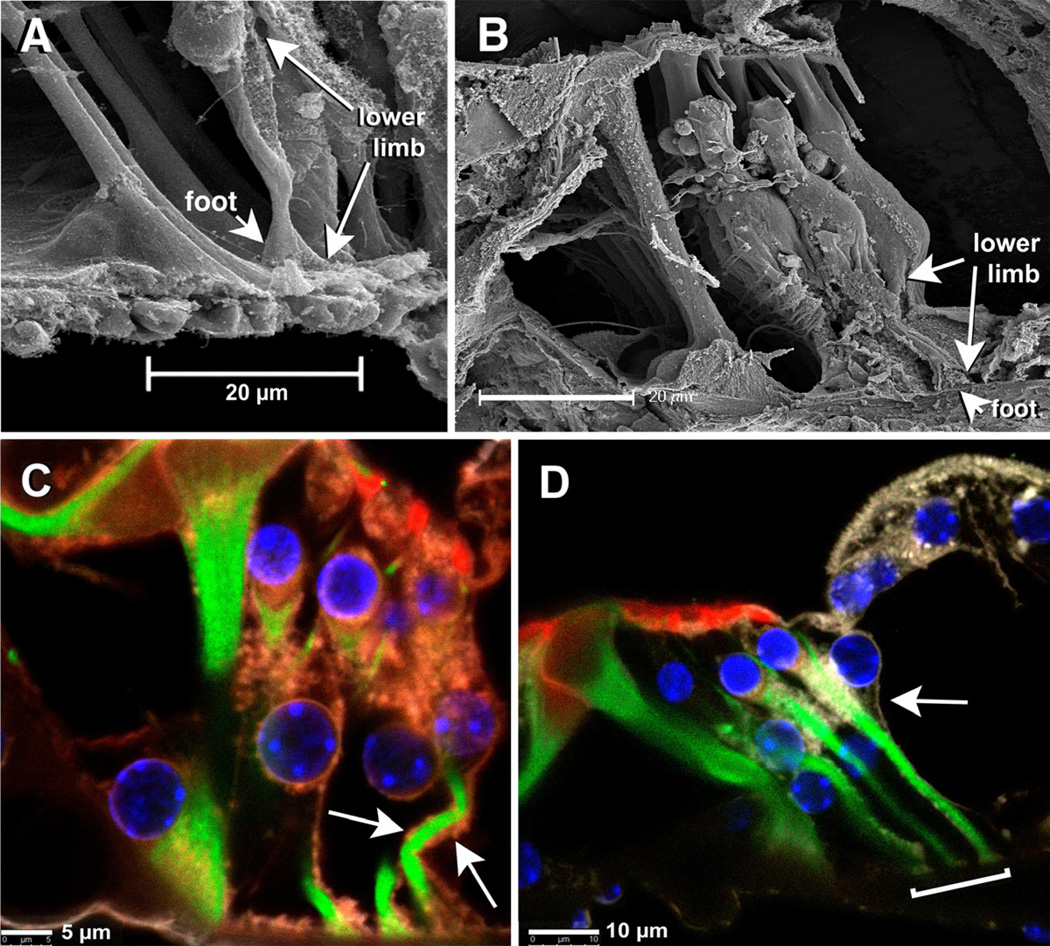
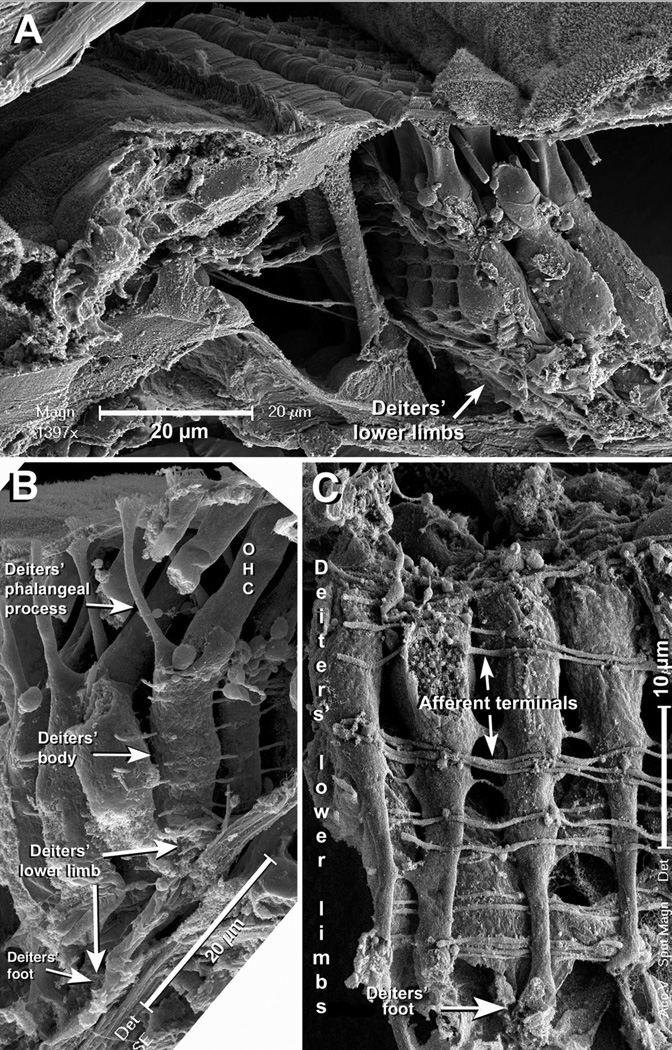
Although the general structure of the DCs’ lower limb, as described in the previous paragraph, was similar in every region of the mouse organ of Corti, some morphological adaptations were observed in particular areas. In the basal part of the cochlea, for instance, DCs from the 1st row were placed more upright than in the apex (Figs. 5A–C). DCs from the 2nd and 3rd row in the same region of the cochlea had their mid-bodies parallel to those in the 1st row but their limbs were bent towards the tunnel of Corti in such way that their feet contacted the BM in the already described stripe (Figs. 5B,C). In more apical regions of the mouse cochlea the tunnel of Corti was wider and the outer pillar cells and DCs were more slanted. In these regions we observed that the limbs of most of 3rd row DCs were fully extended, with their major axis roughly parallel to the longitudinal axis of the OHCs (Fig. 5D). Here, it was the limb of 1st row DCs that was bent away from the tunnel of Corti in such way that their feet again contacted the BM in the stripe just next to the feet of the 2nd and 3rd row DCs (Figs. 5D and 6).
Figure 5.
A: In SEM images, the DCs’ basal region resembles a lower limb ending in the characteristic foot. Scale bar = 20 µm. B: In the basal half of the cochlear spiral the lower limbs of 3rd row DCs are frequently twisted towards the tunnel of Corti, which makes their particular morphology more evident. Scale bar = 20 µm. C: cLSM image of the organ of Corti in a region located at the basal half of the cochlear spiral. Note that part of the lower limb of the 3rd row DC is oriented at practically 90 degrees of the cell’s body, and the feet of the three DCs in the image contact the BM next to each other. Sections of plasma membrane stained with Cellmask are visible (arrows), showing that cLSM and SEM techniques provide consistent information about the morphology of DCs lower limb. Green=β-tubulin, Red=rhodamine phalloidin, Blue=DAPI, Brown= Cellmask. Scale bar = 5 µm. D: In the upper half of the mouse cochlea, in contrast to the basal region (compare with Fig. 5C and Fig. 6), DCs were more slanted and the lower limbs of those at the 3rd row look straight. Pieces of plasma membrane stained with Cellmask are visible (arrow). Note the DCs feet next to each other defining the stripe. G reen=β-tubulin, Red=rhodamine phalloidin, Blue=DAPI, Brown= Cellmask. Scale bar = 10 µm.
Figure 6.
A: SEM image showing a region of the organ of Corti at the mid region of the cochlear spiral. Note that 1st row DCs’ lower limbs bend slighty before reaching the BM. Scale bar = 20 µm. B: At more apical areas of the mouse cochlea 1st row DCs were more slanted, and the lower limbs bent near 90 degrees away the tunnel of Corti. In this picture the scale bar (= 20 µm) is placed on the BM and parallel to it, making clear that the DC’s leg and the BM have the same orientation. C: Front view of the lower limbs of 1st row DCs at the apical half of the cochlear spiral oriented near parallel to the BM. The feet are fractured and not clearly visible in this picture. Note afferent fibers running on the back and front of the DCs’ lower limbs. Scale bar = 10 µm.
4. Discussion
Using SEM and cLSM, this study has revealed a unique feature of the basal region of mouse DCs. DCs’ feet, independently of cell’s position in the organ of Corti and along the cochlear spiral, were similar in diameter, with similar morphology, and were attached to the BM within the same 15 µm-wide stripe running all along the cochlear spiral just next to the row of feet of the outer pillar cells (Fig. 7). This constancy contrasts with the reported transversal (from the first-row to the more lateral third-row) and longitudinal (from the base to the apex of the cochlea) gradient in DCs size (Slepecky, 1996). Importantly, ongoing experiments in rats and guinea pigs indicate that DCs follow the same pattern of organization observed in mice (Parsa et al., in preparation), suggesting it is evolutionary conserved.
Figure 7.
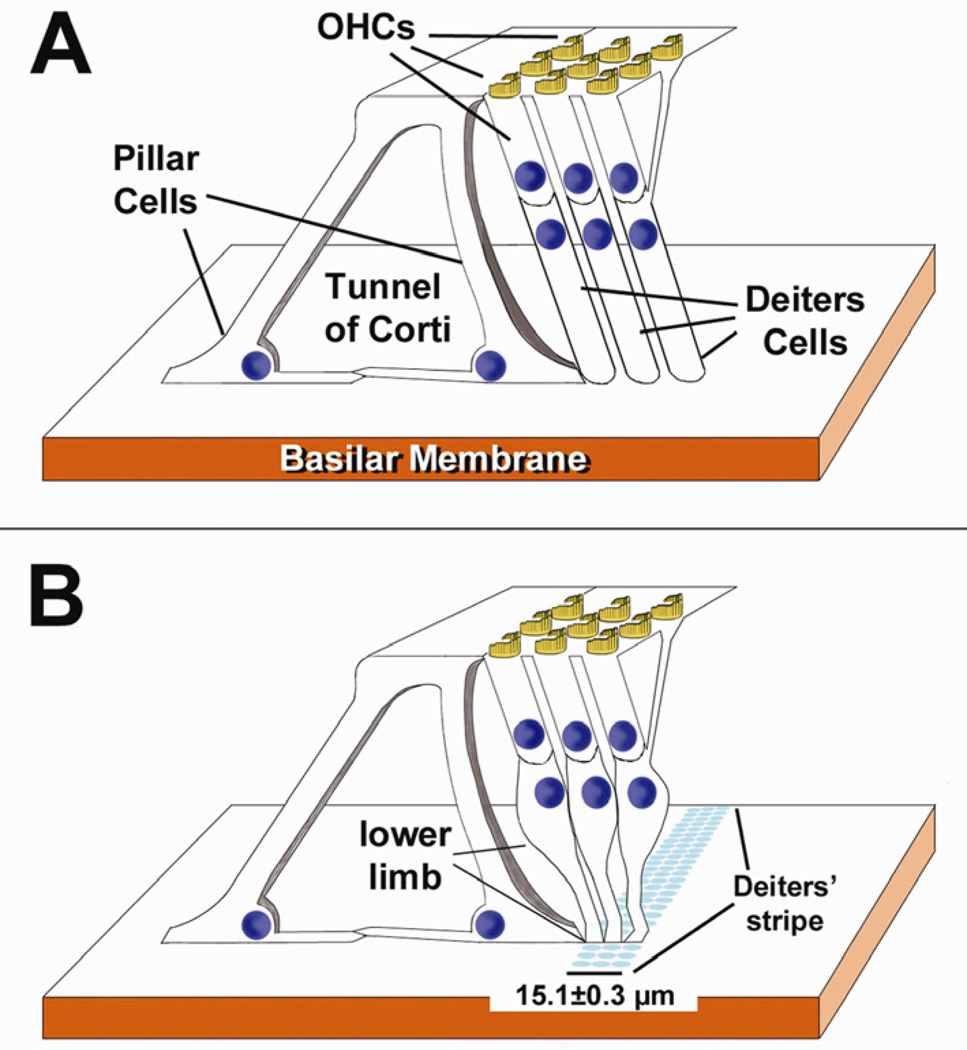
A: Highly schematic diagram of the organ of Corti showing DCs with their currently accepted morphology, that is a cylindrical body extending from the BM to the region cradling the base of OHCs, followed by the phalangeal process connecting it to the reticular lamina. B: The same diagram showed in A but depicting DCs with the morphological features reported in this study. Note the characteristic lower limb and the feet of DCs from different rows always contacting the BM very close to each other and defining the 15.1 µm-wide Deiters’ stripe. Differences in DCs’ length and stance among different organ of Corti regions (see text) are not represented here.
Since DCs are responsible for transducing BM motion into reticular lamina motion as well as for transmitting the forces generated by the outer hair cells to the BM, we are tempted to speculate that the DCs’ stripe might have a critical role in these processes. In our opinion, however, conjectures about evolutionary or functional advantages of DCs’ strip should be left to experts in the field of cochlear biomechanics. Nevertheless, our morphological findings could be used to address potential discrepancies between published results. For example, studies in gerbil cochleae suggested that the radial variation in BM stiffness reflects the cellular structure of the cochlear partition. The zone below the tunnel of Corti would have a low stiffness, the area adjacent to outer pillar cells a large stiffness, and the OHCs/Hensen cells region an intermediate stiffness (Olson et al., 1993; Olson et al., 1994; Naidu et al., 1998). The authors speculated that pillar cells were responsible for the large stiffness whereas the corresponding DCs dominated the stiffness measured in the region under the OHCs. Interestingly, measurements of sound-evoked vibrations of the BM in guinea pigs and gerbils using laser interferometry detected maximal amplitudes precisely in the high stiffness region “adjacent to the outer pillar cells”, not in the OHCs zone (Cooper, 1999). The fact that these results seemed to be in contradiction with the idea that OHC electromotility would contribute substantially to the pattern of vibration of the cochlear partition led the author to speculate that perhaps “…cellular elements of the partition are less important than the extracellular elements (e.g., the fibres of the basilar membrane in determining the gross features (…) of the radial response profiles” (Cooper, 1999). Our structural findings suggest that the region “adjacent to the outer pillar cells”, as defined in those papers, would include the DCs’ stripe, whereas the OHCs/Hensen cells region would actually correspond to Hensen and Bötcher cells. Thus, OHC motility could be indeed contributing to the maximal amplitudes of sound-evoked vibrations observed in the region adjacent to outer pillar cells.
How DCs are able to accommodate the basal region of their bodies in order to place their feet precisely on the stripe is an intriguing question. Our observations suggest that this basal region is not a plain, cylindrical column bridging the base of the OHCs with the BM as usually described, but actually possesses distinctive features correlated with a specialized lower limb (Fig. 7). In these lower limbs we distinguished small areas apparently more prone to bend in order to facilitate the convergence of DC’s feet into a narrow BM region. These “prone-to-bend” areas were especially evident in 3rd row DC at the basal region of the cochlea, whose lower limbs bent towards the tunnel of Corti, and in 1st row DC at the apical region of the cochlea, whose lower limbs bent away the tunnel of Corti. Interestingly, many images of the organ of Corti available in the literature —from different species and obtained with different techniques— show similar “twisted” DCs’ lower limbs (see, for example, (Hardie et al., 2004; Huang et al., 2010; O'Keeffe et al., 2010; Shim, 2011)). Moreover, a beautiful drawing by Retzius (Plate XXV, Figs. 2, 4, 9, 10 and 12 (Retzius, 1884)) depicts DCs lower limbs just like they are observed in our images. To our knowledge, however, the meaning of these bends in the DCs’ basal region was never discussed.
We recognize that, in contrast to the unequivocal definition of the stripe by the imprints of DCs’ feet on the upper surface of the BM, the morphological features of the DCs’ lower limb we described might be associated with technical artifacts. Just as every histological technique involving tissue dehydration and sectioning, our samples include technical artifacts such as tissue deformation and shrinkage. Reports in the literature, however, agree that the TOTO preparation method used in this study offers the best way of preserving tissues with minimal artifacts (see, for example, (Davies et al., 1987; Forge et al., 1992)). We did not detect morphological alterations (e.g., plasma membrane wrinkles and folding) suggesting that the small diameter of DCs’ lower limbs could be associated with differential (excessive) shrinkage of that particular region with respect to the mid body of the cells (see, for example, Figs. 5A and 6C). Our images, and those in the literature showing twisted DCs’ lower limbs, are hard to conciliate with the classical view of the basal region of DCs as cylindrical columns, since under compression rather than folding they would expand laterally displacing neighboring regions of the organ of Corti. An alternative explanation, that procedural dehydration induces a selective shrinkage of the lower region of DCs that leads to a characteristic deformation as an artifact of sectioning, looks far-fetched but cannot be ruled out. In any case, every interpretation suggests that the lower region of DCs has some particular structural feature that allows it to organize in the precise distribution described in our study.
In the present study we also confirmed results from different laboratories, spanning more than five decades, indicating that pillar cells and DCs feet are attached to the top surface of the BM with no cellular components penetrating into the BM (Angelborg et al., 1972). Similar anchoring junctions connecting the cytoskeleton to an extracellular structure are present in many tissues, especially in those subjected to severe mechanical stress (Alberts et al. 2002). They are usually classified in two groups, focal adhesions and hemidesmosomes, with the first being connection sites for actin filaments and the seconds for intermediate filaments. The images provided by the imprints suggest that DCs are connected to the BM by two different junctional complexes. However, the actual nature of the DCs-BM junctions and their precise mechanical properties are, at this time, only matter of speculation.
5. Conclusions
We conclude that the organization and attachment of DCs within the organ of Corti, as well as the morphology of the DCs’ basal region, as reported in this study do not correspond to a simple cellular adaptation to cochlear micro-architecture but suggest a more complex and crucial echanical principle for auditory function.
Highlights.
-
>
DCs’ feet, independently of cell’s position, are similar in diameter and morphology
-
>
DCs’ feet attach to the BM in a narrow stripe running all along the cochlear spiral
-
>
DCs’ feet would be connected to the BM by two different junctional complexes
Acknowledgements
The authors thank Dr. David J. Lim for critically reading the manuscript, and declare no existing or potential conflict of interest. Ahmanson Foundation grants equipped the Imaging Center where much of this work was carried out. This work was supported by National Institutes of Health grants DC010146 and DC010397, and House Research Institute. Its content is solely the responsibility of the authors and does not necessarily represent the official views of the National Institutes of Health or the House Research Institute.
Abbreviations
- DCs
Deiters cells
- OHCs
outer hair cells
- BM
basilar membrane
- SEM
scanning electron microscopy
- cLSM
confocal laser scanning microscopy
- ABR
auditory brainstem response
- DPOAE
distortion product otoacoustic emissions
- SE
standard error of the mean
Footnotes
Publisher's Disclaimer: This is a PDF file of an unedited manuscript that has been accepted for publication. As a service to our customers we are providing this early version of the manuscript. The manuscript will undergo copyediting, typesetting, and review of the resulting proof before it is published in its final citable form. Please note that during the production process errors may be discovered which could affect the content, and all legal disclaimers that apply to the journal pertain.
References
- Alberts B, Johnson A, Lewis J, Raff M, Roberts K, Walter P. Molecular Biology of the Cell. 4th edition. New York: Garland Science; 2002. [Google Scholar]
- Angelborg C, Engstrom H. Supporting elements in the organ of Corti. I. Fibrillar structures in the supporting cells of the organ of Corti of mammals. Acta Otolaryngol Suppl. 1972;73:49–60. doi: 10.3109/00016487209122689. [DOI] [PubMed] [Google Scholar]
- Bredberg G, Ades HW, Engstrom H. Scanning Electron Microscopy of the Normal and Pathologically Altered Organ of Corti. Acta otolaryngol Suppl. 1972;73:3–48. [Google Scholar]
- Cooper NP. Radial Variation in the Vibrations of the Cochlear Partition. In: Wada H, Takasaka T, Ikeda K, Ohyama K, Koike T, editors. Recent Developments in Auditory Mechanics. Singapore: World Scientific; 2000. pp. 109–115. [Google Scholar]
- Davies S, Forge A. Preparation of the mammalian organ of Corti for scanning electron microscopy. J Microsc. 1987;147:89–101. doi: 10.1111/j.1365-2818.1987.tb02821.x. [DOI] [PubMed] [Google Scholar]
- Deiters O. Untersuchungen uber die Lamina spiralis membranacea. Bonn: Henry & Cohen; 1860. [Google Scholar]
- Engstrom H, Wersall J. Structure of the organ of Corti. II. Supporting structures and their relations to sensory cells and nerve endings. Acta Otolaryngol. 1953;43:323–334. doi: 10.3109/00016485309119854. [DOI] [PubMed] [Google Scholar]
- Engstrom H, Wersall J. The ultrastructural organization of the organ of Corti and of the vestibular sensory epithelia. Exp Cell Res. 1958a;14:460–492. [PubMed] [Google Scholar]
- Engstrom H, Wersall J. Structure and Innervation of the Inner Ear Sensory Epithelia. Int Rev Cytol. 1958b;7:535–585. [Google Scholar]
- Forge A, Nevill G, Zajic G, Wright A. Scanning electron microscopy of the mammalian organ of Corti: assessment of preparative procedures. Scanning Microsc. 1992;6:521–534. discussion 534-5. [PubMed] [Google Scholar]
- Hardie NA, MacDonald G, Rubel EW. A new method for imaging and 3D reconstruction of mammalian cochlea by fluorescent confocal microscopy. Brain Res. 2004;1000:200–210. doi: 10.1016/j.brainres.2003.10.071. [DOI] [PubMed] [Google Scholar]
- Huang LC, Thorne PR, Vlajkovic SM, Housley GD. Differential expression of P2Y receptors in the rat cochlea during development. Purinergic Signal. 2010;6:231–248. doi: 10.1007/s11302-010-9191-x. [DOI] [PMC free article] [PubMed] [Google Scholar]
- Iurato S. Submicroscopic structure of the membranous labyrinth. 2. The epithelium of Corti's organ. Z Zellforsch Mikrosk Anat. 1961;53:259–298. doi: 10.1007/BF00339444. [DOI] [PubMed] [Google Scholar]
- Kimura RS. The ultrastructure of the organ of Corti. Int. Rev. Cytol. 1975;42:173–222. doi: 10.1016/s0074-7696(08)60981-x. [DOI] [PubMed] [Google Scholar]
- Naidu RC, Mountain DC. Measurements of the stiffness map challenge a basic tenet of cochlear theories. Hear Res. 1998;124:124–131. doi: 10.1016/s0378-5955(98)00133-6. [DOI] [PubMed] [Google Scholar]
- O'Keeffe MG, Thorne PR, Housley GD, Robson SC, Vlajkovic SM. Distribution of NTPDase5 and NTPDase6 and the regulation of P2Y receptor signalling in the rat cochlea. Purinergic Signal. 2010;6:249–261. doi: 10.1007/s11302-010-9190-y. [DOI] [PMC free article] [PubMed] [Google Scholar]
- Olson ES, Mountain DC. Probing the cochlear partition’s micromechanical properties with measurements of radial and longitudinal stiffness variations. In: Duifhuis H, Horst JW, van Dijk P, van Netten SM, editors. Biophysics of Hair Cell Sensory Systems. Singapore: World Scientific; 1993. pp. 280–287. [Google Scholar]
- Olson ES, Mountain DC. Mapping the cochlear partition's stiffness to its cellular architecture. J Acoust Soc Am. 1994;95:395–400. doi: 10.1121/1.408331. [DOI] [PubMed] [Google Scholar]
- Retzius G. Das Gehörorgan der Wirbelthiere. vol 2. Stockholm: Samson & Wallin; 1884. [Google Scholar]
- Shim K. Vibratome sectioning for enhanced preservation of the cytoarchitecture of the mammalian organ of Corti. J Vis Exp. 2011:pii: 2793. doi: 10.3791/2793. [DOI] [PMC free article] [PubMed] [Google Scholar]
- Slepecky N, Chamberlain SC. Distribution and polarity of actin in inner ear supporting cells. Hear Res. 1983;10:359–370. doi: 10.1016/0378-5955(83)90098-9. [DOI] [PubMed] [Google Scholar]
- Slepecky N, Chamberlain SC. Correlative immuno-electron-microscopic and immunofluorescent localization of actin in sensory and supporting cells of the inner ear by use of a low-temperature embedding resin. Cell Tissue Res. 1986;245:229–235. doi: 10.1007/BF00213926. [DOI] [PubMed] [Google Scholar]
- Slepecky NB. Structure of the mammalian cochlea. In: Dallos P, Popper AN, Fay RR, editors. The Cochlea. Vol. 8. New York: Springer; 1996. pp. 44–129. [Google Scholar]
- Smith CA, Dempsey EW. Electron microscopy of the organ of Corti. Am. J. Anat. 1957;100:337–367. doi: 10.1002/aja.1001000304. [DOI] [PubMed] [Google Scholar]
- Spicer SS, Schulte BA. Cytologic structures unique to Deiters cells of the cochlea. Anat Rec. 1993;237:421–430. doi: 10.1002/ar.1092370316. [DOI] [PubMed] [Google Scholar]


