

Abstract
Background
Many wish to change incentives for primary care practices through bundled population-based payments and substantial performance feedback and bonus payments. Recognizing patient differences in costs and outcomes is crucial, but customized risk adjustment for such purposes is underdeveloped.
Research Design
Using MarketScan’s claims-based data on 17.4 million commercially-insured lives, we modeled bundled payment to support expected primary care activity levels (PCAL) and 9 patient outcomes for performance assessment. We evaluated models using 457,000 people assigned to 436 primary care physician panels, and among 13,000 people in a distinct multi-payer medical home implementation with commercially-insured, Medicare and Medicaid patients.
Methods
Each outcome is separately predicted from age, sex, and diagnoses. We define the PCAL outcome as a subset of all costs that proxies the bundled payment needed for comprehensive primary care. Other expected outcomes are used to establish targets against which actual performance can be fairly judged. We evaluate model performance using R2s at patient- and practice-levels, and within policy-relevant subgroups.
Results
The PCAL model explains 67% of variation in its outcome, performing well across diverse patient ages, payers, plan types and provider specialties; it explains 72% of practice-level variation. The outcome-specific models explain 17% to 86% of practice-level variation in 9 performance measures, often substantially outperforming a “one-size-fits-all” CMS-like HCC score, eg, with grouped R2s of 47% versus 5% for predicting “prescriptions for antibiotics of concern.”
Conclusion
Existing data can support the risk-adjusted bundled payment calculations and performance assessments needed to encourage desired transformations in primary care.
Keywords: Primary care, risk adjustment, patient-centered medical home, hierarchical condition categories, capitation, Medicare, Medicaid, all-payer
INTRODUCTION
The goal of primary care payment reform is to achieve “better value—defined as better outcomes at less cost— … by rewarding physicians for prevention and coordination rather than volume of services.”1 While many have argued the importance of risk adjustment for calculating bundled payments and bonuses for good performance,2-4 little guidance exists regarding how to do so. This paper addresses that gap.
In a 2010 survey, 25 of 26 patient-centered medical home (PCMH) pilots principally relied on fee-for-service (FFS) payments, typically augmented with a management fee under ten dollars per member per month.5 The fee is often slightly higher for the “very sick” than for others, as in the AMA’s 2008 RUC calculations for Medicare’s 2008 Medical Home Demonstration Project.6 Reforms envisioning larger bundled payments typically acknowledge the need for stronger risk adjustment. For example, the Center for Medicare and Medicaid Innovations 2011 Comprehensive Primary Care Initiative (CPCI) retains FFS payments supplemented with a management fee averaging up to $20 per-patient-per-month, and ranging between $60 and $480 per-patient-per-year, depending on the patients’ CMS-HCC score.7 The CPCI also proposes significant bonuses, to be calculated based on shared savings and performance measures. A more radical reform proposed by Goroll et al2 would replace all primary care FFS income with comprehensive monthly bundled payments plus substantial performance-based bonuses. Our current work directly supports the Goroll framework. Its monthly payments are neither intended to cover all services (full capitation), nor to be just an add-on to existing fee-for-service revenues. Rather, we sought to develop a principled approach to computing the “primary care activity level” (PCAL) needed, that is, the cost of all services that primary care practitioners (PCPs) should provide. These payments rightly vary hugely between fundamentally healthy and highly complex patients.
Although we focus here on primary care payments, our approach is relevant to many other settings. An accountable care organization (ACO) could use our PCAL calculation to set budgets and incentives for its PCPs.8 Or, a model of the outcome “PCAL minus FFS reimbursement” could be used to calculate risk-adjusted case-management supplements to FFS, as proposed for the CPCI. Our paradigm also aligns well with the goals of value-based purchasing, and can be used to produce a risk-adjusted expected value for any population-based outcome that can be modeled in existing large databases.9,10
Our bundled payment model was implemented in 2009 by the Capital District Physician’s Health Plan (CDPHP), a not-for-profit, network-model, physician-guided health plan with 350,000 members concentrated in upstate New York. CDPHP implemented an early version to pay 3 PCMH pilot practices for their CDPHP patients (private HMO, private non-HMO, Medicare Advantage, and Medicaid HMO enrollees) in January 2009.11 This pilot was organized as a “virtual all-payer” system, in that CDPHP financed practices to implement the PCMH as if CDPHP had insured all their patients.3
Another leg of envisioned reform is outcome-based bonuses. Goroll and others have called for large risk-adjusted bonuses (up to 25% of total income) for achieving desired outcomes in cost, quality, and patient experience.2 Although using non-adjusted performance measures may create undesirable incentives for practices to avoid the sickest patients, even crude adjustments are rare.12-15 Here, we explore the importance of risk adjustment for assessing provider performance and examine our models’ performance for patient panels assigned to primary care practices. Our approach is population-based and empirical; it seeks to encourage improved management and outcomes for whole persons. Risk adjustment rewards practices when their patients’ outcomes are better than expected. Here, “what-is-expected” reflects patient-specific normative relationships calculated via a model. When the model is refit to new data, the norm shifts to reflect the “new normal;” thus, as a delivery system improves, “the bar” rises with it. These models currently rely only on age, sex, and claims-based diagnoses to define both predictors and outcomes. Soon, electronic health records and patient surveys must also be used, both to include non-medical factors as predictors, and quality- and patient-experience data as outcomes.
While bundled base payments allow a PCP to allocate resources efficiently, bonus payments can directly discourage low-value services and encourage activities that promote clinical quality, patient well-being, and satisfaction. Risk-adjusted bonuses are intended to ensure that each practice can earn rewards for doing a good job with its patients, and to mitigate incentives for cherry-picking easy patients and dumping difficult ones.
For each performance measure, we first build a patient-level model to predict its associated outcome from patient characteristics (age, sex and diagnoses). A practice is judged by comparing its patients’ aggregated observed outcome (O) to its model-based expected (E), or predicted, level. We acknowledge, but do not address here, the many issues associated with separating “signal” from “noise” when judging single practices on individual outcomes, or when creating a useful composite score (leading to a practice-level bonus payment) based on multiple measures.13,16,17 Our aim is to demonstrate the feasibility of risk-adjusted performance assessment, and its importance, given that fixed targets punish good providers whose complex patients, even if doing “better than expected,” don’t hit targets that are easier to achieve with healthier patients.
METHODS
Overview of the Base Payment System: Primary Care Activity Level (PCAL)
Each practice receives a monthly base payment to support providing its patients with comprehensive primary care. For a complex patient, this might need to be ten or even fifty times larger than for a healthy one. We must “get the price right” for highly diverse individual patients.
It is now quite standard to develop full capitation payments (eg, to a Medicare Advantage plan), by first using a large benchmark dataset to fit a model to predict Y0 = total cost from age, sex, and diagnoses. The purpose of modeling is to establish the relative amounts of resources that are typically used for different kinds of patients. The mean value of the predictions into payments. For example, we might specify where and are used to ensure that a one unit increase in translates into an appropriate additional payment for an individual who needs more attention, and that the total of all payments matches budgeted funds.
Using existing claims data to calculate bundled primary care payments is similar but harder. The main problem is that, unlike total cost, the actual primary care activity level (or PCAL), that is, the money spent on providing comprehensive services – cannot be observed directly. Why? Because today’s billing data reflect the sorry state that reform seeks to redress: many services that the bundled payment is intended to encourage are often not done, or even when done, are either undercompensated or not billable at all.18
Since the PCAL outcome cannot be observed directly in claims data, we collaborated with researchers at Verisk Health, Inc., of Waltham, Massachusetts, and the Massachusetts Coalition for Primary Care Reform (MACPR) to create an outcome Y described in detail below, as a proxy. We used regression to predict Y, calling this prediction PCAL.
Risk-Adjusted Practice Performance Models
We also developed risk-adjustment models for 9 utilization and efficiency measures. One predicts total health spending, an important target for reduction. Three relate to pharmaceuticals. Total “spending on prescription drugs” is a poor performance measure because it reflects both valuable and wasteful spending. Nonetheless, it may be useful to know when a practice’s pharmaceutical spending is far from expected. More focused performance measures include “number of prescriptions for ‘antibiotics of concern’” and “total number of antibiotic scripts,” each based on a HEDIS definition from the National Committee for Quality Assurance.19 We also modeled 3 hospitalization count measures, ranging from all admissions to only ambulatory-care sensitive (ACS) ones.20 Two additional models count: relative value units (RVUs) for advanced imaging, and emergency department (ED) visits. We evaluate all measures at both individual and practice levels.
Data
We estimated PCAL models using 2007 Thomson Reuters MarketScan Commercial Claims and Encounter data. MarketScan contains age, sex, eligibility information, and medical and pharmacy claims for beneficiaries mostly in large, well-insured firms. The estimation sample included 17.4 million commercially-insured people with at least six months of eligibility, non-missing age and sex, and prescription drug coverage; over 166 thousand were age 65 and over. We calculated number of covered months (eligibility), used for analytic weighting, and various components of total expenditures (eg, specialist care, hospital care, outpatient drugs, and emergency department visits), used for constructing several outcome variables and PCAL.
To evaluate model performance for practices, we created a Practice-Based subset from among the 1,668,486 people in MarketScan who could be assigned to a PCP (multi-person practices could not be identified). We selected patients with known county-of-residence assigned to health plans that: were not consumer-directed or exclusive provider organizations, had at least 1000 enrollees, and had acceptable data (at least half of professional claims with a valid provider ID, specialty, and county). Based on the plurality of PCP dollars in 2007 (and, if none, then 2006 dollars), we assigned each patient uniquely to a family medicine, internal medicine, geriatric, pediatric or other primary care physician (PCP). This method resembles CMS’s proposed rule for ACOs.21 Those with no PCP visits in either year (29%) were randomly assigned to a practice in the same county, in proportion to numbers of patients already assigned to that PCP. Restricting to PCPs with between 500 and 5000 assigned patients left 456,781 patients and 436 PCPs. Except for randomly assigning unassigned patients, these are real physician panels, including all insured individuals, even those with no primary care contacts. We used this subsample to evaluate practice-level performance.
We also validated PCAL predictions in a distinct 13,000-person Capital District Physician’s Health Plan database with enrollees in HMO, PPO, and POS plans covered by private employers, Medicare, and Medicaid. After describing the PCAL model and its properties, we present results from CDPHP’s internal validation studies on its 2006-07 data, before PCMH implementation.
Defining and calculating PCAL
The PCAL outcome Y is a subset of a person’s current spending designed to represent the dollars that should have been available for delivering comprehensive primary care. PCAL is the from regressing this Y on age, sex and diagnoses in benchmark data, typically after dividing by its sample average to achieve a normalized risk score, nrs. In the risk-adjustment literature, nrs is commonly called a relative risk score.22 After normalization, 1.0 denotes average primary care need, while, say, 1.5 describes someone with 50% greater need. We “lightly recalibrate” PCAL for use in a new population or subpopulation by regressing the same PCAL outcome Y on nRS, yielding . For example, a and b may be payer- or plan-specific constants. The resulting PCAL predictions can be divided by their sample mean in the new population, producing a normalized risk score there.
Our idea for specifying the proxy outcome Y for PCAL is to use resources spent on other kinds of care to “signal” the need for primary care services, eg, to handle simple problems in-house that might otherwise be referred out; to avert crises by attentively managing chronic problems; or to coordinate care for patients during and after hospitalizations and other crises. Specifically, we define Y for each person during a year as the following dollar amount:
Where did these numbers come from? First, we consulted with five practicing primary care clinicians, asking them to estimate how much of their time was spent on various activities. Their average, rounded responses are shown in Table B1 of a Supplemental Digital Content Appendix, referenced hereafter as SDC. http://links.lww.com/MLR/A291 We then calculated the fractions of observable spending variables needed to reflect these allocations. For example, given that about 50% of PCP time is spent on core primary care services and 10% (1/5 as much) on managing prescription drugs, we calculated that 12% of prescription drug spending needed to be included in Y to make pharmacy spending contribute about 1/5 as much as core primary care spending. Thus, for every $100 of pharmacy spending in the data we added $12 to Y, envisioning that a comprehensive primary care provider would have needed that level of resources to manage the medications. Prior to making these allocations, we had top-coded each subcomponent at its 99.9th percentile; this limited the effect of extreme outliers while only reducing the overall mean by 1.7%. We included $65 to recognize fixed overhead costs of activities such as monitoring, email or phone consultations, and encouraging prevention, even for people with no current claims. We frequently shared the implications of choices with our clinician panel, thereby allowing practicing doctors to examine the face-validity of the resulting relationships. For example, before settling on the above formula for Y, our physicians reviewed and verified the plausibility of the resulting normalized PCAL scores for several dozen patient illness profiles in which various medical conditions were added to or subtracted from realistic patient profiles.
In summary, our physician panel examined for plausibility both the process for choosing model parameters (eg, the fractions used to define Y and the flat base payment amount) and their consequences for PCAL scores. We took additional comfort from unpublished sensitivity analyses suggesting that alternate PCAL models, based on fairly different choices, lead to highly correlated practice-level payments. However, if another group implementing these ideas preferred different parameters, it is not hard to derive a PCAL based on their choices. We make no claim that our choices are optimal, merely that they are reasonable; our key innovation is in conceptualizing, implementing and testing a credible and flexible approach to predicting primary care need from age and sex and the diagnoses and costs recorded in claims data. Summary statistics for the PCAL model are in the SDC, Supplemental Digital Content-1 http://links.lww.com/MLR/A291.
PCAL Analysis
A practice’s base payment is the sum of the expected cost of all PCMH services (that is, the PCALs) for its assigned patients, not fees for actual services; PCAL comes from regressing the just-described Y on age, sex, and a vector of 394 hierarchical condition categories (HCCs) recorded during the same year and populated using Verisk Health’s DxCG Version 7 clinical classification. These categories refine the CMS-HCC model (with only 70 to 86 HCCs). That model is currently used to calculate full capitation payments for Medicare Advantage plans and has been proposed for risk-adjusting care-management payments in Medicare’s Comprehensive Primary Care Initiative.7,23-25
Unlike CMS’s Medicare implementation, but following the Massachusetts Alternative Quality Contract ACO8, we used a concurrent model (relying on demographic and diagnostic data to predict same-year costs) to increase PCAL’s accuracy in estimating this year’s needs, and to limit financial risk for small practices. Verisk Health provides a web-accessible description of its Version 7 release, including its differences from CMS’s HCC model.26 In the online SDC, http://links.lww.com/MLR/A291 we describe the MarketScan data and demonstrate the stability of large-parameter models estimated on it across 6 years and diverse plan types.
The PCAL model includes interactions between age groups and diseases and across disease clusters based on statistical significance and face validity with our physician panel, who also reviewed PCAL model parameters, especially examining very high-cost and relatively rare conditions for which empirically estimated costs are least precise. The initial regression model contained 569 parameters. Second-stage regressions on these fitted values for each age-sex group ensured that all predictions are non-negative and that final predictions reflect actual differences in resource use for men and women of all ages and risk scores. Plan type was ignored during model estimation, but examined for validity. For comparison, we also estimated and evaluated models predicting total health spending, total spending on all PCPs, and total spending on primary care evaluation and management services by PCPs. Following CMS’s HCC modeling procedures, all regressions annualize spending for people with partial-year eligibility and weight observations by eligible months.
Performance Measure Analysis
Using similar methods and identical data as above, researchers at Verisk Health, Inc., with input from our physician panel and us, estimated linear regression models (including zero-cost cases) in our full claims database. We examined how well these models explain variation in outcomes for individuals and practices in the Practice-Based subset defined above. The more strongly patient characteristics predict an outcome, the more important risk adjustment becomes. Because the normalized risk score that predicts total health spending is a good proxy for total morbidity burden, we distinguish this outcome by calling it and the normalized risk score that predicts it Y0 and nRS0, respectively.27 For each outcome Yi we consider both a “tailored” specification, regressing it on the nRSi from the model calibrated specifically to predict it (that is, Yi = a + b nRSi), and a “generic” one, regressing Yi on nRS0, the normalized risk score for total spending. By definition, these regressions coincide for Y0. Comparing the predictive power (R2) of generic and tailored specifications quantifies the value of outcome-specific risk adjustment over a one-size-fitsall “risk” calculation for all outcomes, as CMS contemplates using in its Comprehensive Primary Care Initiative. We also calculated practice-level grouped R2s by reducing the data set to one observation per practice (n = 436) and using practice-specific average values for the Y and nRS variables; that is, making predictions of the form , for various outcomes among the 436 PCPs.
RESULTS
The PCAL Model
The model predicting the Primary Care Activity Level (PCAL) proxy Y uses 653 parameters and explains 0.67 of the variation in Y at the individual patient level (ie, R2 = 67%). In the same sample, R2s for concurrent models predicting total health spending and all PCP payments are 57% and 32%, respectively. Because the development data set is huge, the PCAL model is not overfit; the R2s when fitting it to half the data and when applying this fitted model to the other half are both 67%. (See the SDC for details http://links.lww.com/MLR/A291.) Such high R2 values result from: use of a concurrent model, top-coding the individual components of the dependent variable, and the predictability of outpatient services and pharmacy spending (which contribute most of the dollars to Y).
To test how well the model applies to plans of different types, we examined mean actual and predicted PCAL normalized risk scores for 5 MarketScan plan types (SDC http://links.lww.com/MLR/A291 ). After rescaling, that is, predicting within each type using type-specific intercepts and slopes with the PCAL normalized risk score, we can predict uniformly well for all 5 plan types (R2s = 66% to 68%). Rescaling avoids underpaying for enrollees in consumer-directed health plans and non-capitated point-of-service plans in this sample. Using separate regressions on each of 22 age-gender groups, ranging from age 1 or less to age 65 and over, model R2s also remain high, explaining 60% to 66% of the variation within these age-gender groups (SDC, http://links.lww.com/MLR/A291).
The model strongly differentiates among patients: PCALs for the 0.5% of the population with the highest predicted primary care need are 16 times average, versus 1/10 of average for the 30% with the lowest predicted need: a 160-fold variation! Furthermore, across the risk spectrum, PCAL closely tracks what it is designed to predict (see SDC Figure B2 http://links.lww.com/MLR/A291). The largest absolute deviation between the PCAL proxy (Y) and PCAL is found for the top 0.5%, where mean is about 8 percent lower than that for the mean fitted PCAL.
To the extent that Y is a good estimate of the level of primary care needed for patients, a ratio of observed (Y) to expected equal to 1 is ideal, while a ratio of, say, 2 for a group suggests that the real need for their primary care is twice what is predicted. Figure 1’s left-most panel thus suggests that, with payments based on an age-sex prediction of Y, nearly 75% of the groups defined by the presence of an HCC are “underpriced” by a factor of 2 or larger. Also, while CMS-HCC-like model predictions are far more accurate than age-sex-based predictions, about half the O to E ratios for it are bigger than 1.4 (middle panel). Practices should not be asked to care for a patient expected to require over $1400 worth of work for only $1000 of payment! With our PCAL model, however, practices can assume that they will get approximately the right resources when enrolling people with medical problems in just about any HCC. Underpriced medical problems penalize practices that care for sick people and allow practices to achieve unearned profits by focusing on the healthy. Figures B3 and B4 in the SDC http://links.lww.com/MLR/A291 further show that the age-sex models tend to underpay more for rarer conditions while the CMS-HCC-based model underpays fairly uniformly for both common and uncommon medical conditions.
FIGURE 1.

Distributions for 3 Models of Observed-to-Expected Ratios in the 325 Most Common HCCs for the Proxy Primary Care Spending Variable
Predictive Power at the PCP Level
To assess the financial risk that a PCAL payment would impose on practices, we examined PCAL and its predicted values at the PCP-level, using the PCP-assigned subsample of the MarketScan data. When individual predictions are summed to the PCP-level and the results multiplied by a normalizing constant that makes the sum of the PCALs equal to the sum of the proxy values it predicts, the HCC model explains 72% of the variation in the PCP-level average of Y (Figure 2A), versus only 42% for a model to predict from age and sex alone (Figure 2B). Figure 2A also shows that efficient practices, as measured by the constructed PCAL proxy, are not concentrated among either simple or complex patient panels.
FIGURE 2.

Predicted vs. Actual PCP-level Average Per Capita PCALPractice Spending
A. HCC-Predicted versus Actual PCAL
B. Age-sex Predicted versus Actual PCAL
Notes: PCP: primary care provider; PCAL: primary care activity level; HCC: hierarchical condition categories. For each of 436 PCPs, plotted values are person -year averages for those assigned to the practice. On the horizontal axis are 2007 PCAL predictions, converted to a relative cost by dividing by the sample mean. Vertical -axis values are defined analogously for actual PCAL outcome values (called in the text), also normalized to 1. Figure 2A uses predictions for Y from the HCC model; Figure 2B uses predictions from an age-sex model.
The needs of pediatric patients differ from those of older patients. To evaluate how well PCAL serves for different practice types, we first classified each of our 436 practices with at least 80% of its services assigned to a single primary care specialty to that specialty. Remaining practices were classified as “multispecialty” or “other” (eg, acute care, emergency, inpatient or radiology). As seen in Figure 3, while pediatric practices (19% of our sample practices) had far lower average risk scores and PCAL proxies than other practices, the model fit to their data alone had essentially the same slope and intercept as the model fit to all the data. Family medicine (29% of our sample) and internal medicine (14% of our sample) had more complex and higher average cost enrollees, but again, no obvious bias was found within or between these specialties.
FIGURE 3.
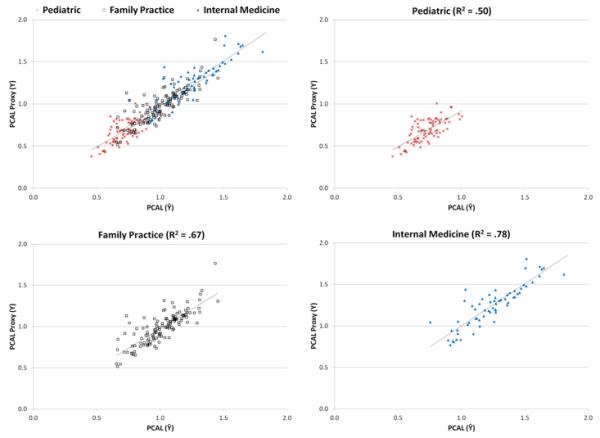
HCC-Predicted vs. Actual PCP-level Average Per Capita PCAL Practice Spending, by Provider Specialty
Notes: Points in these scatterplots are a subset of those in Figure 2A, covering 3 subspecialties: pediatric (n=82), family practice (n=127), and internal medicine (n=63). For each PCP, values on the horizontal axis are the sum of predicted 2007 PCAL costs using the 394-category HCC model divided by the number of full-year equivalent people assigned to the practice, converted to a normalized cost by dividing by the sample mean. Vertical -axis values are defined analogously, using sums of all calculated PCAL values in the numerators. Regression lines, fit separately to pediatric (x’s), family medicine (squares) and internal medicine practices (triangles), are indicated. Variables on both axes are normalized to average 1.0.
CDPHP replicated the predictive power of the PCAL model at the PCP level using 2 prior years of data (2006-07) on 13 physicians (22,800 patient-years). At the individual level, the PCAL model explains 54% of the variation in PCAL services provided to commercial, Medicaid, and Medicare patients. The PCP-level R2 in this outside sample is 73%, as compared to the 72% achieved in the commercially-insured development sample, even though that sample included no Medicare or Medicaid enrollees. To see if models calibrated on MarketScan’s data predict well across payer types, we regressed total spending on a single predictor (concurrent nRS) in CDPHP’s 75% commercial, 7% Medicare and 18% Medicaid enrollees. Individual-level R2 values are high in each subpopulation: 60%, 65% and 56% respectively (SDC http://links.lww.com/MLR/A291).
High R2s suggest that risk adjusting is important for PCAL capitation. Holding PCPs responsible for all spending (full capitation) imposes sizeable risks on individual practices. The average practice size in our sample was 1048 people, somewhat smaller than a typical PCP patient panel, but realistic if PCPs only receive bundled payments for some patients. For each of 4 dependent variables, we calculated both age-sex models and Verisk Health HCC models that also used diagnoses. VH-HCC risk adjustment meaningfully reduces unexplained practice-level variations in spending relative to non-risk-adjusted variation, with the largest reductions in the PCAL and total-spending models. Standard deviations (SDs) in Table 1 also show that financial risks under the PCAL model are far less than under full capitation, where practices are at risk for total health spending. Thus, full capitation — even with sophisticated risk adjustment that reduces the PCP-level average per capita SD of total health spending from $1,438 to $682 — still leaves a PCP exposed to an SD 225% higher than the annual PCP-specific revenue of $303 per patient. Practice-level PCAL payments are only slightly more risky than spending narrowly defined on core primary care services to all PCPs (SDs = $76 and $66, respectively).
TABLE 1.
Per Capita Summary Statistics at the PCP-level of 4 Annual Spending Measures on Patients in a Sample of 436 Primary Care Practices
| Mean of Practice per Capita Spending |
SD of Practice-Level Per Capita Residuals by Type of Risk Adjustment |
Ratio of HCC Risk-adjusted SD to $303 (ie, Mean of All PCP Service Revenues) |
||||
|---|---|---|---|---|---|---|
| None | Age- Sex Only |
HCC | ||||
| Spending on: | ||||||
| Core Primary Care Services by All PCPs | $ | 210 | 78 | 71 | 66 | 22% |
| All Services by PCPs | $ | 303 | 182 | 171 | 163 | 54% |
| PCAL | $ | 501 | 144 | 100 | 76 | 25% |
| All Health Services | $ | 3,611 | 1,438 | 945 | 682 | 225% |
PCP: primary care provider; PCAL: primary care activity level; HCC: hierarchical condition category.
Risk-Adjusted Performance Measures
Table 2 summarizes results for 9 potential performance measures. Along with sample means and standard deviations, 4 R2s are shown for each model. The individual-level R2s from generic models range from 3% to 42%, while those from the outcome-specific models are much higher, explaining 19% to 53% of patient-level variation in outcomes. The final 2 columns present the corresponding grouped R2 values at the practice level, for which the generic model R2s range from 0% to 78% while the tailored models range from 17% to 86%. Whereas the generic models explain a large fraction of the variation in broad measures such as total drug spending, hospitalizations not related to childbirth and pregnancy, and advanced imaging RVUs, they predict some other measures quite poorly.
TABLE 2.
Performance Characteristics of Models Predicting 9 Cost and Utilization Outcomes
|
Individual-Level R2
(N=456,781) |
Practice-Level (N=436) Grouped R2 Predictions |
||||
|---|---|---|---|---|---|
|
| |||||
| Mean (Std. Dev) |
Generic (RRS0) |
Tailored (RRSi) |
Generic (RRS0) |
Tailored (RRSi) |
|
| Total health spending, in dollars (Y0)* |
3,781 (12,113) |
42% | 42% | 78% | 78% |
| Total prescription drug spending, in dollars* | 836 (1,937) |
19% | 37% | 69% | 86% |
| Number of prescriptions for antibiotics of concern |
0.57 (1.12) |
3% | 29% | 5% | 47% |
| Number of prescriptions for antibiotics | 1.06 (1.69) |
4% | 32% | 6% | 56% |
| Hospital admissions, all types | 0.058 (0.276) |
13% | 53% | 39% | 64% |
| Hospital admissions, not related to childbirth, pregnancy, or behavioral health |
0.035 (0.224) |
19% | 43% | 66% | 76% |
| Hospital admissions for ambulatory-caresensitive conditions |
0.004 (0.067) |
4% | 19% | 14% | 41% |
| Advanced imaging tests in relative value units (RVUs) |
3.17 (11.04) |
25% | 46% | 65% | 79% |
| Emergency department visits | 0.18 (0.54) |
3% | 25% | 0% | 17% |
Consider predicting number of prescriptions for antibiotics of concern, a HEDIS quality measure. The low R2s for the generic model mean that such prescriptions are poorly related to predicted total health spending, while the model that specifically identifies the effect of condition categories on antibiotic use is highly predictive. Figure 4A shows the data behind the tailored model’s grouped R2 of 47%; Figure 4B, for the generic model’s grouped R2 of 5%. In each figure, the underlying mean normalized risk scores vary considerably at the practice level (roughly 4-fold from low to high), but the tailored model is far more predictive.
FIGURE 4.

Observed Versus Predicted Number of Prescriptions for Antibiotics of Concern (ABX) per Capita, by PCP
A. Predictions Using Tailored (ABX) Model
B. Predictions Using Generic (Health-Spending Calibrated) Model
Note: Each dot plots average observed vs. average predicted number of prescriptions for antibiotics of concern for one practice among 436 PCPs serving 456,781 patients. Data are from the Practice-Based sample of patients assigned to mid-size practices in the Thomson Reuters 2007 MarketScan Commercial Claims. In each figure the predicted number of prescriptions for each practice is the mean of its individual level predictions. Figure 4A predictions are made using a model tailored to predict this specific outcome, while Figure 4B uses the normalized risk score from a model tailored to predict total health spending. Each model was estimated on the full sample (N~17.4 million), as a function of age, sex, 394 hierarchical condition categories (HCCs) and interaction terms.
Table 2 explores 3 commonly used hospital-admission models. Total admissions is the broadest measure; admissions excluding behavioral health hospitalizations (which are often contracted separately) and maternity hospitalizations is intermediate; the narrowest counts only ambulatory-care sensitive (ACS) admissions, as defined by AHRQ.20 Tailored models do only modestly better than generic models for these measures, and broader measures are generally more predictable than narrower ones. While conceptually attractive, ACS admissions are too rare in this commercially-insured sample to reliably predict, even at the practice level.
The emergency department visit data are provocative. First, predicted total spending at both the individual and practice level is essentially uncorrelated with ED visit use. Second, tailored models are only modestly predictive for individuals (R2 = 25%), with an even lower grouped R2 (17%). Perhaps other variables — such as income, education, proximity, and payer type — are important for risk-adjusting ED visits. Alternatively, although there are no theorems allowing us to directly interpret differences in the values of an individual versus a grouped R2, the highly unusual drop when moving from the individual to the practice-level measure may mean that practice-level factors strongly influence ED visit use. To the extent that the PCMH can control these factors, large unexplained practice-level variance could make risk-adjusted ED visits rates a particularly good performance measure.
Another advantage of risk-adjusted over non-risk-adjusted measures, and of the choice of measures such as prescriptions for antibiotics of concern or imaging RVUs over total health spending, is that they permit incentives to target rewarding good performance not just more fairly, but also more precisely. For a fixed amount of bonus money, a predictive model that reduces the unexplained standard deviation of the performance measure by half will enable the payment per unit of the outcome to be about twice as large, strengthening incentives to do well.
Incorporating Socioeconomic Factors
Zaslavsky and Epstein, examining HEDIS quality measures for individuals and plans, showed that socioeconomic variables can strongly predict quality outcomes.28,29 Although little SES data are coded in large populations, health plans or provider networks can use SES proxies (such as payer-type and geography-based variables) to modify PCAL and other claims-based predictions.
CONCLUSIONS
There is a growing consensus that “improving the health of patients and the viability of the healthcare delivery system [requires] a better model of compensating clinicians.”1 One key component is monthly care-coordination payments for primary care teams to support “up-front costs to maintain the required level of care;” such payments “should be risk-adjusted to ensure that there are no inherent incentives to avoid the treatment of more complex, costly patients.”1 Another is performance-based payments for achieving quality and efficiency goals. To protect providers with complex patients, these should also be risk-adjusted. Whether or not the desired primary care transformation takes place in a patient-centered medical home,2,4,30,31 proposed reforms all recognize the importance of paying for care coordination and providing credible performance assessments.
We developed and evaluated risk-adjusted PCAL base payments and performance measures using empirical criteria to estimate essentially all the resources needed for care and to determine what constitutes good performance. Empirical models, based on observed-to-expected comparisons, can be derived, tailored and updated more quickly than resource-intensive and subjective target-setting based on expert and stakeholder panels. Our work suggests that claims-based models may provide “good enough” incentives to start, much as claims-based risk adjustment has been used in the Medicare Advantage program. One early adopter of our claims-based PCAL, CDPHP, is expanding its use into a large second phase PCMH pilot.11
By calculating a bundled payment for only a particularly relevant subset of spending for primary care, we avoid the problem of full capitation imposing unreasonable financial risk on typical primary care practices whose incomes currently comprise only 5-7% of total health spending in the US. 32,33 This is an important motivation for our narrower, less financially risky measure: the primary care activity level (PCAL).
Risk adjustment is central to creating fair bundled primary care payments, because the costs and complexities of caring for patients vary enormously. We found that the predicted and apparent costs of providing comprehensive primary care vary more than 100-fold across patients and showed that sophisticated risk adjustment (here, a 394-category HCC model) is required to adequately distinguish across such huge differences.
While estimating a PCAL-like model is relatively straightforward, implementation in a multi-stakeholder environment is complex. Although many choices were needed to define the particular models shown here, we did not systematically explore all alternatives. Future research should study, for example, prospective vs. concurrent PCAL models, different top-coding choices, and employing other fractions for various kinds of health care spending in the PCAL proxy outcome. In large-scale implementation of any PCAL model it will be important to explore and address the implications for all kinds of patients. For example, for a patient with multiple complications of diabetes, the elevated PCAL dollars might not be appropriate if all care has been transferred to a specialist, but could be extremely useful if used to promote coordinated care between a PCMH and an endocrinologist. Another tool for fine-tuning the basic PCAL logic would be to place clinically-determined “credibility constraints” on unreasonably high, or low, model coefficients or predictions.
Risk adjustment is also important for performance assessment, as we demonstrate for several cost- and utilization-based performance measures – explaining about half of all practice level variation. Its importance for clinical quality and patient experience measures can be determined in patient-level databases that can link such outcomes to claims. We posit that any measure should be risk adjusted “until proven otherwise” – that is, unless it is shown that patient factors cannot predict it.
We have demonstrated the utility of claims-based risk adjustment across diverse provider specialties, health plan types, payers, age, sex, various outcomes and in distinct datasets. Although models in this paper were designed to support replacing fee-for-service payments in a medical home entirely with bundled care-coordination payments and large bonuses,2 the approach applies more widely. Risk adjustment for fundamental payment reform is ready for implementation.
Supplementary Material
Acknowledgements
This research was supported by Verisk Health Inc. and a grant from The Commonwealth Fund. Dr. Ash was partially supported by UL1RR031982 from the National Center for Research Resources. We are grateful to Yelena Shulga of Verisk Health for modeling work, and John Ayanian, Jim Burgess, Mike Chernew, Catarina Kiefe, Andrea Kronman, Lisa Lines, Tom McGuire, and staff from The Commonwealth Fund for useful insights. The ideas here are preliminary and do not necessarily reflect the opinions of the University of Massachusetts, Boston University, Verisk Health, The Commonwealth Fund, or any other organization or entity.
Footnotes
This is a PDF file of an unedited manuscript that has been accepted for publication. As a service to our customers we are providing this early version of the manuscript. The manuscript will undergo copyediting, typesetting, and review of the resulting proof before it is published in its final citable form. Please note that during the production process errors may be discovered which could affect the content, and all legal disclaimers that apply to the journal pertain.
REFERENCES
- 1.Patient-Centered Primary Care Collaborative [Accessed November 6, 2011];Reimbursement Reform. 2010 Available at: http://www.pcpcc.net/reimbursement-reform.
- 2.Goroll AH, Berenson RA, Schoenbaum SC, et al. Fundamental reform of payment for adult primary care: comprehensive payment for comprehensive care. J Gen Int Med. 2007;22(3):410–415. doi: 10.1007/s11606-006-0083-2. [DOI] [PMC free article] [PubMed] [Google Scholar]
- 3.Patient-Centered Primary Care Collaborative . Patient-Centered Medical Home - Building Evidence and Momentum: A compilation of PCMH pilot and demonstration projects. Washington, DC: [Accessed June 6, 2011]. 2008. http://www.pcpcc.net/content/pcpcc_pilot_report.pdf. [Google Scholar]
- 4.Guterman S, Davis K, Schoen C, et al. Reforming Provider Payment: Essential Building Block for Health Reform. The Commonwealth Fund; Washington, D.C.: 2009. [Google Scholar]
- 5.Bitton A, Martin C, Landon BE. A nationwide survey of patient centered medical home demonstration projects. J Gen Int Med. 2010;25(6):584–592. doi: 10.1007/s11606-010-1262-8. [DOI] [PMC free article] [PubMed] [Google Scholar]
- 6.AMA/Specialty Society RVS Update Committee [Accessed January 12, 2012];Medicare Medical Home Demonstration Project Memo. 2008 Available at http://www.amaassn.org/ama1/pub/upload/mm/380/medicalhomerecommend.pdf.
- 7.Center for Medicare and Medicaid Innovation [Accessed October 19, 2011];Solicitation for the Comprehensive Primary Care Initiative. 2011 Available at: http://innovations.cms.gov/areas-offocus/seamless-and-coordinated-care-models/cpci/ [Google Scholar]
- 8.Song Z, Safran DG, Landon BE, et al. Health care spending and quality in year 1 of the alternative quality contract. NEJM. 2011;365(10):909–918. doi: 10.1056/NEJMsa1101416. [DOI] [PMC free article] [PubMed] [Google Scholar]
- 9.Miller HD. Creating Payment Systems to Accelerate Value-Driven Health Care: Issues and Options for Policy Reform. The Commonwealth Fund; Washington, D.C: 2007. [Google Scholar]
- 10.Porter ME. A strategy for health care reform--toward a value-based system. NEJM. 2009;361(2):109–112. doi: 10.1056/NEJMp0904131. [DOI] [PubMed] [Google Scholar]
- 11.Feder JL. A health plan spurs transformation of primary care practices into better-paid medical homes. Health Aff. 2011;30(3):397–399. doi: 10.1377/hlthaff.2011.0112. [DOI] [PubMed] [Google Scholar]
- 12.Kautter J, Pope GC, Trisolini M, et al. Medicare physician group practice demonstration design: quality and efficiency pay-for-performance. Health Care Financ Rev. 2007;29(1):15–29. [PMC free article] [PubMed] [Google Scholar]
- 13.O’Malley AJ, Zaslavsky AM, Elliott MN, et al. Case-mix adjustment of the CAHPS Hospital Survey. Health Serv Res. 2005;40(6 Pt 2):2162–81. doi: 10.1111/j.1475-6773.2005.00470.x. [DOI] [PMC free article] [PubMed] [Google Scholar]
- 14.Thomas JW, Grazier KL, Ward K. Economic profiling of primary care physicians: consistency among risk-adjusted measures. Health Serv Res. 2004;39(4 Pt 1):985–1003. doi: 10.1111/j.1475-6773.2004.00268.x. [DOI] [PMC free article] [PubMed] [Google Scholar]
- 15.Thomas JW, Grazier KL, Ward K. Comparing accuracy of risk-adjustment methodologies used in economic profiling of physicians. Inquiry. 2004;41(2):218–31. doi: 10.5034/inquiryjrnl_41.2.218. Summer. [DOI] [PubMed] [Google Scholar]
- 16.Staiger DO, Dimick JB, Baser O, et al. Empirically derived composite measures of surgical performance. Med Care. 2009;47(2):226–33. doi: 10.1097/MLR.0b013e3181847574. [DOI] [PubMed] [Google Scholar]
- 17.Jones HE. The identification of “unusual” health-care providers from a hierarchical model. The American Statistician. 2011;65(3):154–163. [Google Scholar]
- 18.Martinelli LP, McQuillen DP, Scull JA. Devaluing a specialty: the Centers for Medicare and Medicaid Services proposal to eliminate consultation codes. Clin Infect Dis. 2009 Oct 1;49(7):995–6. doi: 10.1086/606061. [DOI] [PubMed] [Google Scholar]
- 19.National Committee for Quality Assurance. HEDIS [Accessed January 13, 2012];NDC Lists - Table ABX-B: Antibiotic of Concern by NCQA Drug Class. 2011 Available at: http://www.ncqa.org/tabid/1274/Default.aspx. [Google Scholar]
- 20.AHRQ Quality Indicators—Guide to Prevention Quality Indicators . Hospital Admission for Ambulatory Care Sensitive Conditions. Agency for Healthcare Research and Quality; Rockville, MD: [Accessed January 13, 2012]. 2001. AHRQ Pub. No. 02-R0203. Available at: http://www.ahrq.gov/downloads/pub/ahrqqi/pqiguide.pdf. [Google Scholar]
- 21.Ginsburg PB. Spending to save--ACOs and the Medicare Shared Savings Program. NEJM. 2011;364(22):2085–2086. doi: 10.1056/NEJMp1103604. [DOI] [PubMed] [Google Scholar]
- 22.American Medical Association Practice Management Center . An introduction to risk assessment and risk adjustment models. American Medical Association; [Accessed September 15, 2011]. 2009. Available at http://www.ama-assn.org/resources/doc/psa/risk-assessment.pdf. [Google Scholar]
- 23.Pope GC, et al. Using diagnoses to describe populations and predict costs. Health Care Financ Rev. 2000;21(3):7–28. XXXXXX, XXXXXX. [PMC free article] [PubMed] [Google Scholar]
- 24.Pope GC, Kautter J, et al. Risk adjustment of Medicare capitation payments using the CMS-HCC model. Health Care Financ Rev. 2004;25(4):119–141. XXXXXX. [PMC free article] [PubMed] [Google Scholar]
- 25.Pope GC, et al. Principal inpatient diagnostic cost group model for Medicare risk adjustment. Health Care Financ Rev. 2000;21(3):93–118. XXXXXX, XXXXXX. [PMC free article] [PubMed] [Google Scholar]
- 26. [Accessed 2011];Verisk Health. DxCG Medical Classification System White Paper. 2011 Available at: http://www.veriskhealth.com/whitepaper-and-research/verisk-health-dxcg-medicalclassification-system-?-version-7.
- 27.Posner MA, Speckman J, et al. Using claims data to examine mortality trends following hospitalization for heart attack in Medicare. Health Serv Res. 2003;38(5):1253–62. doi: 10.1111/1475-6773.00175. XXXXXX. [DOI] [PMC free article] [PubMed] [Google Scholar]
- 28.Zaslavsky AM, Hochheimer JN, Schneider EC, et al. Impact of sociodemographic case mix on the HEDIS measures of health plan quality. Med Care. 2000;38(10):981–92. doi: 10.1097/00005650-200010000-00002. [DOI] [PubMed] [Google Scholar]
- 29.Zaslavsky AM, Epstein AM. How patients’ sociodemographic characteristics affect comparisons of competing health plans in California on HEDIS quality measures. Int J Qual Health Care. 2005 Feb;17(1):67–74. doi: 10.1093/intqhc/mzi005. [DOI] [PubMed] [Google Scholar]
- 30.Berwick DM, Nolan TW, Whittington J. The triple aim: care, health, and cost. Health Aff. 2008;27(3):759–769. doi: 10.1377/hlthaff.27.3.759. [DOI] [PubMed] [Google Scholar]
- 31.Sarfaty M, Wender R, Smith R. Promoting cancer screening within the patient centered medical home. CA Cancer J Clin. 2011 Nov-Dec;61(6):397–408. doi: 10.3322/caac.20125. doi: 10.3322/caac.20125. Epub 2011 Aug 25. [DOI] [PubMed] [Google Scholar]
- 32.McClellan M. Reforming payments to healthcare providers: the key to slowing healthcare cost growth while improving quality? J Econ Perspect. 2011;25(2):69–92. doi: 10.1257/jep.25.2.69. Spring. [DOI] [PubMed] [Google Scholar]
- 33.Arvantes J. [Accessed June 21, 2011];IBM plans to cover its employees’ deductibles, copays for primary care services. American Academy of Family Physicians News Now. 2009 Available at: http://www.aafp.org/online/en/home/publications/news/news-now/professionalissues/20091117ibm-prim-care.html. [Google Scholar]
Associated Data
This section collects any data citations, data availability statements, or supplementary materials included in this article.