

Abstract
Pancreatic cancer is now the fourth leading cause of cancer deaths in the United States, and it is associated with an alarmingly low 5-year survival rate of 5%. However, a patient's prognosis is considerably improved when the malignant lesions are identified at an early stage of the disease and removed by surgical resection. Unfortunately, the absence of a practical screening strategy and clinical diagnostic test for identifying premalignant lesions within the pancreas often prevents early detection of pancreatic cancer. To aid in the development of a molecular screening system for early detection of the disease, we have performed glycomic and glycoproteomic profiling experiments on 21 pancreatic cyst fluid samples, including fluids from mucinous cystic neoplasms and intraductal papillary mucinous neoplasms, two types of mucinous cysts that are considered high risk to undergo malignant transformation. A total of 80 asparagine-linked (N-linked) glycans, including high mannose and complex structures, were identified. Of special interest was a series of complex N-linked glycans containing two to six fucose residues, located predominantly as substituents on β-lactosamine extensions. Following the observation of these “hyperfucosylated” glycans, bottom-up proteomics experiments utilizing a label-free quantitative approach were applied to the investigation of two sets of tryptically digested proteins derived from the cyst fluids: 1) all soluble proteins in the raw samples and 2) a subproteome of the soluble cyst fluid proteins that were selectively enriched for fucosylation through the use of surface-immobilized Aleuria aurantia lectin. A comparative analysis of these two proteomic data sets identified glycoproteins that were significantly enriched by lectin affinity. Several candidate glycoproteins that appear hyperfucosylated were identified, including triacylglycerol lipase and pancreatic α-amylase, which were 20- and 22-fold more abundant, respectively, following A. aurantia lectin enrichment.
Pancreatic cancer is associated with a poor long term outcome with an actual 5-year survival rate of less than 5%. The absence of a practical screening strategy and clinical diagnostic test for identifying premalignant lesions within the pancreas prevents early detection of pancreatic cancer. Detection of early stage pancreatic cancer will likely result from novel clinical methods aimed at early tumor detection and molecular profiling of individuals at high risk for pancreatic carcinogenesis.
High-resolution imaging techniques have increased the detection of small, organ-based lesions in the intra-abdominal cavity. Incidental cysts within the pancreas are detected in ∼13% of patients undergoing cross-sectional imaging for nonspecific abdominal symptoms (1). Greater than 80% of these incidental cysts are non-neoplastic, so few carry malignant potential. Pancreatic cysts are divided into three broad pathologic entities: serous cystadenomas (SCA),1 mucinous cystic neoplasms (MCN), and intraductal papillary mucinous neoplasms (IPMN). In general, SCA are benign lesions; however, both MCN and IPMN are considered high risk cysts that can easily undergo malignant transformation (2).
Radiologic imaging analysis with computed tomography, magnetic resonance imaging, and endoscopic ultrasound can already determine the nature of many pancreatic cysts (3); however, discriminating benign neoplastic cysts from the ones that represent precursor lesions for invasive cancer remains a challenge. Moreover, serial surveillance imaging techniques are costly and consume health care resources over time.
Gene and protein biomarker systems for pancreatic cancer have been extensively investigated, as is evidenced by the list of potential biomarkers asserted in the review by Harsha et al. (4), but most candidates that have been tested clinically have not proved to be reliable for distinguishing between benign and malignant lesions of the pancreas (5, 6). In the further pursuit of alternative molecular markers, the patterns of glycosylation have been studied in sera of patients with pancreatic cancer using antibody- and lectin-based sensors (7, 8). A similar approach has been used to study pancreatic cyst fluids, targeting representative glycans on prominent candidate glycoprotein markers, including several of the mucins and carcinoembryonic antigen-related cell adhesion molecules. The study by Haab et al. (9) demonstrated that a combination of lectin-based detection using wheat germ agglutinin in tandem with antibody detection of carbohydrate antigen 19-9 (CA19-9) on the putative biomarker mucin-5AC could distinguish mucin-producing cysts (i.e. MCN and IPMN) from nonmucinous cysts with an 87% sensitivity at 86% specificity. Although the array strategies could prove suitable for discriminating benign from malignant pancreatic cysts in a clinical setting, the development of a tumor-specific biomarker system will likely depend on a somewhat clearer understanding of the molecular events associated with pancreatic carcinogenesis.
To date, only a few proteomic studies of pancreatic cyst fluids have been performed (10–12). Furthermore, there are no studies that describe the glycomic profiles of pancreatic cyst fluids in the literature to our knowledge. In the reported work, glycomic and proteomic profiles have been mapped for four different types of cysts, including pancreatic pseudocysts (PC), SCA, MCN, and IPMN. The data collected from this highly sensitive profiling have provided detailed insight into the diversity of glycans found in pancreatic cyst fluids. A subgroup of the cysts, including several IPMN, was observed here to contain hyperfucosylated N-linked glycans. Increased fucosylation has continued to be implicated in the progression of cancer (13–16), including specifically pancreatic cancer (16, 17). As such, hyperfucosylated N-glycans and glycoproteins have been targeted for quantitative label-free bottom-up glycoproteomic analysis.
EXPERIMENTAL PROCEDURES
Patients and Pancreatic Cyst Fluid Collection
Twenty-one patients with pancreatic cysts identified by high-resolution cross-sectional imaging, including computed tomography or magnetic resonance imaging, were included in this study. The indications for surgical extirpation were determined by clinical, radiologic, and biochemical parameters. The final histopathologic diagnosis for each pancreatic cyst, namely SCA, MCN, IPMN, or PC, was recorded from the final pathology report of the surgical specimen contained within the patient's electronic medical record. IPMNs were graded according to World Health Organization criteria with current terminology (e.g. low, moderate, and high grade dysplasia).
Pancreatic cyst fluids were collected intraoperatively by direct fine needle aspiration of the cyst within the surgical specimen. Cyst fluids were placed on ice immediately and aliquoted for storage at −80 °C. All cyst fluid collections were processed according to a standardized protocol. This study was approved by the Indiana University Institutional Review Board.
Removal of Particulates and Heavily Cross-linked Proteins from Cyst Fluids
Prior to proteomics and glycoproteomics analysis, a 45-μl aliquot of each cyst fluid was diluted with 45 μl of 10 mm phosphate buffer, and it was then centrifuged at 13.2 krpm for 15 min to stratify particulate matter, heavily cross-linked mucin-like proteins, and the supernatant containing solubilized proteins. The supernatant was then decanted and split: 70 μl for lectin enrichment followed by proteomic analysis and 20 μl for immediate proteomic analysis with no enrichment. The aliquots of the cyst fluids that were subjected to N-glycan analysis were stratified in the same way to remove the particulates and heavily cross-linked proteins, but the volumes were not equal for all samples. Rather, the volumes used for analyses were normalized to contain the same amount of protein as described below.
Permethylation and MALDI-TOF-MS of N-Linked Glycans
Pancreatic cyst fluid proteins were measured using a bicinchoninic acid protein concentration assay. The amount of cyst fluid subjected to glycomic profiling was chosen such that 200 μg of protein was contained therein. In this way, between 50 and 300 μl were used for each sample. The samples were denatured using 0.5% (w/v) SDS, 40 mm DTT in PBS, and incubated at 65 °C for 45 min. After incubation, the samples were cooled, and Nonidet P-40 was added to a final concentration of 1%. An aliquot containing 0.5 units peptide N-glycosidase F enzyme was then added to each sample and incubated at 37 °C for 24 h. The vendor (Northstar Bioproducts, East Falmouth, MA) defines 1 unit as the amount of enzyme required to catalyze the release of N-linked oligosaccharides from 1 nmol of denatured ribonuclease B in 1 min at 37 °C, pH 7.5.
N-Linked oligosaccharides were isolated from the other cyst fluid components using two separate solid phase extraction steps. Micro-Spin C18 columns (Harvard Apparatus, Holliston, MA) were washed and equilibrated with 85% acetonitrile/H2O (v/v) solution containing 0.1% trifluoroacetic acid (TFAA) and 5% acetonitrile/H2O (v/v) solution containing 0.1% TFAA, respectively. All of the samples were diluted to 0.2 ml with water and passed through the spin column five times. The columns were then washed with a 0.2-ml aliquot of 5% acetonitrile/H2O (v/v) solution containing 0.1% TFAA. The eluents containing the free N-glycans were then subjected to a solid phase extraction using MicroSpin charcoal columns (Harvard Apparatus, Holliston, MA).
Activated charcoal columns were equilibrated using 85% acetonitrile/H2O (v/v) solution containing 0.1% TFAA, followed by 5% acetonitrile/H2O (v/v) solution containing 0.1% TFAA. Samples in aqueous solution were then applied and washed first using H2O and then 5% acetonitrile/H2O (v/v) solution containing 0.1% TFAA. Salts and other by-products were eluted during the washing step, whereas the N-glycans retained on the activated charcoal microspin columns were recovered using a 0.2-ml aliquot of 50% acetonitrile/H2O (v/v) containing 0.1% TFAA. This wash was repeated four times, and all of the eluents were collected and evaporated using an Eppendorf Vacufuge.
Solid phase permethylation was performed using the spin column technique developed in our laboratory (18, 19). The samples were first dissolved in 70 μl of dimethylformamide, 5 μl of water, and 25 μl of iodomethane. The samples were then passed over a spin column packed with sodium hydroxide mesh beads a total of eight times. The columns were washed once with acetonitrile. A 400-μl aliquot of chloroform was then added to the samples followed by 1 ml of 500 mm NaCl for liquid-liquid extraction of impurities in the organic layer. Twice more, 1-ml aliquots of 500 mm NaCl were applied. The tubes were agitated and centrifuged, and the 500 mm NaCl was removed. The chloroform layer was saved and dried using a SpeedVac, and the extracted material was resolubilized using 4 μl of a 50/50 water/methanol mix.
All mass spectrometric measurements were performed on an Applied Biosystems (Framingham, MA) 4800 MALDI-TOF/TOF mass spectrometer. The glycan samples were resolubilized in 2.5 μl of 20/80% methanol/water solution, and a 0.5-μl aliquot was spotted on a stainless steel MALDI target and dried. The matrix, 2,5-dihydroxybenzoic acid, was prepared at a concentration of 10 mg/ml in a 50/50 methanol/water (v/v) solution with 1 mm sodium acetate to ensure complete cationization, and a 0.5-μl aliquot of 2,5-dihydroxybenzoic acid matrix was added to the sample spot and dried under vacuum to promote uniform crystallization. The instrument was operated in the positive ion reflector mode, and the m/z range from 1500 to 5100 was monitored. A total of 2000 laser shots were applied to each sample.
Lectin Enrichment of Glycoproteins in Pancreatic Cyst Fluid Samples
A 40-μl aliquot of agarose-bound Aleuria aurantia lectin (AAL) slurry (50/50, v/v) from Vector Laboratories (Burlingame, CA) was added to a 1.5-ml tube so that a settled bed volume of 20 μl of agarose-bound AAL was provided. The gel was washed in triplicate with 200 μl of lectin binding buffer (Tris, pH 7.5, 0.15 m NaCl, 1 mm Ca+2, 0.08% NaN3) for a total wash of 30 bed volumes. Next, a 70-μl aliquot of 50% pancreatic cyst fluid in 10 mm phosphate, pH 7.4, was applied to the gel bed, and the mixture was gently vortexed. The enrichment was allowed to proceed for 18 h at 4 °C with gentle agitation. The mixture was centrifuged for 1 min at 2 krpm, and the supernatant was removed. The gel bed was washed twice with 200 μl of deionized water. Bound proteins were eluted by the addition of 200 μl of 0.1 m acetic acid followed by vortexing. The mixture was centrifuged for 1 min at 2 krpm, and the eluted proteins were pipetted into a 1.5-ml tube. The elution procedure was repeated, and the two 200-μl aliquots were combined. This procedure was performed on each of the 21 pancreatic cyst fluids.
Protein Denaturation, Reduction, Alkylation, and Trypsin Digestion
For both lectin-enriched and nonenriched cyst fluids, the following desalting procedure was performed prior to trypsin digestion. Cyst fluids were desalted with 3-kDa molecular mass cutoff filters (Millipore, Bellerica, MA). The filter membranes were prepared prior to the addition of cyst fluid by washing with 500 μl of deionized water, followed by centrifugation for 15 min at 10 krpm. Remaining water was removed by inverting the molecular mass cutoff cartridge and centrifuging for 1 min at 1 krpm. The cyst fluids were then applied to the membranes. For the nonenriched cyst fluids, 380 μl of 50 mm ammonium bicarbonate was added to the initial volume of 20 μl to bring the total volume to 400 μl, whereas the lectin-enriched glycoprotein samples were already in 400 μl. The samples were centrifuged for 15 min at 10 krpm and then washed in triplicate with 400 μl of 50 mm ammonium bicarbonate. Filtration cartridges were then inverted into new collection tubes and centrifuged for 2 min at 1000 rpm. The collection volume for each sample was ∼20 μl.
The 20-μl aliquots were dried in a vacuum centrifuge. Each sample was resuspended in 6 m guanidine HCl to denature proteins. Next, a 0.5-μl aliquot of 200 mm DTT was added, and the samples were incubated for 30 min at 60 °C to reduce disulfide bridges between cysteine side chains. Cysteine thiols were then alkylated by the addition of a 2-μl aliquot of 200 mm iodoacetamide, and the samples were incubated for 30 min at room temperature. To quench alkylation, an additional 0.5-μl aliquot of 200 mm DTT was added, and the sample was incubated for 30 min at room temperature. The guanidine HCl concentration was then diluted to <2 m by the addition of 40 μl of 50 mm ammonium bicarbonate buffer prior to trypsin digestion. Finally, a 4-μl aliquot of trypsin (1 μg/μl) was added to ensure a minimum enzyme:substrate ratio of 1:20. According to its specificity, trypsin was used to cleave the peptide backbone on the C-terminal side of lysine and arginine residues, except where proline was the next consequent amino acid.
Liquid Chromatography-Mass Spectrometry Analysis of Proteins and Glycoproteins
Trypsin-digested protein samples were analyzed by reversed phase liquid chromatography interfaced through nanoelectrospray to an LTQ-Orbitrap mass spectrometer or to an LTQ-FTMS Ultra (Thermo Scientific, Waltham, MA). Reversed phase liquid chromatography was performed on a Dionex Ultimate 3000 system (Sunnyvale, CA). The analytical column was 75-μm inner diameter × 15 cm, packed in-house with Magic C18AQ (200 Å pores, 3-μm particles) from Michrom Bioresources, Inc. (Auburn, CA). A gradient separation was performed with 0.1% formic acid, 3% ACN in water, hereafter called solvent A, and 0.1% formic acid in ACN, which will be referred to as solvent B. The peptides were separated over a multistep gradient, beginning with a 10-min equilibration period in which the column was washed with 97% solvent A, followed by a 45-min linear increase from 3 to 55% solvent B and then a second linear step from 55–85% solvent B over 5 min. The column was washed in 85% solvent B for 5 min and then rapidly switched to 97% solvent A over 5 min to re-establish the initial condition for the next sample. For each MS scan, the five highest intensity precursor ions were subjected to collision-induced dissociation for peptide identification downstream. An exclusion window of 30 s was used to prevent a precursor m/z from being selected for fragmentation more than once within said time frame, allowing for fragmentation of lower abundant precursors.
Peptide Identification and Label-free Quantification
MS/MS fragmentation spectra were compiled into a candidate peaklist using the TurboRAW2MGF utility developed in-house (20) and searched against the UniProt database release 14.0 (20,328 sequences), Homo sapiens taxonomy, using the MASCOT v2.3 search engine. The following criteria were used: trypsin selected as the enzyme, one missed cleavage allowed from trypsin digestion, ± 0.02 Da tolerance for precursors, ± 0.8 Da for fragment peaks, +2 and +3 charges, carbamidomethylation of cysteine (fixed modification), oxidation of methionine (variable modification), ion score ≥ 30, expect ≤ 0.1, accept only bold red queries, rank 1 identifications, and a minimum peptide mass of 600.00 Da. A randomized UniProt database was queried with the same specifications, and the results were used to estimate the false discovery rate as previously described (21). The false discovery rate was conservatively estimated at ≤0.6%.
A label-free quantitative approach was used to measure the relative abundance of identified proteins as a function of the confidently identified peptides as described previously (20). Briefly, ProteinQuant Suite, an in-house developed software tool, was utilized to reconstruct extracted ion chromatograms for precursor m/z values (± 0.03 Da) that were confidently identified as peptides through fragmentation spectral searches of the UniProt database. To ensure that extracted ion chromatograms for the same peptides were integrated to generate relative quantitative data, proteins in each cyst fluid were quantified using a compiled master file of all identified peptides. MS files in the RAW format were converted to the universal mzXML format. For each peptide, the peak apex was then automatically set by searching for the maximum signal intensity within a 5-min window of the retention time for the precursor scan that was stored by MASCOT. Finally, peak edges were defined by the points where the signal intensity dropped to less than three times the base-line intensity, with a further constraint that the peak width could not exceed 1 min. Peak areas were then calculated by numeric integration. For each protein reported, the protein area is a sum of the peptide areas.
Statistical Analyses
Single-factor analysis of variance was performed with the Data Analysis Toolpak in Microsoft Excel 2007 and was used to generate the p values for differential glycoprotein expression described under “Results” and in Table III. Principal component analysis of covariance was performed with the MiniTab 16.1 program using the relative intensities of the individual N-glycans that were tabulated and organized with Peak Calc (in-house software tool). The score plot from principal component analysis is depicted in Fig. 1. An additional multivariate clustering analysis was performed using the glycoprotein intensity data generated with ProteinQuant (20) to group the samples based on a series of pairwise comparisons of their relative similarities. This analysis was also performed with MiniTab 16.1 and was used to generate the dendrogram in Fig. 4.
Table III. Proteins overexpressed in multiply fucosylated pancreatic cyst fluids.
| Accession | Protein name (alternate name) | Comparative proteomics |
|||
|---|---|---|---|---|---|
| No enrichment |
AAL-enriched |
||||
| G1/G2* | p value | G1/G2* | p value | ||
| P00995 | Pancreatic secretory trypsin inhibitor (tumor-associated trypsin inhibitor) | 8.4 | 0.0040 | 50.1 | 0.0101 |
| P04746 | Pancreatic α-amylase | 1.7 | 0.0476 | 22.4 | 0.0017 |
| P16233 | Pancreatic triacylglycerol lipase | 2.9 | 0.0001 | 20.2 | 0.0009 |
| P07478 | Trypsin-2 | 6.3 | 0.0010 | 15.6 | 0.0048 |
| P09093 | Chymotrypsin-like elastase family member 3A (elastase-3A) | 2.5 | 0.0157 | 11.2 | 0.0158 |
| P19835 | Bile salt-activated lipase | 3.5 | 0.0001 | 9.8 | 0.0067 |
| P05451 | Lithostathine-1-α (pancreatic stone protein) | 5.9 | 0.0012 | 5.7 | 0.0030 |
| P08217 | Chymotrypsin-like elastase family member 2A (elastase-2A) | 3.0 | 0.0022 | 4.8 | 0.0010 |
| Q99895 | Chymotrypsin-C (caldecrin) | 4.0 | 0.0013 | 2.7 | 0.0017 |
* G1, cyst fluids containing multiply fucosylated glycans; G2, cyst fluids not containing multiply fucosylated glycans.
Fig. 1.

Principal component analysis of glycomic profiles for N-linked glycans found in pancreatic cyst fluid. A dashed oval has been added to highlight the clustering of samples where hyperfucosylation was identified.
Fig. 4.

Dendrogram for lectin-enriched glycoproteomic analysis of pancreatic cyst fluid samples. The segregated branch on the far left contains four samples that exhibited hyperfucosylated glycans: P91, P357, P47, and P103. (No glycomic data were available for P221.)
RESULTS
Glycomic Profiles Generated by MALDI-TOF-MS
The clinicopathologic details of the pancreatic cysts are included in Table I. A total of 20 pancreatic cyst fluids were analyzed by glycomic profiling. One of the IPMN cyst fluids, P221, did not contain sufficient glycoprotein content for N-glycan profiling following the removal of mucinous cross-linked material.
Table I. Clinical and pathological features of pancreatic cyst fluids.
F, female; M, male; W, white; N, no; Y, yes.
| Cyst fluid sample | Patient age | Patient gender | Patient race | Smoking history | Pancreatitis history | Histologic diagnosis | Histologic grade |
|---|---|---|---|---|---|---|---|
| P25 | 79 | F | W | N | N | IPMN | Low |
| P39 | 65 | F | W | N | N | IPMN | Low |
| P47 | 70 | F | W | N | Y | IPMN | Low |
| P91 | 69 | F | W | N | Y | IPMN | Low |
| P334 | 72 | F | W | N | N | IPMN | Low |
| P342 | 68 | F | W | N | N | IPMN | Low |
| P357 | 53 | F | W | Y | Y | IPMN | Low |
| P14 | 59 | F | W | N | N | MCN | |
| P21 | 51 | F | W | N | N | MCN | |
| P27 | 43 | F | W | Y | Y | MCN | |
| P30 | 32 | F | W | N | N | MCN | |
| P116 | 30 | F | W | N | Y | MCN | |
| P316 | 52 | F | W | Y | N | MCN | |
| P106 | 61 | F | W | Y | N | SCA | |
| P128 | 55 | F | W | N | N | SCA | |
| P345 | 58 | F | W | N | N | SCA | |
| P28 | 47 | F | W | Y | Y | PC | |
| P50 | 59 | F | W | Y | Y | PC | |
| P103 | 67 | M | W | N | Y | PC | |
| P113 | 54 | M | W | Y | Y | PC |
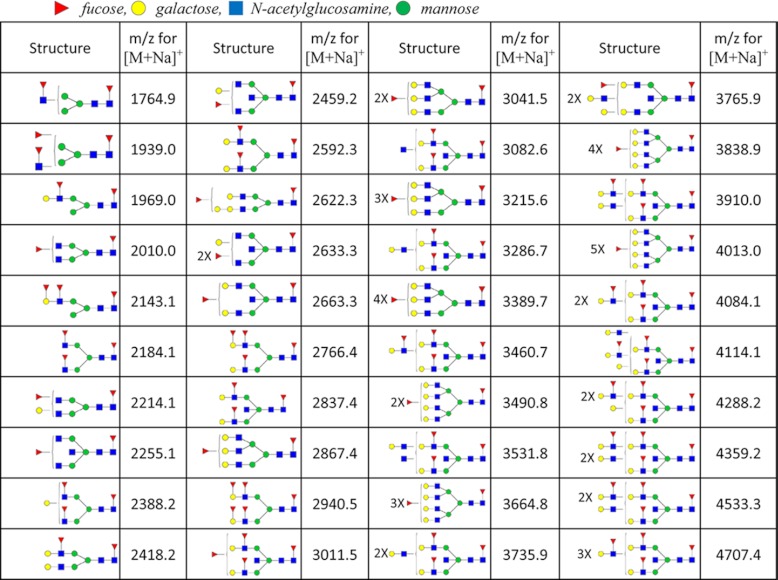
One hundred and three possible carbohydrate compositions were searched, and eighty structures were identified, and a table containing the mean relative abundance for each structure in the four pathological groups of cysts was compiled (supplemental Table 1 and other supplemental materials). Fragmentation data (not shown) indicates that the list includes mostly high-mannose and complex glycans, although some hybrid structures (part high-mannose, part complex) were detected at low abundance. As a consequence of the low numbers for the individual diagnoses (NSCA = 3, NPC = 4, NMCN = 6, and NIPMN = 7), the relative abundances included in the table are only rough approximations, and analysis of many more cysts would be necessary to clearly define the ranges of relative abundance for each of these structures in the pathologically different fluids. However, from a qualitative review of the mass spectra, it was clear that the profiles from pathologically different fluids were considerably different from one another in terms of the structures present and their expression levels. To statistically describe the overall character of the cyst fluids, a principal component analysis was performed based on the relative intensities of identified glycans (Fig. 1). The PC clustered tightly in both principal components 1 and 2, excluding sample P103; the SCA, MCN, and IPMN samples did not group significantly according to their respective diagnoses. This observation could be a result of the range of glycoprotein concentrations in the different fluids. Interestingly, samples to the right of the principal component 1 axis were dominated by fucosylated glycans. Samples P14, P91, P334, P47, P357, and P103 all contained several structures with two or more fucoses. The masses and associated structures for the glycans containing two or more fucoses are listed in Table II. Some of these glycans defy the orthodox biosynthesis of N-glycans, such as m/z for [M + Na]+ at 1693.9 and 1939.0, and are detected at trace amounts. These structures may in fact be free glycans within the cyst fluid or potentially degraded polylactosamine chains.
Table II. N-Glycan structures and permethylated masses that contain two or more fucose residues.
Red triangles represent fucose, yellow circles represent galactose, blue rectangles represent N-acetylglucosamine, and green circles represent mannose.
Hyperfucosylated Glycans
In six of the cyst fluids (described in the previous section), a number of complex glycans were identified that contained multiple fucoses, ranging from two to six fucose residues attached to a single structure. Of the six cyst fluids containing multiply fucosylated glycans, there were four IPMNs, one MCN, and one PC. These glycans also contained a high number of N-acetylglucosamine and galactose residues (Fig. 2A). A representative postsource decay fragmentation spectrum for the precursor ion at m/z 3460.6 in Fig. 2A revealed a peak at 660.1, corresponding to a glycan b-ion fragment mass (using the fragment nomenclature from Domon and Costello (23)) for permethylated galactose, fucose, and N-acetylglucosamine. This is the trisaccharide composition of the Lewis a and Lewis x antigens. Fragmentation further indicated, through the characteristic peaks at m/z 864.1, 1046.6, and 1283.4 (annotated in Fig. 2B), that multiple Lewis antigens were directly linked in an extended contiguous structure. For a more precise structural elucidation, using exoglycosidases as analytical reagents (24) would have provided no additional information, because the hyperfucosylated structures are attached to the extended lactosamines, a modification that inhibits the digestion with β1–4,6-galactosidase. This “limitation” of galactosidase was recently exploited for positional determination of core versus outer arm attachment of fucose of singly fucosylated glycans in our recent investigation of serum glycans in ovarian cancer (24). Notably, N-acetylneuraminic acid was not attached to any of the measured highly fucosylated structures. The small amounts of materials available for analysis preclude the use of NMR-based structural elucidation methods.
Fig. 2.

MALDI-TOF-TOF-MS of permethylated hyperfucosylated glycans in sample P91. A, m/z range 1500–3250. B, m/z range 3250–5100 (3× zoom). C, postsource decay fragmentation of m/z 3459.2, corresponding to Hex6HexNAc6dHex4, in which fucosylated lactosamine and bisected core structural peaks are observed. Red triangle, fucose; yellow circle, galactose; blue square, N-acetylglucosamine; green circle, mannose.
Proteomic Analysis of Pancreatic Cyst Fluids
A total of 247 proteins were identified through the bottom-up proteomic analysis. Although there were significant overlaps between the different groups (i.e. 137 proteins were identified in more than one type of cyst), many proteins were unique to one of the groups: 22 in PC, 10 in SCA, 23 in MCN, and 55 in IPMN. A table of all identified proteins is included in supplemental Table 2. For proteins identified in only one type of cyst, the pathological condition is also noted. It is expected that the majority of the proteins that were identified in only a single fluid are in fact present in the other types as well, only at lower relative abundance, and thus masked or entirely suppressed by coeluting peptides from high abundant proteins during the electrospray ionization event. A more extensive separation strategy prior to LC-MS such as two-dimensional gel electrophoresis or multidimensional liquid chromatography is expected to provide many more protein identifications, particularly in the SCA, that contain several highly abundant serum proteins. A recently published proteomic study that utilized immunoaffinity depletion and SDS-PAGE for a qualitative proteomic analysis of cyst fluids prior to LC-MS demonstrated this principle (12).
A further qualitative characterization of the identified proteins was performed based on the gene ontology annotations (GOA) for the proteins identified in each type of cyst. The molecular function GOA were compiled using STRAP (Software Tool for Researching Annotations of Proteins) (25). The data have been visualized in Fig. 3. An overall similarity was observed between the four pathologic groups with regard to GOA, although there were a few differences as well. SCA fluids were associated with only 13 GOA for catalytic activity, whereas there were 36, 36, and 50 for PC, MCN, and IPMN, respectively. Furthermore, IPMN had a moderately higher occurrence of GOA for the structural molecule activity with 17 compared with 7, 3, and 4 for MCN, PC, and SCA, respectively.
Fig. 3.

Molecular function gene ontology annotations for IPMN, MCN, SCA, and PC.
A label-free comparison of the differential abundance of 186 of the identified proteins is listed in supplemental Table 3. The remaining 61 identified proteins were not present at a sufficient signal-to-noise threshold for quantification. The analysis showed that, after removal of large mucinous cross-linked molecules along with coprecipitates by centrifugal sedimentation, the major blood proteins (e.g. serum albumin, hemoglobin subunits α and β, transferrin, and immunoglobulin G) were dominant in all types of cysts. Approximately 90% of quantified proteins were present at a relative abundance value of less than 0.01 (i.e. <1%) of the total integrated peak area for each LC-MS experiment. Two of the abundant pancreatic enzymes, α-amylase and triacylglycerol lipase, were of similar relative intensity in each type of cyst, with the exception that the relative abundance of triacylglycerol lipase in SCA was approximately half that of the other groups; α-amylase normalized abundances were 0.021 (IPMN), 0.019 (MCN), 0.022 (SCA), and 0.018 (PC); triacylglycerol lipase normalized abundances were 0.022 (IPMN), 0.019 (MCN), 0.009 (SCA), and 0.020 (PC). Although all of the relative abundances are listed in supplemental Table 3, the values of these two enzymes have been included here for their relevance in the context of the following results and discussion.
Glycoproteomic Analysis of Lectin-enriched Cyst Fluids
Following the identification of several multiply fucosylated glycans in six of the cyst fluid samples during glycomic profiling, a semitargeted glycoproteomic investigation was performed in which AAL-agarose was utilized to enrich fucosylated glycoproteins. After LC-MS/MS experiments, the label-free approach was used to generate relative quantitative data for 122 proteins. A hierarchical comparison of statistical similarity was performed to characterize the quantitative lectin-enriched profiles for all samples, and the data were illustrated by the dendrogram shown in Fig. 4. A striking feature of this analysis was the isolated “branch” on the far left that included P221, P91, P357, P47, and P103. The clinical diagnoses for these samples were IPMN, IPMN, IPMN, IPMN, and PC, respectively. Furthermore, four of these five samples, P91, P357, P47, and P103, were also observed to contain a high abundance of multiply fucosylated glycans in the glycomic profiling experiments.
The initial observation of multiply fucosylated glycans in the glycomic profiles and the confirmed differences in fucosylation-enriched proteomic profiles led to a statistical analysis of the individual proteins that were up-regulated in these cyst fluids. The fluids were divided into two groups; those that did contain an abundance of highly fucosylated glycans were termed Group 1: P91, P30, P47, P103, P334, and P357, and those that did not were termed Group 2: P14, P21, P25, P27, P28, P39, P50, P106, P116, P221, P316, P342, P345, P128, and P133. The relative abundance ratios between the two groups were determined for all quantified proteins (supplemental Table 3 and other supplemental materials). Single-factor analysis of variance was performed for the proteins with relative abundance ratios ≥ 2, and p values were determined. A total of 21 proteins were identified to be more than 2-fold increased in relative abundance and of these, nine were found significant (p ≤ 0.05), as listed in Table III. Moreover, the statistically significant proteins ranged approximately 2 orders of magnitude in their relative signal intensity (data not shown).
The enzymes α-amylase and triacylglycerol lipase, which were abundant in similar amounts in each of the different pathologic groups (i.e. IPMN, MCN, SCA, and PC), were observed statistically higher, with ratios of 1.7 and 2.9, respectively, in Group 1 compared with Group 2 using the nonenriched proteomic data. Furthermore, they were dramatically increased in relative abundance following the AAL-enriched proteomic experiments: ratios of 22.4 and 20.2, respectively. A similar trend of increased abundance ratio following AAL enrichment can be seen for seven of the nine proteins in the table.
DISCUSSION
The role of glycosylation in cancer and the potential to utilize specific glycans as molecular markers of the disease continue to be high profile topics in biomedical research. The biological role of the glycan biomarker, CA19-9, has been studied in pancreatic cancer extensively (26–28). Its value as a diagnostic (29–31) and prognostic (32–34) tool has been tested repeatedly. Reports of the overall sensitivity and specificity of CA19-9 for prediction of pancreatic malignancy have varied widely and have been considered inconclusive. Recent studies have reported that serum CA19-9 levels can detect pancreatic cancer independently (35) or as a component of a multiple marker panel (36), although other reports have concluded that it is not specific for the diagnosis of cancer (12, 37). In addition to CA19-9, increases in core fucosylation of serum proteins such as ribonuclease 1 (38) and both core and outer arm fucosylation of haptoglobin (16, 17) have been reported as putative biomarkers. A considerable amount of research has been conducted to investigate glycan biomarkers as a potential molecular marker system for pancreatic cancer; however, very little information is available with regard to the variety and abundance of glycans (or glycoproteins) that are present in the tissues and fluids of the pancreas. The recent publication of a qualitative proteomic investigation, in which eight cyst fluids were analyzed by a standard bottom-up proteomics approach (12), highlights the further need for in-depth “omics-based” profiling of these pertinent biological materials using the state of the art instrumentation. Our current report contributes significantly to such efforts.
In the present study, glycomic profiles of N-linked glycans have been generated by mass spectrometry for 20 pancreatic cyst fluids, which marks the first study of this kind to date. A number of the cyst fluids have been identified to contain hyperfucosylated glycans. The structures of these oligosaccharides are uncommon, and to our knowledge, they have not been reported previously in pancreatic cyst fluid. We have identified them more frequently and in a higher abundance in IPMN and MCN than in SCA and PC. Our MS fragmentation data indicate that these glycans contain multiples of the Lewis antigen, often connected in series on the antennae extended from the chitobiose core. The presence of di- and trifucosylated lactosamine extensions on glycans has been previously reported in the tissue (39) and serum (40) of lung cancer patients using monoclonal antibodies with specificity toward these two antigens (41). Nonetheless, these types of glycans are not routinely observed in sera of different cancer patients during glycomic profiling (42, 43). It is important to note that none of the multiply fucosylated glycans described herein are sialylated, and thus, they do not contribute to the concentration of CA 19-9. Finally, whereas the data from this study strongly suggest that these multiply fucosylated glycans are more common and abundant in the mucinous cysts, a more comprehensive investigation for each pathological group would be needed to properly evaluate their diagnostic potential.
The search for molecular markers of disease has continued to challenge researchers. The enormous complexity of biological materials and the large dynamic range of protein concentrations have often been critical barriers to discovering specific biomarkers for individual diseases. The inherent problem of detecting tumor-specific molecules at an early stage of the disease is that the tumors themselves are small, and proteins leaked into accessible biological fluids that are readily available for medical testing (e.g. saliva, blood, urine) are consequently present in low abundance, typically believed to be in the low ng/ml range or lower. Understanding the prevalence of the glycans and glycoproteins in the premalignant cysts (where they are present at much higher concentration) will aid future studies that seek to develop marker systems for more easily accessed materials such as blood serum.
Enrichment with AAL provided an important means for targeting fucosylated glycoproteins for proteomic analysis. A label-free quantitative approach was further used to identify a number of proteins that were up-regulated in the cyst fluids that also contained multiply fucosylated glycans. Pancreatic α-amylase and triacylglycerol lipase were two of the most abundant proteins in the hyperfucosylated fluids. Both have been used clinically in the past as markers of pancreatic disease, and both are glycoproteins with known sites of N-linked glycosylation. Clinically, assays have been routinely used to estimate their concentrations in serum (44), but little is known about the exact nature of their glycosylation and how it is affected by pancreatic cancer. Unlike many other putative markers of pancreatic cancer that originate in the diseased tissue, both enzymes are present at appreciable levels in the serum (ng/ml) and could thus be targeted for antibody capture followed by lectin detection. Moreover, with high sensitivity immunoaffinity chromatography, it could be possible to isolate these glycoproteins for the individual glycomic profiling of each.
Following the lectin enrichment, elastase 2A and elastase 3A were observed in ∼5-fold and ∼11-fold higher abundance, respectively, in the multiply fucosylated fluids. Although elastase 3A has one site for N-linked glycosylation, elastase 2A does not contain a canon N-glycan motif, nor has it been identified to be O-glycosylated. However, a previous study of the elastase proteins by Wendorf et al. (45) identified glycans containing one to three fucose residues. Several of these N-glycans do not fit the typical pattern in human glycan biosynthesis, but we identified many of the same structures. These glycans did not contain N-acetyllactosamine extensions, however, which provide the “scaffold” for the structures with four to six fucoses on the individual glycans identified in this study.
It is notable that two of the proteins that were significantly higher in relative abundance following AAL enrichment, namely pancreatic secretory trypsin inhibitor and trypsin-2, have not been identified as glycoproteins, nor do they exhibit the tripeptide motif (NX(S/T), where X is not P) for N-linked glycosylation. Because we lack a thorough understanding of the protein interactome within pancreatic cyst fluid, it is not possible to conclusively explain the presence of these two nonglycosylated proteins following lectin enrichment. Nonetheless, it is possible that their presence may be in part attributable to interactions with the glycoprotein chymotrypsin-C (caldecrin), in the cases of both proteins, and with several of the trypsins, chymotrypsins, and elastases, in the case of the pancreatic secretory trypsin inhibitor. Regarding trypsin-2 (anionic trypsin), it has recently been described how chymotrypsin-C deactivates all forms of trypsin, and although the reaction kinetics have not been thoroughly characterized; data presented by Szmola and Sahin-Tóth (46) suggest that it is a relatively slow process. Because AAL enrichment was performed in nondenaturing conditions, additional protein-protein interactions such as this could persist simultaneously. Similarly, the protein pancreatic secretory trypsin inhibitor has been shown to bind strongly to several pancreatic enzymes, including trypsin, chymotrypsin, and elastase (47). The strong relative expression of pancreatic secretory trypsin inhibitor in the multiply fucosylated samples, although probably not related to the enrichment itself, was intriguing because this protein has previously been linked with chronic pancreatitis (48) and a high incidence of pancreatic cancer (22, 49).
In summary, 21 cyst fluids were collected by fine needle aspiration directly from the pancreatic cysts during surgical resection. A total of 20 fluids from four clinical diagnoses (SCA, PC, MCN, and IPMN) were glycomically profiled by MALDI-TOF-MS, and 21 were proteomically profiled by LC-MS/MS. Six of the cyst fluids exhibited high levels of multiple fucosylation. A lectin enrichment investigation in which AAL was used to target fucosylated glycoproteins revealed several proteins that were significantly increased in abundance in the hyperfucosylated cyst fluids. Among the proteins that were significantly overexpressed in the multiply fucosylated samples were several abundant glycoproteins, including pancreatic α-amylase, triacylglycerol lipase, elastase 2A, elastase 3A, and bile salt-stimulated lipase. These glycoproteins are strong candidates to bear the multiply fucosylated N-linked glycans, although a targeted study in which each protein would be purified through immunoaffinity chromatography, or a comparable technique, would be necessary to determine the exact nature of their glycosylation pattern.
Acknowledgments
We thank the MetaCYT Biochemical Analysis Center at Indiana University for the use of the LTQ-Orbitrap mass spectrometer.
Footnotes
* This work was financially supported by Grant U01 CA128535 from the National Cancer Institute.
 This article contains supplemental material.
1 The abbreviations used are:
- SCA
- serous cystadenoma
- AAL
- A. aurantia lectin
- CA19-9
- carbohydrate antigen 19-9
- GOA
- gene ontology annotation
- IPMN
- intraductal papillary mucinous neoplasm
- MCN
- mucinous cystic neoplasm
- PC
- pseudocyst
- TFAA
- trifluoroacetic acid
- krpm
- kilo rotations per minute.
REFERENCES
- 1. Lee K. S., Sekhar A., Rofsky N. M., Pedrosa I. (2010) Prevalence of incidental pancreatic cysts in the adult population on MR imaging. Am. J. Gastroenterol. 105, 2079–2084 [DOI] [PubMed] [Google Scholar]
- 2. Sand J. A., Hyoty M. K., Mattila J., Dagorn J. C., Nordback I. H. (1996) Clinical assessment compared with cyst fluid analysis in the differential diagnosis of cystic lesions in the pancreas. Surgery 119, 275–280 [DOI] [PubMed] [Google Scholar]
- 3. Visser B. C., Yeh B. M., Qayyum A., Way L. W., McCulloch C. E., Coakley F. V. (2007) Characterization of cystic pancreatic masses: Relative accuracy of CT and MRI. AJR Am. J. Roentgenol. 189, 648–656 [DOI] [PubMed] [Google Scholar]
- 4. Harsha H. C., Kandasamy K., Ranganathan P., Rani S., Ramabadran S., Gollapudi S., Balakrishnan L., Dwivedi S. B., Telikicherla D., Selvan L. D., Goel R., Mathivanan S., Marimuthu A., Kashyap M., Vizza R. F., Mayer R. J., Decaprio J. A., Srivastava S., Hanash S. M., Hruban R. H., Pandey A. (2009) A compendium of potential biomarkers of pancreatic cancer. PLoS Med. 6, e1000046. [DOI] [PMC free article] [PubMed] [Google Scholar]
- 5. Parker L. A., Porta M., Lumbreras B., López T., Guarner L., Hernández-Aguado I., Carrato A., Corominas J. M., Rifà J., Fernandez E., Alguacil J., Malats N., Real F. X. (2011) Clinical validity of detecting K-ras mutations for the diagnosis of exocrine pancreatic cancer: A prospective study in a clinically-relevant spectrum of patients. Eur. J. Epidemiol. 26, 229–236 [DOI] [PubMed] [Google Scholar]
- 6. Joergensen M. T., Heegaard N. H., Schaffalitzky de Muckadell O. B. (2010) Comparison of plasma Tu-M2-PK and CA19-9 in pancreatic cancer. Pancreas. 39, 243–247 [DOI] [PubMed] [Google Scholar]
- 7. Yue T., Goldstein I. J., Hollingsworth M. A., Kaul K., Brand R. E., Haab B. B. (2009) The prevalence and nature of glycan alterations on specific proteins in pancreatic cancer patients revealed using antibody-lectin sandwich arrays. Mol. Cell. Proteomics. 8, 1697–1707 [DOI] [PMC free article] [PubMed] [Google Scholar]
- 8. Zhao J., Patwa T. H., Qiu W., Shedden K., Hinderer R., Misek D. E., Anderson M. A., Simeone D. M., Lubman D. M. (2007) Glycoprotein microarrays with multi-lectin detection: Unique lectin binding patterns as a tool for classifying normal, chronic pancreatitis and pancreatic cancer sera. J. Proteome Res. 6, 1864–1874 [DOI] [PubMed] [Google Scholar]
- 9. Haab B. B., Porter A., Yue T., Li L., Scheiman J., Anderson M. A., Barnes D., Schmidt C. M., Feng Z., Simeone D. M. (2010) Glycosylation variants of mucins and CEACAMs as candidate biomarkers for the diagnosis of pancreatic cystic neoplasms. Ann. Surg. 251, 937–945 [DOI] [PMC free article] [PubMed] [Google Scholar]
- 10. Scarlett C. J., Samra J. S., Xue A., Baxter R. C., Smith R. C. (2007) Classification of pancreatic cystic lesions using SELDI-TOF mass spectrometry. ANZ J. Surg. 77, 648–653 [DOI] [PubMed] [Google Scholar]
- 11. Ke E., Patel B. B., Liu T., Li X. M., Haluszka O., Hoffman J. P., Ehya H., Young N. A., Watson J. C., Weinberg D. S., Nguyen M. T., Cohen S. J., Meropol N. J., Litwin S., Tokar J. L., Yeung A. T. (2009) Proteomic analyses of pancreatic cyst fluids. Pancreas 38, e33–e42 [DOI] [PMC free article] [PubMed] [Google Scholar]
- 12. Cuoghi A., Farina A., Z'graggen K., Dumonceau J. M., Tomasi A., Hochstrasser D. F., Genevay M., Lescuyer P., Frossard J. L. (2011) Role of proteomics to differentiate between benign and potentially malignant pancreatic cysts. J. Proteome Res. 10, 2664–2670 [DOI] [PubMed] [Google Scholar]
- 13. Miyoshi E., Moriwaki K., Nakagawa T. (2008) Biological function of fucosylation in cancer biology. J. Biochem. 143, 725–729 [DOI] [PubMed] [Google Scholar]
- 14. Dwek M. V., Jenks A., Leathem A. J. (2010) A sensitive assay to measure biomarker glycosylation demonstrates increased fucosylation of prostate specific antigen (PSA) in patients with prostate cancer compared with benign prostatic hyperplasia. Clin. Chim. Acta 411, 1935–1939 [DOI] [PubMed] [Google Scholar]
- 15. Shah M., Telang S., Raval G., Shah P., Patel P. S. (2008) Serum fucosylation changes in oral cancer and oral precancerous conditions: α-l-Fucosidase as a marker. Cancer 113, 336–346 [DOI] [PubMed] [Google Scholar]
- 16. Lin Z., Simeone D. M., Anderson M. A., Brand R. E., Xie X., Shedden K. A., Ruffin M. T., Lubman D. M. (2011) Mass spectrometric assay for analysis of haptoglobin fucosylation in pancreatic cancer. J. Proteome Res. 10, 2602–2611 [DOI] [PMC free article] [PubMed] [Google Scholar]
- 17. Okuyama N., Ide Y., Nakano M., Nakagawa T., Yamanaka K., Moriwaki K., Murata K., Ohigashi H., Yokoyama S., Eguchi H., Ishikawa O., Ito T., Kato M., Kasahara A., Kawano S., Gu J., Taniguchi N., Miyoshi E. (2006) Fucosylated haptoglobin is a novel marker for pancreatic cancer: A detailed analysis of the oligosaccharide structure and a possible mechanism for fucosylation. Int. J. Cancer 118, 2803–2808 [DOI] [PubMed] [Google Scholar]
- 18. Kang P., Mechref Y., Klouckova I., Novotny M. V. (2005) Solid-phase permethylation of glycans for mass spectrometric analysis. Rapid Commun. Mass Spectrom. 19, 3421–3428 [DOI] [PMC free article] [PubMed] [Google Scholar]
- 19. Alley W. R., Jr., Madera M., Mechref Y., Novotny M. V. (2010) Chip-based reversed-phase liquid chromatography-mass spectrometry of permethylated N-linked glycans: A potential methodology for cancer-biomarker discovery. Anal. Chem. 82, 5095–5106 [DOI] [PMC free article] [PubMed] [Google Scholar]
- 20. Mann B., Madera M., Sheng Q., Tang H., Mechref Y., Novotny M. V. (2008) ProteinQuant Suite: A bundle of automated software tools for label-free quantitative proteomics. Rapid Commun. Mass Spectrom. 22, 3823–3834 [DOI] [PubMed] [Google Scholar]
- 21. Elias J. E., Gygi S. P. (2007) Target-decoy search strategy for increased confidence in large-scale protein identifications by mass spectrometry. Nat. Methods 4, 207–214 [DOI] [PubMed] [Google Scholar]
- 22. Ozaki N., Ohmuraya M., Hirota M., Ida S., Wang J., Takamori H., Higashiyama S., Baba H., Yamamura K. (2009) Serine protease inhibitor Kazal type 1 promotes proliferation of pancreatic cancer cells through the epidermal growth factor receptor. Mol. Cancer Res. 7, 1572–1581 [DOI] [PubMed] [Google Scholar]
- 23. Domon B., Costello C. E. (1988) Structure elucidation of glycosphingolipids and gangliosides using high-performance tandem mass spectrometry. Biochemistry 27, 1534–1543 [DOI] [PubMed] [Google Scholar]
- 24. Alley W. R., Vasseur J. A., Goetz J. A., Svoboda M., Mann B. F., Matei D. E., Menning N., Hussein A., Mechref Y., Novotny M. V. (2012) N-Linked glycan structures and their expressions change in the blood sera of ovarian cancer patients. J. Proteome Res. 11, 2282–2300 [DOI] [PMC free article] [PubMed] [Google Scholar]
- 25. Bhatia V. N., Perlman D. H., Costello C. E., McComb M. E. (2009) Software tool for researching annotations of proteins: Open-source protein annotation software with data visualization. Anal. Chem. 81, 9819–9823 [DOI] [PMC free article] [PubMed] [Google Scholar]
- 26. Mare L., Trinchera M. (2004) Suppression of β-1,3galactosyltransferase β3Gal-T5 in cancer cells reduces sialyl-Lewis a and enhances poly N-acetyllactosamines and sialyl-Lewis x on O-glycans. Eur. J. Biochem. 271, 186–194 [DOI] [PubMed] [Google Scholar]
- 27. Takahashi S., Oda T., Hasebe T., Sasaki S., Kinoshita T., Konishi M., Ueda T., Nakahashi C., Ochiai T., Ochiai A. (2001) Overexpression of sialyl Lewis x antigen is associated with formation of extratumoral venous invasion and predicts postoperative development of massive hepatic metastasis in cases with pancreatic ductal adenocarcinoma. Pathobiology 69, 127–135 [DOI] [PubMed] [Google Scholar]
- 28. Nakamori S., Nishihara S., Ikehara Y., Nagano H., Dono K., Sakon M., Narimatsu H., Monden M. (1999) Molecular mechanism involved in increased expression of sialyl Lewis antigens in ductal carcinoma of the pancreas. J. Exp. Clin. Cancer Res. 18, 425–432 [PubMed] [Google Scholar]
- 29. Talar-Wojnarowska R., Gasiorowska A., Olakowski M., Lekstan A., Lampe P., Malecka-Panas E. (2010) Clinical value of serum neopterin, tissue polypeptide-specific antigen and CA19-9 levels in differential diagnosis between pancreatic cancer and chronic pancreatitis. Pancreatology 10, 689–694 [DOI] [PubMed] [Google Scholar]
- 30. Tanaka N., Okada S., Ueno H., Okusaka T., Ikeda M. (2000) The usefulness of serial changes in serum CA19-9 levels in the diagnosis of pancreatic cancer. Pancreas 20, 378–381 [DOI] [PubMed] [Google Scholar]
- 31. Cerwenka H., Aigner R., Quehenberger F., Werkgartner G., Bacher H., Hauser H., Mischinger H. J. (1997) Preoperative differential diagnosis of benign and malignant pancreatic lesions: The value of pancreatic secretory trypsin inhibitor, procarboxypeptidase B, CA19-9 and CEA. Hepatogastroenterology 44, 1117–1121 [PubMed] [Google Scholar]
- 32. Smith R. A., Ghaneh P., Sutton R., Raraty M., Campbell F., Neoptolemos J. P. (2008) Prognosis of resected ampullary adenocarcinoma by preoperative serum CA19-9 levels and platelet-lymphocyte ratio. J. Gastrointest. Surg. 12, 1422–1428 [DOI] [PubMed] [Google Scholar]
- 33. Maisey N. R., Norman A. R., Hill A., Massey A., Oates J., Cunningham D. (2005) CA19-9 as a prognostic factor in inoperable pancreatic cancer: The implication for clinical trials. Br. J. Cancer. 93, 740–743 [DOI] [PMC free article] [PubMed] [Google Scholar]
- 34. Ni X. G., Bai X. F., Mao Y. L., Shao Y. F., Wu J. X., Shan Y., Wang C. F., Wang J., Tian Y. T., Liu Q., Xu D. K., Zhao P. (2005) The clinical value of serum CEA, CA19-9, and CA242 in the diagnosis and prognosis of pancreatic cancer. Eur. J. Surg. Oncol. 31, 164–169 [DOI] [PubMed] [Google Scholar]
- 35. Zubarik R., Gordon S. R., Lidofsky S. D., Anderson S. R., Pipas J. M., Badger G., Ganguly E., Vecchio J. (2011) Screening for pancreatic cancer in a high-risk population with serum CA19-9 and targeted EUS: A feasibility study. Gastrointest. Endosc. 74, 87–95 [DOI] [PubMed] [Google Scholar]
- 36. Brand R. E., Nolen B. M., Zeh H. J., Allen P. J., Eloubeidi M. A., Goldberg M., Elton E., Arnoletti J. P., Christein J. D., Vickers S. M., Langmead C. J., Landsittel D. P., Whitcomb D. C., Grizzle W. E., Lokshin A. E. (2011) Serum biomarker panels for the detection of pancreatic cancer. Clin. Cancer Res. 17, 805–816 [DOI] [PMC free article] [PubMed] [Google Scholar]
- 37. van der Waaij L. A., van Dullemen H. M., Porte R. J. (2005) Cyst fluid analysis in the differential diagnosis of pancreatic cystic lesions: A pooled analysis. Gastrointest. Endosc. 62, 383–389 [DOI] [PubMed] [Google Scholar]
- 38. Barrabés S., Pagès-Pons L., Radcliffe C. M., Tabarés G., Fort E., Royle L., Harvey D. J., Moenner M., Dwek R. A., Rudd P. M., De Llorens R., Peracaula R. (2007) Glycosylation of serum ribonuclease 1 indicates a major endothelial origin and reveals an increase in core fucosylation in pancreatic cancer. Glycobiology 17, 388–400 [DOI] [PubMed] [Google Scholar]
- 39. Zenita K., Kirihata Y., Kitahara A., Shigeta K., Higuchi K., Hirashima K., Murachi T., Miyake M., Takeda T., Kannagi R. (1988) Fucosylated type-2 chain polylactosamine antigens in human lung cancer. Int. J. Cancer. 41, 344–349 [DOI] [PubMed] [Google Scholar]
- 40. Kannagi R., Fukushi Y., Tachikawa T., Noda A., Shin S., Shigeta K., Hiraiwa N., Fukuda Y., Inamoto T., Hakomori S., et al. (1986) Quantitative and qualitative characterization of human cancer-associated serum glycoprotein antigens expressing fucosyl or sialyl-fucosyl type 2 chain polylactosamine. Cancer Res. 46, 2619–2626 [PubMed] [Google Scholar]
- 41. Fukushi Y., Hakomori S., Nudelman E., Cochran N. (1984) Novel fucolipids accumulating in human adenocarcinoma. II. Selective isolation of hybridoma antibodies that differentially recognize mono-, di-, and trifucosylated type 2 chain. J. Biol. Chem. 259, 4681–4685 [PubMed] [Google Scholar]
- 42. Kyselova Z., Mechref Y., Kang P., Goetz J. A., Dobrolecki L. E., Sledge G. W., Schnaper L., Hickey R. J., Malkas L. H., Novotny M. V. (2008) Breast cancer diagnosis and prognosis through quantitative measurements of serum glycan profiles. Clin. Chem. 54, 1166–1175 [DOI] [PubMed] [Google Scholar]
- 43. Kyselova Z., Mechref Y., Al Bataineh M. M., Dobrolecki L. E., Hickey R. J., Vinson J., Sweeney C. J., Novotny M. V. (2007) Alterations in the serum glycome due to metastatic prostate cancer. J. Proteome Res. 6, 1822–1832 [DOI] [PMC free article] [PubMed] [Google Scholar]
- 44. Banks P. A., Freeman M. L. (2006) Practice guidelines in acute pancreatitis. Am. J. Gastroenterol. 101, 2379–2400 [DOI] [PubMed] [Google Scholar]
- 45. Wendorf P., Linder D., Sziegoleit A., Geyer R. (1991) Carbohydrate structure of human pancreatic elastase 1. Biochem. J. 278, 505–514 [DOI] [PMC free article] [PubMed] [Google Scholar]
- 46. Szmola R., Sahin-Tóth M. (2007) Chymotrypsin C (caldecrin) promotes degradation of human cationic trypsin: Identity with Rinderknecht's enzyme Y. Proc. Natl. Acad. Sci. U.S.A. 104, 11227–11232 [DOI] [PMC free article] [PubMed] [Google Scholar]
- 47. Freeman T. C., Davies R., Calam J. (1990) Interactions of pancreatic secretory trypsin inhibitor in small intestinal juice: Its hydrolysis and protection by intraluminal factors. Clin. Chim. Acta 195, 27–39 [DOI] [PubMed] [Google Scholar]
- 48. Valmu L., Paju A., Lempinen M., Kemppainen E., Stenman U. H. (2006) Application of proteomic technology in identifying pancreatic secretory trypsin inhibitor variants in urine of patients with pancreatitis. Clin. Chem. 52, 73–81 [DOI] [PubMed] [Google Scholar]
- 49. Stenman U. H. (2002) Tumor-associated trypsin inhibitor. Clin. Chem. 48, 1206–1209 [PubMed] [Google Scholar]