Abstract
5-Aza-2′-deoxycytidine (5-Aza-CdR), a nucleoside analog that can inhibit DNA cytosine methylation, possesses potent antitumorigenic activities for myeloid disorders. Although 5-Aza-CdR is known to be incorporated into DNA and inhibit DNA (cytosine-5)-methyltransferases, the precise mechanisms underlying the drug's antineoplastic activity remain unclear. Here we utilized a mass spectrometry-based quantitative proteomic method to analyze the 5-Aza-CdR-induced perturbation of protein expression in Jurkat-T cells at the global proteome scale. Among the ∼2780 quantified proteins, 188 exhibited significant alteration in expression levels upon a 24-hr treatment with 5 μm 5-Aza-CdR. In particular, we found that drug treatment led to substantially reduced expression of farnesyl diphosphate synthase (FDPS) and farnesyl diphosphate farnesyltransferase (FDFT1), two important enzymes involved in de novo cholesterol synthesis. Consistent with this finding, 5-Aza-CdR treatment of leukemia (Jurkat-T, K562 and HL60) and melanoma (WM-266–4) cells led to a marked decrease in cellular cholesterol content and pronounced growth inhibition, which could be rescued by externally added cholesterol. Exposure of these cells to 5-Aza-CdR also led to epigenetic reactivation of dipeptidyl peptidase 4 (DPP4) gene. Additionally, suppression of DPP4 expression with siRNA induced elevated protein levels of FDPS and FDFT1, and increased cholesterol biosynthesis in WM-266–4 cells. Together, the results from the present study revealed, for the first time, that 5-Aza-CdR exerts its cytotoxic effects in leukemia and melanoma cells through epigenetic reactivation of DPP4 gene and the resultant inhibition of cholesterol biosynthesis in these cells.
Epigenetic events, defined as mitotically and meiotically heritable changes in gene expression that are not due to alteration in primary DNA sequence (1), play important roles in carcinogenesis and tumor progression (2). DNA cytosine methylation, post-translational modifications of core histones, and microRNA pathway constitute three major mechanisms of epigenetic regulation. Global DNA hypomethylation and promoter DNA hypermethylation are known to occur in human tumors, where promoter cytosine methylation inhibits gene expression and results in long-term gene silencing (2).
Cytosine methylation pattern is maintained during cell division by DNA (cytosine-5)-methyltransferase 1, and DNA methylation inhibitors were the first epigenetic drugs used for cancer treatment (3). 5-Azacytidine and 5-aza-2′-deoxycytidine (5-Aza-CdR)1 are among the many cytosine nucleoside analogs that can inhibit DNA methylation and induce cellular differentiation (4). These nucleoside analogs are incorporated into DNA of tumor cells during DNA replication and 5-azacytosine in DNA can bind to the cysteine residue at the active site of DNMTs (5). This covalent and irreversible binding of the enzyme to drug-substituted DNA is believed to be the principal mechanism of cytotoxicity (5), though it was also found that 5-Aza-CdR treatment could lead to the proteasomal degradation of DNA (cytosine-5)-methyltransferase 1 independent of its catalytic cysteine residue (6). 5-Aza-CR and 5-Aza-CdR have been approved by FDA for the treatment of myelodysplastic syndromes and are widely studied for the treatment of hematological diseases (7), including acute and chronic myeloid leukemia (AML and CML) (8). However, the detailed mechanisms underlying the cytotoxic effects of these drugs, particularly which target gene(s) becomes epigenetically reactivated and results in the growth inhibition of leukemic cells, remain poorly defined.
To exploit the molecular mechanisms contributing to the anticancer activity of 5-Aza-CdR in leukemia cells, we employed liquid chromatography-tandem MS (LC-MS/MS) together with stable isotope labeling by amino acid in cell culture (SILAC) to assess, at the global proteome scale, the perturbation in protein expression of Jurkat-T human leukemia cells upon 5-Aza-CdR treatment. In this context, SILAC is a simple and efficient metabolic isotope-labeling method; when combined with LC-MS/MS analysis, the method can afford accurate quantification of subtle changes of protein abundance in the whole proteome (9). With this method, we quantified more than 2780 unique proteins, 188 of which were significantly altered upon 5-Aza-CdR treatment. Importantly, the quantitative proteomic experiment revealed the 5-Aza-CdR-induced down-regulation of two essential enzymes in cholesterol biosynthesis, namely, farnesyl diphosphate synthase (FDPS) and farnesyl diphosphate farnesyltransferase (FDFT1, a.k.a. squalene synthase). This finding, along with follow-up studies allowed us to discover, for the first time, that 5-Aza-CdR exerts its cytotoxic effect via modulating cholesterol biosynthesis in leukemia and melanoma cells, which involves epigenetic reactivation of DPP4 gene.
MATERIALS AND METHODS
Cell Culture
All reagents unless otherwise stated were from Sigma, and all cell lines were obtained from ATCC (Manassas, VA). Jurkat-T, HL60 and K562 cells were cultured in Iscove's modified minimal essential medium (IMEM) supplemented with 10% fetal bovine serum (FBS, Invitrogen, Carlsbad, CA), 100 IU/ml penicillin and 100 μg/ml streptomycin in 75 cm2 culture flasks. The WM-266–4 cells were cultured under the same conditions except that Eagle's minimum essential medium (EMEM) was used. Cells were maintained in a humidified atmosphere with 5% CO2 at 37 °C, with medium renewal of 2–3 times a week depending on cell density. For SILAC experiments, the IMEM medium without l-lysine or l-arginine was custom-prepared following ATCC formulation. The complete light and heavy IMEM media were prepared by adding light or heavy lysine ([13C6, 15N2]-l-lysine) and arginine ([13C6]-l-arginine), along with dialyzed FBS (Invitrogen), to the lysine, arginine-depleted medium. The Jurkat-T cells were cultured in heavy IMEM medium for at least 10 days to achieve complete stable isotope incorporation.
5-Aza-CdR Treatment and Sample Preparation
Jurkat-T cells, at a density of ∼7 × 10⁵ cells per ml in light or heavy IMEM medium, were treated with 5 μm 5-Aza-CdR for 24 h. After treatment, the light and heavy cells were harvested by centrifugation at 300 × g at 4 °C for 5 min, and washed for three times with ice-cold PBS to remove culture medium and FBS. Cells were lysed with CelLyticTM M lysis buffer supplemented with 1 mm phenylmethylsulfonyl fluoride and a protease inhibitor mixture. The resulting cell lysate was centrifuged at 16,000 × g at 4 °C for 30 min and supernatant collected. The protein concentration in the cell lysate was measured using Quick StartTM Bradford Protein Assay (Bio-Rad, Hercules, CA). In forward SILAC, the lysate of light labeled, drug-treated cells and that of the heavy labeled control cells were combined at 1:1 ratio (w/w), whereas the heavy labeled, drug-treated cell lysate was mixed equally with the light labeled, control lysate in the reverse SILAC experiment (Fig. 1A).
Fig. 1.
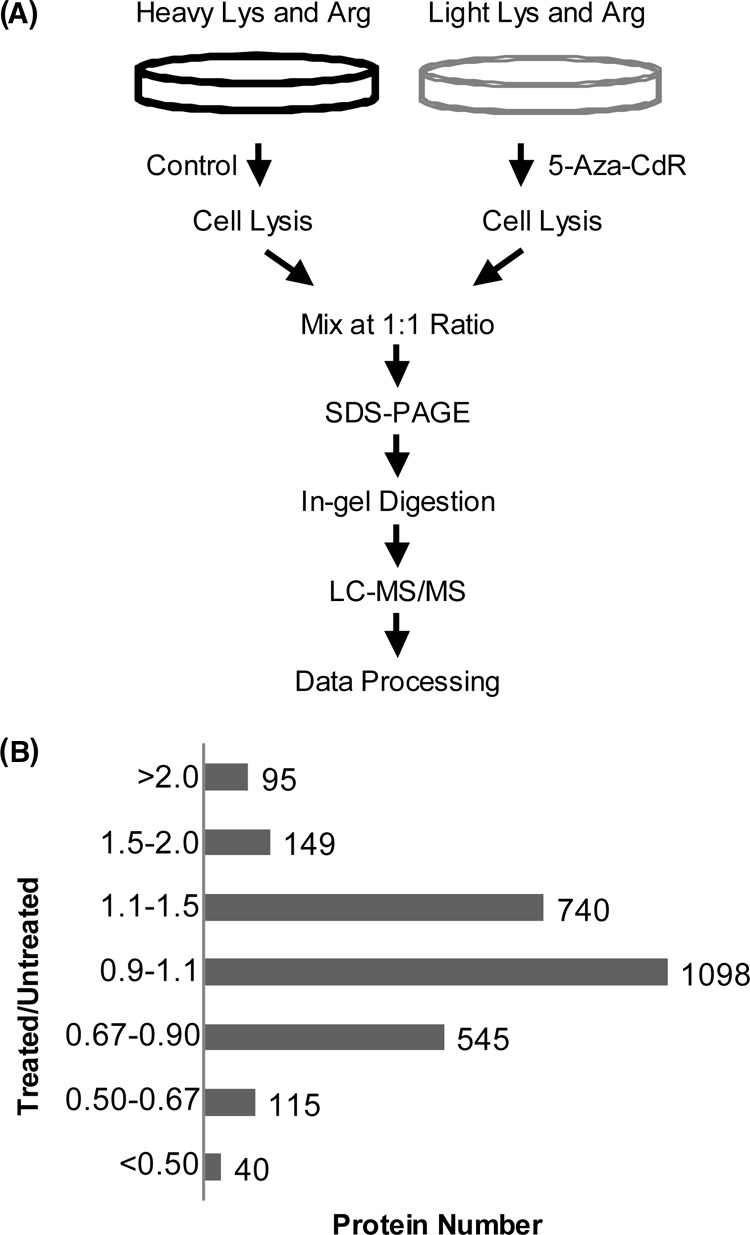
SILAC-based quantitative proteomic method for revealing the 5-Aza-CdR-induced perturbation of protein expression in the global proteome. A, Flowcharts of forward SILAC combined with LC-MS/MS for the comparative analysis of protein expression in Jurkat-T cells upon 5-Aza-CdR treatment. B, The distribution of expression ratios (treated/untreated) for the quantified proteins, including those quantified in only one set of SILAC labeling experiment.
SDS-PAGE Separation and In-Gel Digestion
The above equi-mass mixture of light and heavy lysates was separated on a 12% SDS-PAGE with a 4% stacking gel and stained with Coomassie blue. The gel was cut into 20 slices, and the proteins in individual gel slices were separately reduced in-gel with dithiothreitol and alkylated with iodoacetamide. The proteins were subsequently digested at 37 °C with trypsin (Promega, Madison, WI) for overnight. Following digestion, peptides were extracted from gels with 5% acetic acid in H2O and then with 5% acetic acid in CH3CN/H2O (1:1, v/v). The resulting peptide mixtures were dried and stored at −80 °C until further analysis.
LC-MS/MS for Protein Identification and Quantification
On-line LC-MS/MS analysis was performed on an LTQ-Orbitrap Velos mass spectrometer coupled with an EASY n-LCII HPLC system and a nanoelectrospray ionization source (Thermo, San Jose, CA). The sample injection, enrichment, desalting, and HPLC separation were conducted automatically on a homemade trapping column (150 μm×50 mm) and a separation column (75 μm×120 mm, packed with ReproSil-Pur C18-AQ resin, 5 μm in particle size and 300 Å in pore size; Dr. Maisch HPLC GmbH, Germany). The peptide mixture was first loaded onto the trapping column with a solvent mixture of 0.1% formic acid in CH3CN/H2O (2:98, v/v) at a flow rate of 3.0 μl/min. The peptides were then separated using a 120-min linear gradient of 2–40% acetonitrile in 0.1% formic acid at a flow rate of 300 nL/min.
The LTQ-Orbitrap Velos mass spectrometer was operated in the positive-ion mode, and the spray voltage was 1.8 kV. All MS/MS spectra were acquired in a data-dependent scan mode, where one full-MS scan was followed with twenty MS/MS scans. The full-scan MS spectra (from m/z 350 to 2000) were acquired with a resolution of 60,000 at m/z 400 after accumulation to a target value of 500,000. The twenty most abundant ions found in MS at a threshold above 500 counts were selected for fragmentation by collision-induced dissociation at a normalized collision energy of 35%.
Data Processing
The LC-MS/MS data were employed for the identification and quantification of global proteome, which were conducted using Maxquant, version 1.2.0.18 (10) against International Protein Index (IPI) database (11), version 3.68 with 87,061 entries to which contaminants and reverse sequences were added. The maximum number of miss-cleavages for trypsin was two per peptide. Cysteine carbamidomethylation and methionine oxidation were set as fixed and variable modifications, respectively. The tolerances in mass accuracy for MS and MS/MS were 25 ppm and 0.6 Da, respectively. Only those proteins with at least two distinct peptides being discovered from LC-MS/MS analyses were considered reliably identified. The protein expression ratio reported in the present study represented the normalized ratios determined by Maxquant, where the expression levels of the majority of proteins were assumed to be unchanged upon 5-Aza-CdR treatment and the median of log-transformed ratios of all quantified proteins was considered to be zero (10). The required false positive rate was set to 1% at the both peptide and protein levels, with the minimal required peptide length being set at 6 amino acids. The quantification was based on three independent SILAC and LC-MS/MS experiments, which included two forward and one reverse SILAC labeling. Only those proteins with alteration in expression levels being greater than 1.5- or less than 0.67-fold, and with quantification results from at least two sets (including both forward and reverse) of SILAC labeling experiments were considered significantly changed.
Exogenous cholesterol addition and cell viability assay
The cholesterol-BSA complex was prepared following a previously published method (13). Briefly, a 10-ml aliquot of 1% cholesterol in ethanol was mixed with an equal volume of doubly distilled water under continuous stirring at room temperature. The milk-like solution was then centrifuged at 2000 × g for 10 min. The supernatant was discarded, and the pellet was resuspended in a 10-ml solution containing 0.25 m sucrose and 1 mm EDTA (pH 7.3), followed by a gentle addition of 4 g BSA with continuous stirring at room temperature. Once the BSA was completely dissolved, the pH of the solution was adjusted to 7.3 with Tris, and the resulting solution was centrifuged at 12,000 × g for 10 min at 4 °C. The supernatant was collected and used for cholesterol addition experiments.
Jurkat-T, HL60, K562, and WM-266–4 cells were seeded in 6-well plates at a density of ∼4 × 10⁵ cells/ml and treated with 5-Aza-CdR at a final concentration of 5 μm. The cholesterol-BSA complex solution was added to the wells containing the control or 5-Aza-CdR-treated cells until the final cholesterol concentration reached 30 or 60 mg/L. After 12 or 24 h of treatment, cells were stained with trypan blue, and counted on a hemocytometer to measure cell viability.
Extraction and Determination of the Cellular Cholesterol Level
Cells were washed for three times with PBS and extracted with chloroform:methanol:water (2:1.1:0.9, v/v/v), following previously published procedures (14). The chloroform layer was washed three times with a methanol-water mixture (5:4, v/v), collected, and evaporated to dryness using a SpeedVac. The cholesterol level was measured by HPLC using methanol as mobile phase, and the effluent from the column was monitored with a UV detector at a wavelength of 210 nm. The cellular level of cholesterol was determined using a calibration curve constructed from HPLC analyses of different amounts of cholesterol, as described recently (15).
Quantitative Real-time PCR
RNA was extracted using the RNeasy Mini Kit (Qiagen). Approximately 1 μg RNA was reverse transcribed by employing M-MLV reverse transcriptase (Promega) with a poly(dT) primer. After incubating at 42 °C for 60 min, the reverse transcriptase was deactivated by heating at 85 °C for 5 min. Quantitative real-time PCR was performed using iQ SYBR Green Supermix kit (Bio-Rad) on a Bio-Rad iCycler system (Bio-Rad), and the running conditions were at 95 °C for 3 min and 50 cycles at 95 °C for 15 s, 55 °C for 30 s, and 72 °C for 45 s. The comparative cycle threshold (Ct) method (ΔΔCt) was used for the relative quantification of gene expression, and GAPDH gene was used as the internal control (16). The mRNA level of each gene was normalized to that of the internal control.
siRNA Treatment
Dharmacon (Lafayette, CO) ON-TARGETplus SMARTpool siRNAs were employed to knockdown the expression of human DPP4 genes in WM-266–4 cells, where Dharmacon siGENOME Non-Targeting siRNA was used as control. Briefly, WM-266–4 cells were seeded in 6-well plates at 50–70% confluence level and transfected with ∼1.5 μg DPP4 siRNA or control siRNA using Lipofectamine 2000 (Invitrogen). After a 48-hr incubation, the cells were harvested by using trypsin-EDTA solution followed by centrifugation at 2000 rpm at 4 °C for 5 min and subsequently washed twice with PBS.
Western Blot
Lysate of control and 5-Aza-CdR-treated Jurkat-T and K562 cells, along with that of DPP4 siRNA-treated WM-266–4 cells, were prepared following the above-described procedures. After SDS-PAGE separation, proteins were transferred to a nitrocellulose membrane using a solution containing 10 mm NaHCO3, 3 mm Na2CO3, and 20% methanol. The membranes were blocked with 5% nonfat milk in PBS buffer containing 0.1% (v/v) Tween-20 (pH 7.5) for 7 h and incubated overnight at 4 °C with rabbit anti-FDPS antibody (1:400 dilution, Abgent, San Diego, CA) and rabbit anti-FDFT1 antibody (1:400 dilution) (Abgent). The membranes were washed with fresh PBS-T at room temperature for five times (10 min each). After washing, the membranes were incubated with HRP-conjugated secondary antibody (1:1000 dilution) at room temperature for 1 h. The membranes were subsequently washed with PBS-T for five times. The secondary antibody was detected by using ECL Advance Western blotting Detection Kit (GE Healthcare) and visualized with Hyblot CL autoradiography film (Denville Scientific, Inc., Metuchen, NJ). Intensities for immunoreactive bands were quantified using ImageJ (National Institutes of Health).
RESULTS AND DISCUSSION
5-Aza-CdR Treatment and Protein Quantification
It is widely accepted that treatment of cells with 5-Aza-CdR could lead to the incorporation of the modified nucleoside into cellular DNA, which traps covalently the DNMTs thereby inducing DNA hypomethylation (5). However, the target gene(s), whose reactivation gives rise to the cytotoxic effect of the drug, remains to be identified. To explore the molecular targets of 5-Aza-CdR, we employed an unbiased quantitative proteomic approach to identify, at the entire proteome scale, the drug-induced perturbation of protein expression in Jurkat-T cells. To this end, we first established the optimal dose of 5-Aza-CdR by examining the survival rate of Jurkat-T cells upon treatment with different concentrations of 5-Aza-CdR. Based on trypan blue exclusion assay, a less than 5% cell death was observed after a 24-hr treatment with 5 μm 5-Aza-CdR; however, cell viability was significantly reduced (by ∼20%) after a similar treatment with 10 μm 5-Aza-CdR. Thus, we chose 5 μm 5-Aza-CdR for the subsequent experiments to minimize the apoptosis-induced changes in protein expression. To obtain reliable quantification results, we conducted SILAC experiments in triplicate, including two forward and one reverse labeling (Fig. 1A depicts the procedures for forward SILAC labeling).
LC-MS/MS allowed for the identification of a total of 3100 proteins in both forward and reverse SILAC experiments, and ∼ 2780 of them were quantified (Fig. 1B). Details of all quantified proteins are listed in supplemental Table S1. The distribution of changes in protein expression levels arising from 5-Aza-CdR treatment is displayed in Fig. 1B. By using a ratio of >1.5 or <0.67 as threshold for the significantly changed proteins, 188 exhibited significant changes with at least two peptides being identified in at least two sets of SILAC labeling experiments (supplemental Table S2). Fig. 2 depicts the representative ESI-MS results for two tryptic peptides derived from farnesyl diphosphate synthase (FDPS), which reveals the 5-Aza-CdR-induced down-regulation of this protein.
Fig. 2.
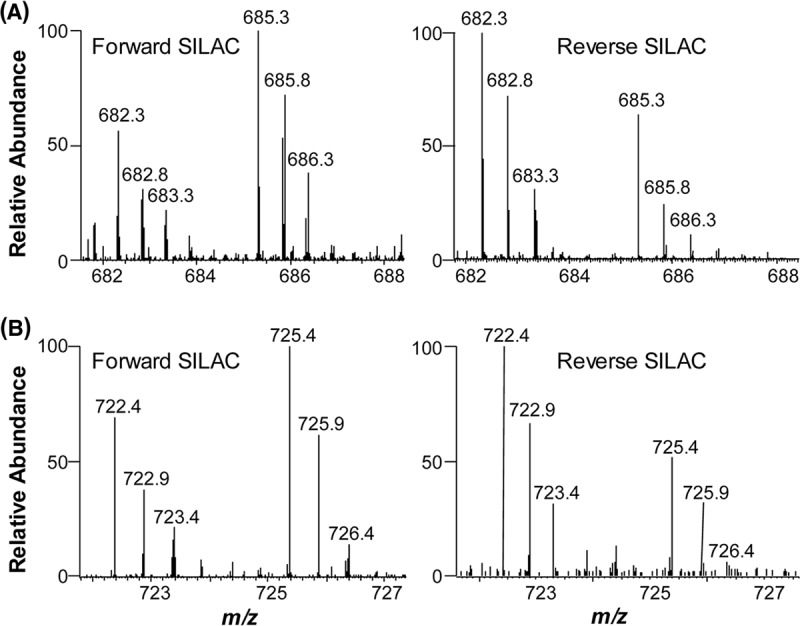
Representative ESI-MS results revealing the 5-Aza-CdR-induced down-regulation of FDPS. Shown are the MS for the [M+2H]2+ ions of FDPS peptides EFWPQEVWSR and EFWPQEVWSR* (A), as well as TQNLPNCQLISR and TQNLPNCQLISR* (B) (“R*” designates the heavy arginine) from forward (left) and reverse (right) SILAC labeling experiments.
5-Aza-CdR Treatment Led to Down-regulation of FDPS and Farnesyl Diphosphate Farnesyltransferase (FDFT1, a.k.a. Squalene Synthase)
We next performed protein interaction network and pathway analysis using the Ingenuity Pathway Analysis (IPA) software (17). Proteins exhibiting greater than a 1.5-fold change in expression upon the drug treatment were considered for the analysis. Networks represent a highly interconnected set of proteins derived from the input dataset. Biological functions and processes were assigned to networks by mapping the proteins in the network to functions in the Ingenuity ontology. Several pathways were found to be altered included steroid (cholesterol) biosynthesis, granzyme signaling, mitochondria dysfunction, etc. (supplemental Table S3).
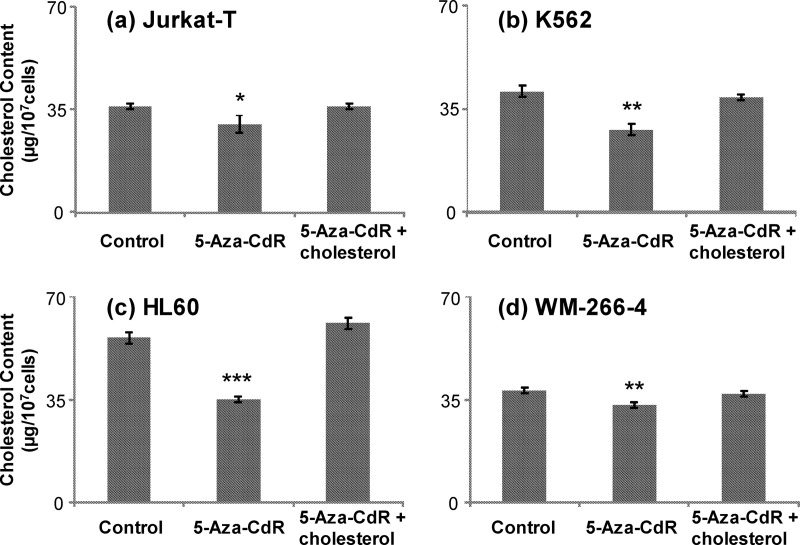
For the steroid biosynthesis pathway, results from our quantitative proteomic experiments showed that FDPS and FDFT1 were significantly reduced upon 5-Aza-CdR treatment. The expression ratios (treated/untreated) for FDPS and FDFT1 were determined to be 0.61 ± 0.03 and 0.48 ± 0.10, respectively, based on results from three independent SILAC labeling, drug treatment, and LC-MS/MS measurements. FDPS and FDFT1 catalyze the biosynthesis of FDP and the conversion of FDP to squalene, respectively (18). Viewing that both enzymes are essential for de novo cholesterol synthesis in human cells (14), we reasoned that 5-Aza-CdR treatment may give rise to diminished intracellular cholesterol levels. To test this, we extracted cholesterol from Jurkat-T cells and measured its level by HPLC analysis. It turned out that a 24-hr treatment with 5 μm 5-Aza-CdR led to a statistically significant decline of the cellular cholesterol content from 36 μg to 30 μg of cholesterol per 107 cells (Fig. 3A). To examine if this observation is general, we measured cholesterol levels in two other leukemia cell lines (i.e. HL60 and K562) with and without 5-Aza-CdR treatment, and our results showed that the drug-induced decrease in cellular cholesterol content was even more pronounced in these two cell lines (Fig. 3B and 3C). Therefore, the results confirmed the 5-Aza-CdR-induced down-regulation of FDPS and FDFT1, as observed from quantitative proteomic experiment. Along this line, the 5-Aza-CdR-induced down-regulation of FDPS and FDFT1 in Jurkat-T and K562 cells was further confirmed by Western blot analysis (supplemental Fig. S1). Apart from the decreased expression of FDPS and FDFT1, our quantitative proteomic results revealed the elevated expression of zyxin, Wiskott-Aldrich syndrome protein family member 2 (WASP2), as well as LIM and Src homology 3 domain protein 1 (LASP-1, Tables S1 and S2). These proteins co-localize with actin polymerization, which occurs in cholesterol-rich membrane microdomains (a.k.a. lipid rafts) (19–21). The overexpression of these proteins may reflect an enhanced membrane-cytoskeleton interaction in response to 5-Aza-CdR-induced cholesterol depletion (22, 23).
Fig. 3.
5-Aza-CdR perturbed de novo cholesterol synthesis in leukemia cells. Shown are the histograms of cholesterol levels in Jurkat-T (A), K562 (B), HL60 (C), and WM-266–4 (D) cells that are untreated, treated with 5 μm 5-Aza-CdR treatment for 24 h alone or together with cholesterol. The values represent mean ± S.D. of results obtained from three independent experiments. “*”, p < 0.05; “**”, p < 0.01; “***”, p < 0.001. The p values were calculated by using unpaired two-tailed t test.
Diminished endogenous cholesterol biosynthesis in leukemic cells may contribute significantly to the cytotoxic effects of 5-Aza-CdR. In this vein, leukemia cells display enhanced rates of de novo cholesterol synthesis and lack of feedback inhibition of cholesterogenesis (24). Inhibition of endogenous cholesterol biosynthesis in leukemia cells suppresses their growth (25, 26). If this constitutes the major mechanism leading to the growth inhibition of leukemic cells, we expect that the 5-Aza-CdR-induced growth inhibition should be rescued by externally added cholesterol. It turned out that all three leukemia cell lines exhibited substantial growth inhibition upon 5-Aza-CdR treatment, which can indeed be abrogated by addition of cholesterol to the culture medium (Fig. 4A and 4B displayed representative data for Jurkat-T and K562 cells). In this regard, the cholesterol content in 5-Aza-CdR-treated cells returned to control levels at 24 h after the addition of exogenous cholesterol (Fig. 3). These results demonstrated that the 5-Aza-CdR-induced growth inhibition of the three leukemia cell lines could be mainly attributed to the decreased levels of FDPS and FDFT1 and the resultant decline in endogenous cholesterol biosynthesis.
Fig. 4.
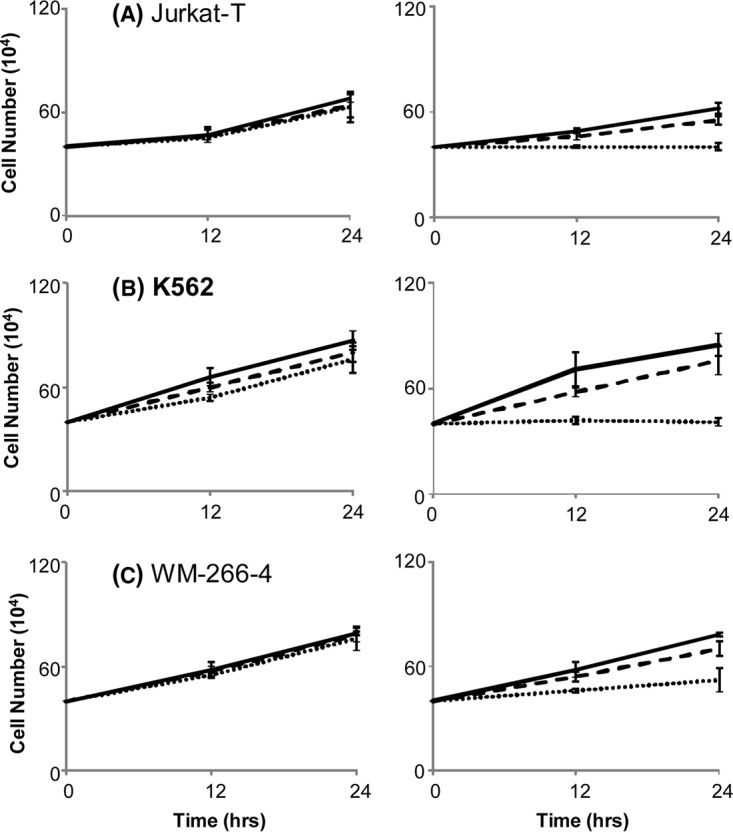
5-Aza-CdR-induced growth inhibition of leukemia cells can be rescued by externally added cholesterol. The viability of Jurkat-T (A), K562 (B), and WM-266–4 (C) cells after 12 and 24 h of treatment with 0 (dotted line), 30 (dashed line) or 60 mg/L (solid line) cholesterol alone (left), or together with 5 μm 5-Aza-CdR (right).
5-Aza-CdR-Induced Inhibition of Cholesterol Biosynthesis Involves Epigenetic Reactivation of DPP4 Gene
Viewing that 5-Aza-CdR treatment can lead to cytosine demethylation and reactivation of epigenetically silenced genes, we surveyed literature for mammalian genes that are both epigenetically silenced in leukemia cells and involved in cholesterol biosynthesis. We found that dipeptidyl peptidase 4 (DPP4, a.k.a. CD26 in T cells or adenosine deaminase complexing protein) is the only known human gene satisfying both criteria. In this regard, DPP4 was found to be epigenetically silenced in primary leukocytes isolated from adult T-lineage leukemic patients and in cultured human leukemia cells (27). In addition, promoter cytosine methylation of DPP4 gene was observed to correlate positively with plasma HDL-cholesterol level in severely obese patients with metabolic syndrome (28). Although our proteomic experiment did not allow us to identify or quantify the DPP4 protein (likely because of its low level of expression in Jurkat-T cells), real-time PCR experiment showed that 5-Aza-CdR treatment led to the reactivation of DPP4 gene in all three leukemia cell lines tested (supplemental Fig. S2).
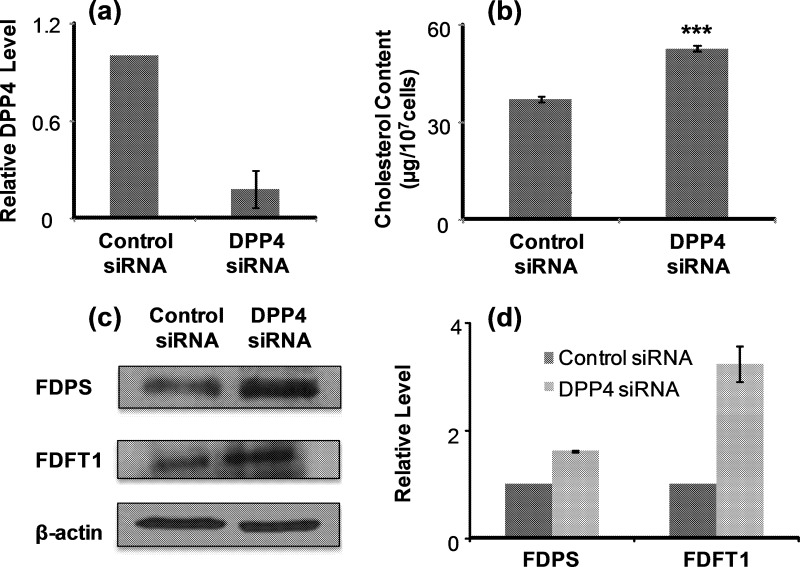
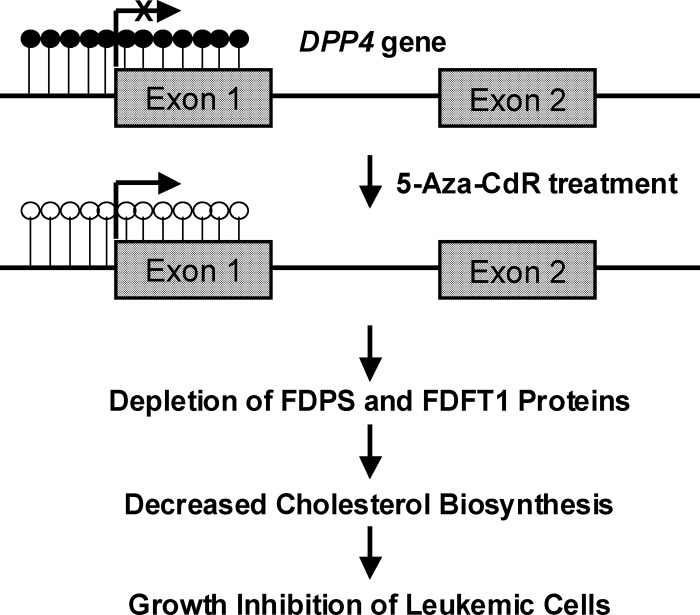
Apart from leukemia cells, DPP4 is known to be epigenetically silenced in human melanoma cells (29). We found that 5-Aza-CdR treatment also resulted in elevated expression of DPP4 (supplemental Fig. S2) and diminished endogenous cholesterol biosynthesis (Fig. 3D) in WM-266–4 human melanoma cells. Furthermore, the 5-Aza-CdR-induced growth inhibition of WM-266–4 cells can again be rescued by supplementing the culture medium with cholesterol (Fig. 4C). To examine whether epigenetic reactivation of DPP4 gene plays a causative role in the decreased levels of FDPS and FDFT1 proteins, we employed siRNA to knockdown the expression of DPP4 gene and assessed the expression levels of the two cholesterol biosynthesis enzymes as well as cellular cholesterol content. Owing to the difficulty in transfection of leukemia cells, we employed WM-266–4 cells for the experiment. Our results showed that the treatment of WM-266–4 cells with DPP4 siRNA led to a decrease in DPP4 mRNA expression by ∼75%, as revealed by real-time PCR analysis (Fig. 5A). More importantly, treatment of WM-266–4 cells with DPP4 siRNA, but not control nontargeting siRNA, could result in increased expression of FDPS and FDFT1 (Western blot results shown in Fig. 5C and 5D) and elevated cellular cholesterol content (Fig. 5B). This result demonstrated that DPP4 could regulate negatively the levels of FDPS and FDFT1 proteins. Together, the above results support that 5-Aza-CdR treatment induces epigenetic reactivation of DPP4 gene, which leads to diminished expression of FDPS and FDFT1 proteins, thereby decreasing cholesterol biosynthesis and inhibiting the growth of leukemic cells (Fig. 6).
Fig. 5.
DPP4 gene regulates negatively endogenous cholesterol biosynthesis in WM-266–4 cells. Displayed are histograms of DPP4 expression level (A) and cholesterol content (B) in WM-266–4 cells after siRNA knockdown of DPP4 gene. Shown in (C), and (D) are the Western blot image and quantification results for FDPS and FDFT1 protein levels in WM-266–4 cells after DPP4 siRNA knockdown.
Fig. 6.
A mechanistic model underlying the anti-leukemic effect of 5-Aza-CdR.
CONCLUSIONS
Multiple epigenetic alterations have been observed in hematopoietic malignancies (30), and 5-Aza-CdR is an epigenetic drug used for the treatment of myelodysplastic syndromes and myelogenous leukemia (7, 8). Although the covalent binding of DNA 5-azacytosine with catalytic cysteine residue in DNMT proteins and the resulting diminished promoter cytosine methylation are considered the principal mechanism of toxicity (5), the target gene(s) underlying the therapeutic effect of this DNA hypomethylating agent remains ambiguous. We attempted to address this question by assessing the drug-induced alterations in protein expression at the whole proteome scale. Our results based on metabolic labeling using SILAC, together with LC-MS/MS analysis, revealed that the drug treatment led to significant changes in expression of 188 proteins. Among them, FDPS and FDFT1, two important enzymes involved in cholesterol biosynthesis, were decreased significantly upon 5-Aza-CdR treatment. In addition, we observed that 5-Aza-CdR-induced growth inhibition of Jurkat-T, HL60 and K562 cells could be abrogated by externally added cholesterol, supporting the conclusion that inhibition in endogenous cholesterol biosynthesis constitutes the major pathway leading to the growth inhibition of leukemia cells. The above observations, in conjunction with previous findings showing that DPP4 gene is epigenetically silenced in leukemia cells (29) and promoter methylation of this gene is correlated positively with HDL-cholesterol level in severely obese patients with metabolic syndrome (28), led us to discover that 5-Aza-CdR-mediated epigenetic reactivation of DPP4 gene accounts for the diminished expression of FDPS and FDFT1 at the protein level. Taken together, our quantitative proteomic experiment, together with follow-up studies, demonstrated that 5-Aza-CdR led to epigenetic reactivation of DPP4 gene. Elevated expression of DPP4 gene gave rise to decreased levels of two important enzymes involved in cholesterol biosynthesis, and the resultant diminished cholesterol biosynthesis induced growth inhibition of leukemic cells (Fig. 6). Future experiments will be needed for understanding how reactivation of DPP4 gene leads to diminished levels of FDPS and FDFT1 proteins. In this vein, it is unlikely for these two enzymes to be direct substrates for DPP4 considering that the N termini of neither proteins carry a DPP4 recognition site and DPP4 was found to be incapable of cleaving large protein molecules (31).
It is worth emphasizing the advantage of the quantitative proteomic method for discovering molecular mechanisms of action of anti-cancer drugs. The most notable outcome of the unbiased quantitative proteomic approach is perhaps the generation of novel hypotheses. Prior to this work, few would have thought that epigenetic reactivation of DPP4 gene and the resulting inhibition in cholesterol biosynthesis would constitute an important molecular mechanism contributing to the anti-leukemic effect of 5-Aza-CdR. Now, this becomes evident on the basis of the validation experiments. The ability to discover molecular target of 5-Aza-CdR that lies outside of previous biological knowledge is a major motivation for the use of unbiased proteome-wide approaches for unraveling novel mechanisms of action of antineoplastic agents and is well supported by the results generated from the present study. It is also worth noting that 5-Aza-CdR treatment did not give rise to significant decreases in expression of FDPS and FDFT1 at the mRNA level; likewise, treatment with DPP4 siRNA did not lead to elevated mRNA expression of these two genes in WM-266–4 cells (Fig. S3), revealing the lack of transcriptional regulation of these two genes by DPP4. Therefore, this result also underscored that the new pathway uncovered from quantitative proteomic strategy would not be discovered with the conventional microarray-based approach.
In conclusion, the current study uncovered a novel mechanism of 5-Aza-CdR-induced anticancer effect. In the future, it will be important to assess whether the findings made with cultured leukemia cells can be extended to leukemic patients administered with the drug. If the mechanism can be extended to in vivo, it will have a profound impact on the clinical use of 5-Aza-CdR in treating myeloid disorders. For instance, assessment of DPP4 gene expression in patient leukocytes may provide an important basis for choosing the optimal therapeutic dose for the treatment, and leukocyte cholesterol level may serve as a biomarker for monitoring the clinical efficacy of the drug.
Footnotes
* This work was supported by the National Institutes of Health (R01 CA 101864).
 This article contains supplemental Figs. S1 to S3 and Tables S1 to S3.
1 The abbreviations used are:
- 5-Aza-CdR
- 5-aza-2′-deoxycytidine.
REFERENCES
- 1. Holliday R. (1987) The inheritance of epigenetic defects. Science 238, 163–170 [DOI] [PubMed] [Google Scholar]
- 2. Jones P. A., Baylin S. B. (2002) The fundamental role of epigenetic events in cancer. Nat. Rev. Genet. 3, 415–428 [DOI] [PubMed] [Google Scholar]
- 3. Yoo C. B., Jones P. A. (2006) Epigenetic therapy of cancer: past, present and future. Nat. Rev. Drug Discov. 5, 37–50 [DOI] [PubMed] [Google Scholar]
- 4. Jones P. A., Taylor S. M. (1980) Cellular-differentiation, cytidine analogs and DNA methylation. Cell 20, 85–93 [DOI] [PubMed] [Google Scholar]
- 5. Christman J. K. (2002) 5-Azacytidine and 5-aza-2′-deoxycytidine as inhibitors of DNA methylation: mechanistic studies and their implications for cancer therapy. Oncogene 21, 5483–5495 [DOI] [PubMed] [Google Scholar]
- 6. Ghoshal K., Datta J., Majumder S., Bai S., Kutay H., Motiwala T., Jacob S. T. (2005) 5-Aza-deoxycytidine induces selective degradation of DNA methyltransferase 1 by a proteasomal pathway that requires the KEN box, bromo-adjacent homology domain, and nuclear localization signal. Mol. Cell. Biol. 25, 4727–4741 [DOI] [PMC free article] [PubMed] [Google Scholar] [Retracted]
- 7. Kaminskas E., Farrell A., Abraham S., Baird A., Hsieh L. S., Lee S. L., Leighton J. K., Patel H., Rahman A., Sridhara R., Wang Y. C., Pazdur R. (2005) Approval summary: azacitidine for treatment of myelodysplastic syndrome subtypes. Clin. Cancer Res. 11, 3604–3608 [DOI] [PubMed] [Google Scholar]
- 8. Plimack E. R., Kantarjian H. M., Issa J. P. (2007) Decitabine and its role in the treatment of hematopoietic malignancies. Leuk. Lymphoma 48, 1472–1481 [DOI] [PubMed] [Google Scholar]
- 9. Ong S. E., Blagoev B., Kratchmarova I., Kristensen D. B., Steen H., Pandey A., Mann M. (2002) Stable isotope labeling by amino acids in cell culture, SILAC, as a simple and accurate approach to expression proteomics. Mol. Cell. Proteomics 1, 376–386 [DOI] [PubMed] [Google Scholar]
- 10. Cox J., Mann M. (2008) MaxQuant enables high peptide identification rates, individualized p.p.b.-range mass accuracies and proteome-wide protein quantification. Nat. Biotechnol. 26, 1367–1372 [DOI] [PubMed] [Google Scholar]
- 11. Kersey P. J., Duarte J., Williams A., Karavidopoulou Y., Birney E., Apweiler R. (2004) The International Protein Index: an integrated database for proteomics experiments. Proteomics 4, 1985–1988 [DOI] [PubMed] [Google Scholar]
- 12.Deleted in proof
- 13. Martínez F., Eschegoyen S., Briones R., Cuellar A. (1988) Cholesterol Increase in mitochondria - a new method of cholesterol incorporation. J. Lipid Res. 29, 1005–1011 [PubMed] [Google Scholar]
- 14. Madden E. A., Bishop E. J., Fiskin A. M., Melnykovych G. (1986) Possible role of cholesterol in the susceptibility of a human acute lymphoblastic leukemia cell line to dexamethasone. Cancer Res. 46, 617–622 [PubMed] [Google Scholar]
- 15. Dong X., Xiong L., Jiang X., Wang Y. (2010) Quantitative proteomic analysis reveals the perturbation of multiple cellular pathways in Jurkat-T cells induced by doxorubicin. J. Proteome Res. 9, 5943–5951 [DOI] [PMC free article] [PubMed] [Google Scholar]
- 16. Livak K. J., Schmittgen T. D. (2001) Analysis of relative gene expression data using real-time quantitative PCR and the 2−DDCt method. Methods 25, 402–408 [DOI] [PubMed] [Google Scholar]
- 17. Nilsson C. L., Dillon R., Devakumar A., Shi S. D., Greig M., Rogers J. C., Krastins B., Rosenblatt M., Kilmer G., Major M., Kaboord B. J., Sarracino D., Rezai T., Prakash A., Lopez M., Ji Y., Priebe W., Lang F. F., Colman H., Conrad C. A. (2010) Quantitative Phosphoproteomic Analysis of the STAT3/IL-6/HIF1 alpha Signaling Network: An Initial Study in GSC11 Glioblastoma Stem Cells. J. Proteome Res. 9, 430–443 [DOI] [PubMed] [Google Scholar]
- 18. Goldstein J. L., Brown M. S. (1990) Regulation of the mevalonate pathway. Nature 343, 425–430 [DOI] [PubMed] [Google Scholar]
- 19. Takenawa T., Suetsugu S. (2007) The WASP-WAVE protein network: connecting the membrane to the cytoskeleton. Nat. Rev. Mol. Cell Biol. 8, 37–48 [DOI] [PubMed] [Google Scholar]
- 20. Bernheim-Groswasser A., Wiesner S., Golsteyn R. M., Carlier M. F., Sykes C. (2002) The dynamics of actin-based motility depend on surface parameters. Nature 417, 308–311 [DOI] [PubMed] [Google Scholar]
- 21. Lin Y. H., Park Z. Y., Lin D., Brahmbhatt A. A., Rio M. C., Yates J. R., 3rd, Klemke R. L. (2004) Regulation of cell migration and survival by focal adhesion targeting of Lasp-1. J. Cell Biol. 165, 421–432 [DOI] [PMC free article] [PubMed] [Google Scholar]
- 22. Dufour S., Ramprasad O. G., Srinivas G., Rao K. S., Joshi P., Thiery J. P., Pande G. (2007) Changes in cholesterol levels in the plasma membrane modulate cell signaling and regulate cell adhesion and migration on fibronectin. Cell Motil. Cytoskel. 64, 199–216 [DOI] [PubMed] [Google Scholar]
- 23. Sun M., Northup N., Marga F., Huber T., Byfield F. J., Levitan I., Forgacs G. (2007) The effect of cellular cholesterol on membrane-cytoskeleton adhesion. J. Cell Sci. 120, 2223–2231 [DOI] [PubMed] [Google Scholar]
- 24. Vitols S., Norgren S., Juliusson G., Tatidis L., Luthman H. (1994) Multilevel regulation of low-density lipoprotein receptor and 3-hydroxy-3-methylglutaryl coenzyme A reductase gene expression in normal and leukemic cells. Blood 84, 2689–2698 [PubMed] [Google Scholar]
- 25. Dimitroulakos J., Nohynek D., Backway K. L., Hedley D. W., Yeger H., Freedman M. H., Minden M. D., Penn L. Z. (1999) Increased sensitivity of acute myeloid leukemias to lovastatin-induced apoptosis: A potential therapeutic approach. Blood 93, 1308–1318 [PubMed] [Google Scholar]
- 26. Li H. Y., Appelbaum F. R., Willman C. L., Zager R. A., Banker D. E. (2003) Cholesterol-modulating agents kill acute myeloid leukemia cells and sensitize them to therapeutics by blocking adaptive cholesterol responses. Blood 101, 3628–3634 [DOI] [PubMed] [Google Scholar]
- 27. Tsuji T., Sugahara K., Tsuruda K., Uemura A., Harasawa H., Hasegawa H., Hamaguchi Y., Tomonaga M., Yamada Y., Kamihira S. (2004) Clinical and oncologic implications in epigenetic down-regulation of CD26/dipeptidyl peptidase IV in adult T-cell leukemia cells. Int. J. Hematol. 80, 254–260 [DOI] [PubMed] [Google Scholar]
- 28. Turcot V., Bouchard L., Faucher G., Tchernof A., Deshaies Y., Pérusse L., Bélisle A., Marceau S., Biron S., Lescelleur O., Biertho L., Vohl M. C. (2011) DPP4 gene DNA methylation in the omentum is associated with its gene expression and plasma lipid profile in severe obesity. Obesity 19, 388–395 [DOI] [PubMed] [Google Scholar]
- 29. Wesley U. V., Albino A. P., Tiwari S., Houghton A. N. (1999) A role for dipeptidyl peptidase IV in suppressing the malignant phenotype of melanocytic cells. J. Exp. Med. 190, 311–322 [DOI] [PMC free article] [PubMed] [Google Scholar]
- 30. Claus R., Lübbert M. (2003) Epigenetic targets in hematopoietic malignancies. Oncogene 22, 6489–6496 [DOI] [PubMed] [Google Scholar]
- 31. De Meester I., Korom S., Van Damme J., Scharpé S. (1999) CD26, let it cut or cut it down. Immunol. Today 20, 367–375 [DOI] [PubMed] [Google Scholar]


