

Abstract
The telomeric amplicon at 8p12 is common in oestrogen receptor-positive (ER+) breast cancers. Array-CGH and expression analyses of 1172 primary breast tumours revealed that ZNF703 was the single gene within the minimal amplicon and was amplified predominantly in the Luminal B subtype. Amplification was shown to correlate with increased gene and protein expression and was associated with a distinct expression signature and poor clinical outcome. ZNF703 transformed NIH 3T3 fibroblasts, behaving as a classical oncogene, and regulated proliferation in human luminal breast cancer cell lines and immortalized human mammary epithelial cells. Manipulation of ZNF703 expression in the luminal MCF7 cell line modified the effects of TGFβ on proliferation. Overexpression of ZNF703 in normal human breast epithelial cells enhanced the frequency of in vitro colony-forming cells from luminal progenitors. Taken together, these data strongly point to ZNF703 as a novel oncogene in Luminal B breast cancer.
Keywords: breast cancer, oestrogen metabolism, Luminal B, oncogene, ZNF703
INTRODUCTION
In human cancers, genes altered by amplification and concomitant overexpression are considered candidate oncogenes (Santarius et al, 2010). However, amplicons often include several candidates making it difficult to delineate the true cancer gene. Amplification (frequently high-level) of the proximal chromosomal arm 8p (8p12) is common in breast cancer (Chin et al, 2006). There are four amplification cores consistently identified at 8p12 with the most telomeric of these cores being the most common and characterized originally by our group as containing only 6 genes (Garcia et al, 2005), a finding consistently confirmed by other studies (Adelaide et al, 2007; Gelsi-Boyer et al, 2005; Haverty et al, 2008; Kwek et al, 2009; Prentice et al, 2005). Correlation between copy number and gene expression was previously used to exclude GPR124, leaving as candidates the following five genes, ordered from telomere to centromere: ZNF703, ERLIN2, PROSC, BRF2, and RAB11FIP1 (Adelaide et al, 2007; Garcia et al, 2005; Gelsi-Boyer et al, 2005; Haverty et al, 2008; Kwek et al, 2009). Despite this work, the identity of the driver oncogene at the most telomeric amplicon at 8p12 remains unknown. This has made functional characterization of the putative driver oncogene extremely difficult since several genes have to be analysed. We hypothesized that using higher resolution platforms for copy number profiling to characterize a larger number of cancers than what has been performed to date would allow a more precise mapping of the minimal amplicon. Furthermore, parallel analyses of the same cancers with gene expression arrays could then be used to further define putative targets by a more robust correlation analysis between copy number and gene expression. In addition, this was used to classify breast cancers into one of the intrinsic molecular subtypes (Luminal A, Luminal B, Her2, Basal-like and Normal-like) (Sorlie et al, 2003) and therefore investigate preferential amplification across these. Oestrogen receptor-positive (ER+) breast cancers are almost all luminal with the better prognosis ones usually classifying as Luminal A and the more aggressive, higher grade, and less responsive to hormone therapy being more commonly Luminal B. The Her2 subtype identifies mostly the oestrogen receptor-negative (ER−), ERBB2-amplified cancers, and Basal-like cancers are mostly ER− and overexpress basal cytokeratins.
In this study, we profiled two cohorts of 171 and 1001 primary breast cancers to further refine the minimal amplicon, and have functionally characterized ZNF703, the sole candidate that emerged from these studies, as the likely driver oncogene at distal 8p12.
RESULTS
The 8p12 telomeric amplicon drives expression in luminal primary cancers and breast cancer cell lines
We previously profiled copy number aberrations in a cohort of 171 primary breast tumours (the NT-series—see Materials and Methods) and in a panel of 49 breast cancer cell lines, using customized oligonucleotide microarrays containing 27,801 60-mer oligonucleotide probes (herein called the 28k-array) with unique map positions (Chin et al, 2007). A joint analysis of the segmented copy number data from primary tumours and breast cancer cell lines delineated the boundaries of a common minimal 8p12 telomeric amplicon of 500–600 kb in size spanning ZNF703, ERLIN2, PROSC, GPR124, BRF2, and RAB11FIP. Gains of this minimal amplicon were observed in 32% of primary tumours (10% had amplifications) and 24% of cell lines (5% had amplifications), confirming our earlier results in a smaller series using lower resolution BAC arrays (Garcia et al, 2005).
The correlation between copy number and gene expression was assessed for each of these genes using Illumina BeadArrays to profile mRNA expression in 99 tumours from the NT-series for which RNA of appropriate quality was available (Fig 1A). Microarray expression data were validated by RT-QPCR (Fig S1A). For each gene except GPR124, we observed a clear increase in gene expression between copy number neutral, gained, and amplified ER+ cases. The ER− cases were almost exclusively copy number neutral for this region (53/54). GPR124 expression was similar across all categories and expression was copy number-independent, hence this gene was again ruled out as the driver for this amplicon. We observed a similar relationship between gene dosage and expression for the six genes within the 8p12 amplicon in a set of 39 breast cancer cell lines also profiled on the Illumina platform (Fig S1B). The corresponding Pearson correlation coefficients were as follows: ZNF703 (0.72), ERLIN2 (0.79), PROSC (0.78), GPR124 (−0.03), BRF2 (0.87), and RAB11FIP1 isoforms (−0.35 to 0.73), similarly eliminating GPR124 as a driver oncogene in cell lines. The slightly lower correlation of ZNF703 copy number and gene expression compared to the other 4 genes can be explained by a group of 5 ER+ cell lines (KPL-1, HCC1419, MDA-MB-361, T47D and IBEP-1), which overexpress ZNF703 in a copy-neutral background. No similar outliers were found for the other copy number-driven genes in the amplicon. Removal of these samples resulted in an increase of the Pearson correlation coefficient to 0.9. We also noted that out of the 6 genes within the amplicon, ZNF703 is the only one with significantly lower expression in ER− tumours (Fig 1A).
Figure 1. Expression of genes within the telomeric 8p12 amplicon is copy number-driven and highest in Luminal B tumours.

- Boxplots of normalized gene expression in 99 tumours (obtained using Illumina arrays) in relation to copy number (CN) state (determined using 28k-arrays).
- Boxplots of normalized expression in tumours according to the intrinsic subtype (Luminal A = 43; Luminal B = 22; Normal-like = 13; Her2-enriched = 24; Basal-like = 24), based on the PAM50 classifier.
Further examination of the expression levels of the six genes across the breast cancer molecular subtypes defined by the PAM50 classifier (Parker et al, 2009) revealed that all but GPR124 and RAB11FIP1 are significantly overexpressed in Luminal B compared to Luminal A tumours (Fig 1B, Wilcoxon rank sum test p < 0.05). Furthermore, ZNF703, BRF2, and RAB11FIP1 expression levels were significantly higher in Luminal B compared to Basal-like tumours, while GPR124 was significantly lower (Fig 1B).
Narrowing of the minimal amplicon in 1001 breast cancers profiled using high-resolution SNP arrays
The design of the 28k-array CGH platform described above was gene-centric, almost always with a single probe per gene, limiting the ability to confidently map copy number segments encompassed by a few probes. We therefore used copy number data from a further 1001 primary breast cancers, the MB-series (Curtis et al, manuscript in preparation), profiled using Affymetrix SNP 6.0 arrays to robustly define the telomeric and centromeric boundaries of the minimal amplicon (Fig 2). In at least 20 primary tumours, the telomeric boundary was placed in the ∼750 kb ‘gene desert’ separating KCNU1, outside the amplicon, and ZNF703, inside the amplicon. The centromeric boundary could be confidently mapped to an interval that separates the 3′ end of the short isoform of ERLIN2 and the 5′ end of PROSC. The consensus minimal amplicon defined by these boundaries therefore contained only two genes: ZNF703 and ERLIN2. In 5 cases (MB-0636, MB-2854, MB-5427, MB-0628, and MB-5291), the minimal amplicon included only these two genes. Copy number gain or amplification of ZNF703/ERLIN2 was detected in 23.2% (8.7% amplification) of ER+ tumours and only 11.7% (2% amplification) of ER− tumours. Alteration of this region was most prevalent in Luminal B tumours (32.5% gain or amp, 13% amplification), less common in Luminal A tumours (18.7% gain or amp, 6.4% amplification), and present in less than 14% (3.4% amplification) of tumours in the remainder of subtypes (Fig S2A). Interestingly, amplifications of ZNF703/ERLIN2 and ERBB2 in luminal tumours were nearly mutually exclusive (Fig S2B).
Figure 2. Mapping the 8p12 amplicon using high-resolution SNP arrays narrows its core to ZNF703. Copy number and expression mapping of the 8p12 distal amplicon for selected samples from the MB-series and sample NT-2347 from the NT-series.

ER status (determined by IHC), intrinsic subtype (using PAM50 classifier) are shown colour coded on the left. Colour bars on the right indicate log2 values. Top panel: IGV heatmap (http://www.broadinstitute.org/igv) of segmented copy number data for individual samples used to define the centromeric and telomeric boundaries of the amplicon. Bottom panel: Focused view of the two tumours in which the amplicon was restricted to ZNF703 illustrating probe-level copy number data (log2, black dots) and normalized expression values.
Copy number driven expression of both ZNF703 and ERLIN2, and their association with ER status and the intrinsic subtypes was confirmed in the 1001 primary tumours from the MB-series, validating the predominant association with Luminal B breast cancers (Fig S2C and D). Additionally, immunohistochemical staining of both proteins in normal human breast tissue was done using antibodies tested for performance and specificity (see Supporting information for details). ZNF703 protein expression was detected at low levels in the nucleus of scattered normal luminal epithelial cells (Fig S2E). In contrast, ERLIN2 was expressed in a cytoplasmic peri-nuclear pattern in both epithelial (luminal and basal) and stromal cells (Fig S2F). In breast cancers, while ZNF703 protein expression correlated with ZNF703 mRNA levels and was significantly higher in ER+ tumours with amplification, the ERLIN2 protein expression pattern did not correlate with either ERLIN2 gene expression or copy number (Fig S2G). These data strongly favour ZNF703 as the likely candidate driver oncogene of the amplicon.
ZNF703 is the only gene within the amplicon in two Luminal B breast cancers
We noted that there was a single tumour out of 1001 analysed using Affymetrix arrays, MB-0884, with exclusive amplification of ZNF703 (Fig 2, top panel). None of the other 18 genes in the 850 kb interval spanned by ZNF703 and C8ORF86 (containing all four 8p12 amplification cores mentioned in the Introduction) appeared exclusively as a single-gene amplicon in these 1001 tumours (data not shown). This prompted a careful reanalysis of the 28k-array data revealing that one of the original 171 cases (NT-2347) had a log2 value for the ZNF703 probe consistent with high-level amplification, but was missed by the segmentation algorithm. DNA from this case was then hybridized to a 244K Agilent oligonucleotide array as well as the Affymetrix SNP 6.0 array, confirming a focal high-level amplification of ZNF703 (Fig 2, bottom panel and Fig S2H). In both tumours, ZNF703 was overexpressed, while ERLIN2 exhibited normal/reduced expression levels (Fig 2, bottom panel). The two tumours were classified as Luminal B and had few other genomic aberrations (Fig S2I). These genomic and transcriptomic data firmly establish ZNF703 as the sole candidate driver oncogene of the 8p12 telomeric amplicon that occurs in about 1/3 of Luminal B breast cancers.
ZNF703-amplified tumours are associated with a distinctive transcriptional signature and have worse clinical outcome
We next asked whether breast cancers with ZNF703 amplification have distinctive genomic, transcriptomic or clinical features that separate them from other luminal tumours.
A recent analysis of 4 breast cancer cohorts, which included the NT-series, revealed that 8p12 amplified tumours, frequently including ZNF703, had high complex arm aberration indices (Russnes et al, 2010). We observed a similar trend in tumours with ZNF703 amplification from the MB-series analysed here (examples in Fig S2J). These patterns are characteristic of breast cancers with higher genomic instability and more aggressive clinical behaviour.
To characterize the transcriptional landscape of Luminal B tumours with ZNF703 amplified/overexpressed, genes differentially expressed in these breast cancers relative to ZNF703 copy neutral cases were identified (Table S1A) and subject to pathway analyses. Tumours with elevated ZNF703 levels were characterized by alterations in a lipid metabolism and detoxification pathway in which DHRS2 (Hep27), a short-chain dehydrogenase family member, acts as a key nuclear signalling component (Fig 3A; Fig S3A). Other components of the detoxification signature include the UDP-glucuronosyltransferases, UGT2B11 and UGT2B7. UGT2B11 regulates the levels of oestrogen metabolites (Turgeon et al, 2001). Notably, this detoxification signature was also observed in breast cancer cell lines with ZNF703 amplification or upregulation when a similar analysis was done (Fig S3B and C; Table S1B). These data show that primary luminal tumours and luminal breast cancer cell lines with ZNF703 amplification/overexpression have a distinctive gene expression signature.
Figure 3. ZNF703-amplified tumours are characterized by a lipid metabolism and detoxification gene expression signature and have poor clinical prognosis.

- Graphical representation of the key enzymes and molecules involved in canonical lipid metabolism and detoxification pathways enriched for amongst ZNF703-amplified or overexpressing tumours in the MB-series. Dark red represents molecules whose expression levels are up-regulated greater than 1.5-fold, whereas dark blue represents molecules whose expression levels are down-regulated greater than 1.5-fold. All genes/molecules are significantly differentially expressed with FDR-adjusted p-values < 0.01. Arrows represent biological relationships between molecules and the various shapes represent the functional class of the gene product.
- Kaplan–Meier plots (Breast cancer-specific survival, BCSS) and p-values based on a log-rank test are indicated for the comparison of ZNF703 (8p12)-amplified (AMP) versus neutral (NEUT) cases amongst ER-positive tumours.
Amplification of 8p12 in breast cancers has previously been associated with poor prognosis (Gelsi-Boyer et al, 2005; Letessier et al, 2006; Prentice et al, 2005), and we therefore asked whether ZNF703 amplification was associated with worse clinical outcome in the two cohorts described herein. In both series, we observed that ZNF703 amplification was associated with reduced breast cancer specific survival in ER+ cancers (Fig 3B).
ZNF703 causes transformation in the classical NIH 3T3 mouse fibroblast primary focus formation assay
To determine whether ZNF703 had oncogenic properties, we examined whether ectopic ZNF703 expression could transform NIH 3T3 mouse fibroblasts in proliferation, primary focus formation, and soft agar assays. Cells expressing KrasG12D4B were used as a positive control for the primary focus formation assay (data not shown). Western blot analysis was used to confirm protein expression in transfected cells (Fig 4A, left panel). ZNF703 promoted proliferation of NIH 3T3 cells (Fig 4A, right panel). NIH 3T3 cells ectopically expressing ZNF703 exhibited a significant loss of contact inhibition (Fig 4B, left panel), with mock transfected cells displaying no focus formation and ZNF703-overexpressing NIH 3T3 cells forming hundreds of foci per plate. NIH 3T3 cells ectopically expressing ZNF703 also exhibited significant induction of anchorage-independent growth (Fig 4B, right panel). Taken together, these data demonstrate that ZNF703 promotes proliferation and transformation of NIH 3T3 cells.
Figure 4. ZNF703-mediated transformation of NIH 3T3 mouse fibroblasts and proliferation effects in human breast epithelial cells.

- Ectopic ZNF703 expression in NIH 3T3 cells and proliferation. Left panel: Western blot showing ectopic expression of ZNF703 in NIH 3T3 infected cells. Right panel: Proliferation curve of NIH 3T3 fibroblasts ectopically expressing ZNF703. The mean and standard deviation of one representative experiment performed in triplicate is shown.
- NIH 3T3 transformation assays. Left panel: Focus formation assay showing foci formed by ectopic expression of ZNF703. Representative pictures of the foci were taken after GIEMSA staining at low and high magnification. Right panel: Bar plot showing counts of colonies in soft agar assay. Colonies were photographed and counted after 4 weeks in 10 random fields (Magnification: ×20). The mean and standard deviation of one representative experiment performed in duplicate is shown.
- Proliferation in MCF7 cells with manipulated ZNF703 expression. MCF7 cells were infected either with a lenti-ZNF703 or lenti-control. Lentiviral infected cells were then transfected with scrambled or siRNA oligonucleotides targeting endogenous ZNF703, grown for 48 h and parallel replicate plates (in triplicate) used for RNA extraction, or lysed and cross-linked for Western blot and chromatin IP experiments. Left panel: Bar plot (mean and standard deviation) of BrdU incorporation assay. Right panel: Western blot for ZNF703 and Actin.
- Proliferation in HCC1500 cells. Bar plot (mean and standard deviation) of BrdU incorporation assay of HCC1500 cells transfected with either control or ZNF703 siRNA.
- Proliferation in HMECs. FACS dot plots and bar chart with results of cell cycle analysis of lenti-control and lenti-ZNF703 infected 184-hTERT immortalized cells.
ZNF703 regulates proliferation in breast epithelial cells
Next, to determine whether ZNF703 could regulate proliferation in breast epithelial cells, we manipulated ZNF703 expression in a luminal breast cancer cell line, MCF7, with neutral copy number and an intermediate level expression of ZNF703, using RNAi and lentiviral overexpression (Fig S4). Knockdown and overexpression of ZNF703 protein was verified using Western blotting (Fig 4C, right panel). In lenti-ZNF703 transfected cells, ZNF703 protein levels were similar in si-control and si-ZNF703 cells, since the siRNA targets the 3′UTR of the endogenous protein. We used BrdU incorporation to measure cell proliferation and these experiments showed that upon knockdown of ZNF703 protein there was a significant decrease in BrdU incorporation as compared to control cells with baseline levels of ZNF703 (Fig 4C, left panel). There was no significant change in proliferation of MCF7 cells where ZNF703 protein was overexpressed.
We also used RNAi to knockdown ZNF703 in HCC1500 cells, which display amplification and overexpression of ZNF703, and detected decreased proliferation using the BrdU assay (Fig 4D).
Finally, we wanted to determine whether ZNF703 overexpression regulated proliferation in non-malignant human mammary epithelial cells (HMECs) (Fig 4E). For these experiments, we used the 184-hTERT immortalized normal mammary epithelial cell line (Horikawa et al, 2002; Stampfer et al, 2001). In 184-hTERT cells infected with lenti-ZNF703, where ZNF703 overexpression was verified by RT-QPCR, a statistically significant 1.92-fold increase in the percentage of cells in S-phase (as measured by EdU incorporation) was observed as compared to lenti-control infected cells. HMECs overexpressing ZNF703 also showed statistically significant decrease of G0/G1 cells and increase of G2/M cells (Fig 4E).
In summary, these experiments show that modulation of ZNF703 expression regulates proliferation in human breast epithelial cells.
Modulation of ZNF703 protein expression alters the effects of TGFβ on proliferation of MCF7 cells
Gene expression arrays were used for transcriptional profiling of the MCF7 cells with manipulated ZNF703 expression by RNAi or overexpression (Fig S4). As expected, ZNF703 was one of the top upregulated genes upon its overexpression in MCF7 cells (Fig 5A, top panel). Importantly, amongst the genes whose expression levels were significantly altered (222 in total, Table S2) as a result of ZNF703 overexpression in MCF7 cells, a subset was also differentially expressed in primary tumours with ZNF703 amplification/overexpression: DHRS2, HPGD, ID2, IRX5, SLOM1, NLK, and EFHD1, which were significantly up-regulated, and ZFP36L2, UGT2B7, and RALB, which were down-regulated (Table S1A). Another gene significantly down-regulated in MCF7 cells was the cell cycle inhibitor CDKN2B. In contrast, in the ZNF703-knockdown cells there were few differentially expressed genes (Fig 5A, bottom panel), none reached significance using the stringent criteria used above. However, ZNF703 was one of the top downregulated genes. One of the top upregulated genes was transforming growth factor beta receptor II (TGFBR2). TGFBR2 was also expressed at lower levels in ER+ primary breast cancers with ZNF703 overexpression (Table S3). We validated a representative selection of differentially expressed genes by RT-QPCR, including CDKN2B and TGFBR2, confirming the robustness of results from the microarray experiments (Fig S5).
Figure 5. ZNF703 modulates TGFβ proliferation responses in MCF7 cells.

- Genes differentially expressed in MCF7 cells with ZNF703 manipulation. Top panel: Clustered heatmap of differentially expressed genes in MCF7 cells overexpressing ZNF703. Bottom panel: Volcano plot showing differentially expressed genes in MCF7 ZNF703 knockdown.
- Proliferation of MCF7 cells with ZNF703 overexpression versus control in response to TGFβ. Left panel: Bar plot of BrdU incorporation assay. Right panel: RT-qPCR for TGFβ-pathway genes.
- Proliferation of MCF7 cells with ZNF703 knockdown versus control in response to SB-431542. Left panel: Bar plot of BrdU incorporation assay. Right panel: Western blot for pSMAD2 and total SMAD2.
- TGFBR2 chromatin immuno-precipitation (ChIP). Left panel: Schematic representation of the genomic regions around the TGFBR2 and PRKCE genes and relative location of primer sequences used for PCR of immunoprecipitated chromatin. Middle panel: Fold enrichment measured by real-time PCR of the regulatory regions described above in ZNF703 versus IgG control ChIP from untransfected MCF7 cells. The data are the average (±SD) of three individual replicates. Right panel: Fold enrichment measured by real-time PCR in ChIP for p300 and HDAC-1 from si-control or si-ZNF703 transfected MCF7 cells. Data show the average of three independent replicates ±Std Dev. * denotes p < 0.05.
TGFβ is a well known potent inhibitor of proliferation in MCF7 cells. TGFBR2 and CDKN2B, found differentially expressed upon ZNF703 manipulation, are TGFβ-pathway genes. We therefore asked whether in MCF7 cells with overexpression or knockdown of ZNF703, there would be modulation of proliferation, measured using BrdU incorporation, in response to activation or inhibition of the TGFβ-pathway (Fig 5B and C). We saw that upon treatment with recombinant TGFβ1, MCF7 cells display significantly decreased proliferation, as expected, and this effect was not seen in cells with ZNF703 overexpression (Fig 5B, left panel). This was accompanied by reduced TGFBR2 transcript levels and abrogation of upregulation of TGFβ target genes (TGFBI, transforming growth factor, beta-induced and PAI1, plasminogen activator inhibitor type 1) (Fig 5B, right panel). In the reverse experiment, we observed that, when we treated ZNF703-knockdown MCF7 cells with the TGFβ-pathway inhibitor SB-431542, there was no longer a decrease in proliferation, as observed in control cells (Fig 5C, left panel). Western blotting (Fig 5C, right panel) of extracts from these cells showed a modest increase in pSMAD2 in si-ZNF703 cells compared with si-control cells and complete absence of pSMAD2 in cells treated with the inhibitor. We quantified the western blot bands to determine the proportion of SMAD2 that was phosphorylated using Image Quant TL (GE Healthcare) and this confirmed that in si-ZNF703 cells, there was a significant measurable 10% absolute increase in pSMAD2 compared to control cells. These results reveal that, upon modulation of ZNF703 protein expression, the effect of TGFβ on the proliferation of MCF7 cells is altered.
We next mapped ZNF703 binding to the locus of the putative target gene TGFBR2 using chromatin immunoprecipitation (ChIP) (Fig 5D). Primers were designed against the promoter and to a region shown to possess H3K4me1 or H3K4me3 histone modifications around the locus from public Encode datasets (Fig 5D, left panel). Included as a control were primers against a region containing H3K4 activity in the PRKCE gene, which is not altered by ZNF703. In native MCF7 cells, we found ZNF703 binding at regions within the TGFBR2 gene, but not at the control region within the PRKCE gene (Fig 5D, middle panel). To determine whether ZNF703 was binding in a repressive manner to the regulatory regions interrogated, we assessed binding of the histone acetyl transferase p300 and the histone deacetylase HDAC1 to these regions in the presence or knockdown of ZNF703 (Fig 5D, right panel). In the si-control transfected cells, we observed HDAC1 binding to the regions also bound by ZNF703, suggesting that ZNF703 may mediate active repression. In cells transfected with si-ZNF703, we observed a decrease in HDAC1 binding, alongside recruitment of p300, and RT-qPCR showed upregulation of TGFBR2 (Fig S5), hence indicative of active transcription. These ChIP results show that modulation of ZNF703 in breast cancer cells alters histone modifier protein recruitment to TGFBR2 cis-regulatory elements, resulting in a shift from a repressive state to a transcriptionally active state upon knockdown of ZNF703.
ZNF703 expression in primary human mammary epithelium drives luminal progenitors and represses basal progenitors
The strong association of ZNF703 amplification/overexpression with luminal breast cancers prompted us to ask whether ZNF703 expression could affect the ability of normal luminal and basal progenitors in primary human mammary epithelium to differentiate in vitro. The presence of mammary progenitor cells within adult human breast tissue can be assayed and quantified using colony-formation assays. These include cells that are myoepithelial/basal-restricted, luminal-restricted, or bipotent, the latter representing the most primitive cell within the breast lineage hierarchy that can be quantified in vitro (Stingl et al, 2001). We were able to enrich for these progenitor cell fractions following the parameters described by Stingl et al. Briefly, reduction mammoplasty tissue obtained from 6 independent patient samples was subjected to a series of enzymatic dissociations to obtain a single cell suspension. Using 4-color flow cytometry, cells were initially depleted of haematopoietic and endothelial cells based on lack of CD45 and CD31 expression, respectively. Following this, EpCam and CD49f expression was used to prospectively fractionate the remaining epithelial cells into luminal progenitor (EpCam+, CD49f+) and bi-potent progenitor (EpCam−, CD49f+) enriched fractions (Fig 6A). We infected the enriched pools of luminal and basal mammary epithelial progenitors with either lenti-ZNF703 or lenti-control virus. The assay endpoint was colony count, which was done in a total of 24 plates (4 per patient-derived sample: two for luminal and two for basal progenitors, respectively control and ZNF703 transfected) (Supp. Table 4). An omnibus test of equality of ZNF703 infected counts for the luminal and basal fractions, adjusting for control counts, showed strong evidence of a difference in colony-formation counts between the two fractions (ANCOVA F(2,8) = 11.419, p = 0.0045) (Fig 6B). Within fractions and counting differentiated luminal or basal colonies as the assay endpoint, the luminal progenitor enriched fraction showed a statistically significant 2.23-fold increase in colony counts when infected with lenti-ZNF703, as compared with the control (p < 0.05; 95% CI adjusted for multiple comparisons: 1.48-2.98) (Fig 6C). The basal progenitor enriched fraction showed a statistically significant 2.60-fold decrease in colony counts (p < 0.05; 95% CI adjusted for multiple comparisons: 0.05–0.72) (Fig 6C). These data robustly show that ZNF703 differentially regulates luminal and basal progenitors in primary human mammary epithelium.
Figure 6. ZNF703 expression affects progenitors in normal mammary epithelium.
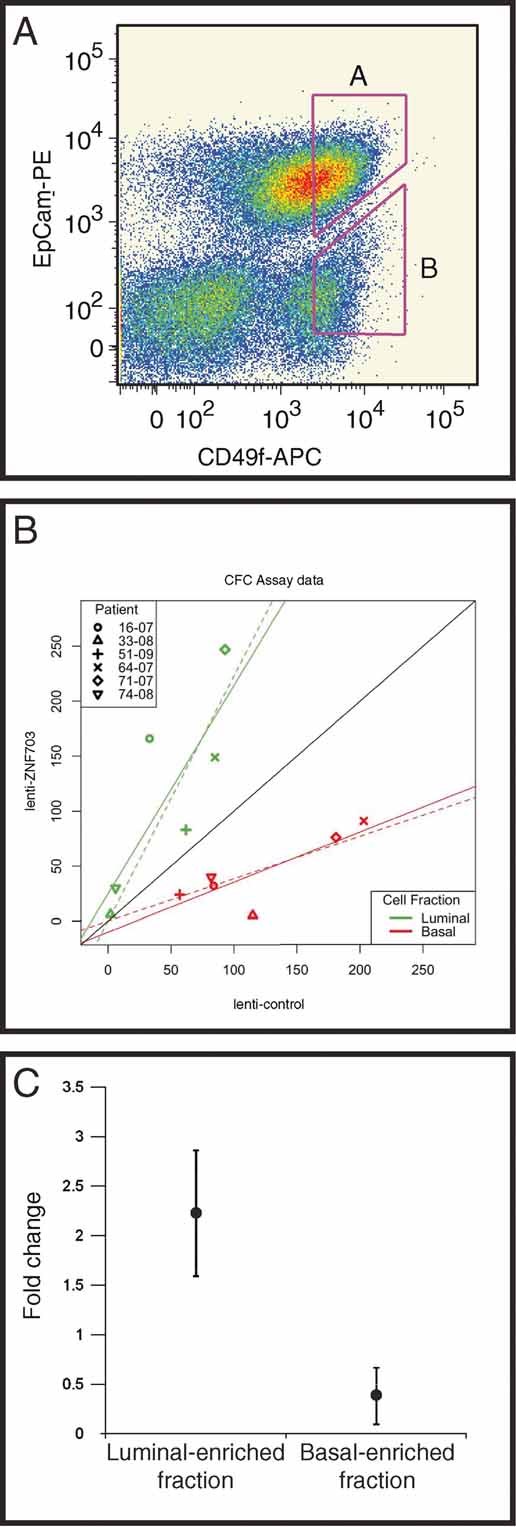
- FACS plot of one of the primary mammary epithelium single cell suspensions showing the gating used to isolate the Luminal-enriched fraction (A) and Basal-enriched fraction (B).
- CFC assay data bivariate plot. X-axis shows the number of colonies counted under the control condition (empty vector). Y-axis shows the number of colonies counted under the experimental condition (vector containing ZNF703 construct). Black reference line has slope = 1.0 and intercept = 0. Solid lines show full linear model fit results. Dashed lines show linear model fits with intercept constrained to be zero.
- CFC assay results with chart showing colony count fold change with ZNF703 overexpression in Luminal-enriched (A) or Basal-enriched (B) sorted fractions relative to the empty vector control condition. Vertical bars represent 95% confidence intervals (n = 6).
DISCUSSION
We have exploited the power of high-resolution copy number profiling in a large number of breast cancers (from two independent series of primary tumours and a panel of breast cancer cell lines) to significantly narrow the most telomeric 8p12 amplicon down to only two genes (ZNF703 and ERLIN2) and to identify two cases where ZNF703 was the only gene within the amplicon (Fig 2). These two tumours were classified as Luminal B and had very few other genomic aberrations, none of which were in common, providing compelling evidence for ZNF703 amplification being an early driver event in both tumours. Importantly, IHC shows ZNF703 (nuclear) protein in breast cancer cells is concomitantly increased with gene copy number/expression (Fig S2E and F), as predicted for an oncoprotein. Although ZNF703 expression in ER+ tumours was mostly copy number-driven, the gene was also highly expressed in a subset of ER+ luminal cancers without 8p12 amplification (Fig S2). These cases were disproportionately of the Luminal B subtype, suggesting that ZNF703 could be deregulated in these tumours by alternative mechanisms. One such mechanism might involve modulation of oestrogen responsiveness, given that ZNF703 has a conserved ER-binding site active in ER+ breast cancer cell lines and primary tumours [(Lin et al, 2007) and J. Carroll, unpublished observations], and ZNF703 is an ER-responsive gene (data not shown). Indeed, we have identified a robust lipid metabolism and detoxification signature characteristic of Luminal B ZNF703-amplified or -overexpressing tumours that is conserved in luminal cell lines (Figs 3 and S3). Numerous oestrogen metabolizing enzymes including the UDP glucuronosyltransferases (UGT2B7 and UGT2B11), glutathione-S-transferases (GSTP1, GSTT1, MGST1), ACOX2, and HMGCS2 were found to be co-ordinately downregulated in this pathway, which converges upon DHRS2/Hep27, a short chain dehydrogenase implicated in cytochrome P450 xenobiotic metabolism. Taken together, these observations suggest a possible role for ZNF703 in modulating oestrogen metabolism in luminal tumours.
An important observation that arises from our data is that ZNF703 and ERBB2 amplifications (which are almost completely mutually exclusive) jointly account for around 2/3 of all breast cancers of the Luminal B subtype (Fig S2). This has potential for clinical application since a combination of IHC and FISH for these two genes/proteins (ZNF703 and ERBB2) can now be used to identify these more aggressive ER+ cancers in the clinic.
A critical step in the validation of ZNF703 as a candidate oncogene was its ability to endow the NIH 3T3 non-neoplastic mouse fibroblast cells with the growth properties characteristic of cancer cells (Fig 4A and B). The focus formation assay is the classical transformation assay that was used to identify the first human oncogenes (Shih & Weinberg, 1982; Goldfarb et al, 1982). Transformation of epithelial cells is much more difficult but we were able to demonstrate that ZNF703 regulates proliferation in established human (luminal) breast cancer cell lines and in immortalized normal human mammary epithelium (Fig 4C–E). We note that a previous report demonstrated the ability of ZNF703 to transform breast epithelial cells expressing a dominant negative mutant of TP53 (Kwek et al, 2009). All of these observations provide compelling evidence to support ZNF703 as the driver oncogene of the distal 8p12 amplicon.
The ability of ZNF703 to regulate proliferation could potentially be explained by a pro-proliferation transcriptional program and prompted us to profile MCF7 cells with overexpression or knockdown of ZNF703 using gene expression arrays (Fig 5A). We noted significant downregulation of expression of CDKN2B with ZNF703 overexpression and marginal, but RT-qPCR verified, differential expression of TGFBR2 with ZNF703 manipulation. Both genes encode proteins in the canonical TGFβ pathway: one of the key receptors for TGFβ, TGFBR2, and a downstream target, the cell cycle inhibitor CDKNB2. TGFβ is a potent inhibitor of proliferation in MCF7 cells and hence we conducted experiments to investigate whether the TGFβ pathway could be modulated by altering ZNF703 expression. Although our data are of a preliminary nature, we note that in MCF7 cells with ZNF703 overexpression treated with TGFβ, there was less activation of the pathway as measured by RT-qPCR of target genes (TGFBI and PAI1), in association with abrogation of effect on proliferation (Fig 5B). In the inverse experiment, we showed that in MCF7 cells with ZNF703 knockdown, inhibition of TGFβ signalling rescues the effect on BrdU incorporation (Fig 5C), suggesting that upon ZNF703 knockdown there is unopposed TGFβ-pathway signalling. We saw binding of ZNF703 to regulatory sequences of TGFBR2 (Fig 5D), with consequent repression of transcription. This could in part explain the observed modulation.
In experiments conducted in primary normal mammary epithelium isolated from 6 independent woman, we showed that ZNF703 overexpression consistently favours the luminal differentiation pathway (Fig 6), suggesting a mechanistic link with the almost exclusive selection of amplifications in luminal tumours. There are several putative explanations for the increased colony numbers seen in the luminal progenitor cell population transduced with lenti-ZNF703. The most parsimonious explanation, given our observations that ZNF703 overexpression regulates proliferation, is that ZNF703 differentially regulates cell cycle in luminal/or bipotent progenitor cells. An alternative explanation, namely back recruitment of cells in early lineage commitment, could not be supported experimentally as transduction of differentiated EpCam+ CD49− luminal cells with lenti-ZNF703 did not induce colony formation in this population (data not shown).
The evolutionary conservation of ZNF703 provides some clues about possible molecular mechanism that should be explored in future experiments. ZNF703 is the human ortholog of zebrafish (Danio rerio, Dr) Nlz1 and together with its homologue ZNF503, the human ortholog of Dr Nlz2, form a family of highly evolutionary conserved C2H2 zinc finger genes, which includes the Drosophila (Drosophila melanogaster, Dm) genes ElB (elbow) and NocA (no ocelli) (Hoyle et al, 2004). Family members have a Groucho-binding motif, display nuclear localization and are directly associated with class I histone deacetylases, suggestive of repressors of transcription (Dorfman et al, 2002; Runko & Sagerstrom, 2004). Indeed, Nlz1/ZNF703 and Nlz2/ZNF503 repress transcription both in mammalian cell lines (human, rat and mouse) and in developing Dr embryos (Nakamura et al, 2008). Both Nlz1 and Nlz2 are capable of binding the PAX2 promoter, inhibiting PAX2 promoter-driven expression of luciferase in human cells (Brown et al, 2009). In Dm, there is parallel activity of ElB/NocA and the Dpp pathway (Dorfman et al, 2002), the homologue of the vertebrate bone morphogenetic proteins (BMPs), which are members of the TGFβ superfamily. We have obtained preliminary evidence that ZNF703 (and ZNF503) co-immunoprecipitates with ER in the nucleus along with Groucho homologues, HDAC1 and HDAC2 (J. Carroll, unpublished observations). Future experiments will address what is the interplay among ZNF703, ER and chromatin repression.
Recently murine znf703 (Zeppo1) has been shown to be a regulator of cell adhesion, migration, and proliferation in mammary epithelial cells (Slorach et al, 2011). In addition, these authors showed Zeppo1 regulates transcription, repressing E-cadherin expression and Wnt and TGBβ reporter expression.
In summary, the data presented here can be considered in light of the recently proposed weight-of-evidence based classification system for identifying individual genes in amplified regions that are selected for during tumour development (Santarius et al, 2010). Using this framework, ZNF703 qualifies as only the 13th Class II oncogene, scoring in 3 out of 4 types of supporting evidence:
Clinical correlation: ZNF703 amplification is associated with a distinct subtype (Luminal B breast cancer) and with worse clinical outcome in ER+ cancers. ZNF703 amplification is associated with higher grade and more aggressive tumours, explaining the worse clinical prognosis.
Genetic/genomic information: ZNF703 is the sole gene in the amplicon in two independent primary tumours, and its amplification leads to transcript and protein overexpression, as predicted for a classical oncogene.
Biological evidence: ZNF703 overexpression causes a biological effect with transforming activity in the classical NIH 3T3 focus formation and soft agar assays, regulation of proliferation in breast epithelial cells lines and differential regulation of progenitors in primary human mammary epithelium (showing pro-luminal activity).
An accompanying study (Sircoulomb et al, 2011) provides independent validation of some of our central findings: ZNF703 is predominantly amplified in Luminal B cancers, its expression regulates cell proliferation, and it is involved in modulating oestrogen response. The two manuscripts in our view provide definitive evidence for ZNF703 as a novel human breast cancer oncogene.
MATERIALS AND METHODS
Tumour and cell line samples for molecular profiling
We used two series of tumours for the analyses described here and these were obtained with appropriate consent and the studies approved by the relevant ethics boards.
The ‘NT-series’ was a set of 171 tumours (and 6 normal patient samples) previously described by our group in several molecular profiling studies (Blenkiron et al, 2007; Chin et al, 2007). (ArrayExpress accession: E-TABM-576). A set of 49 breast cancer cell lines were also profiled at the genomic level, 39 of which were also assayed at the mRNA level (Chin et al, 2007 and unpublished data) (ArrayExpress accession: E-TABM-827).
The ‘MB-series’ refers to a set of 1001 tumours with a minimum of 5 years of clinical follow up (Curtis et al, manuscript in preparation) that are broadly representative of a population-based collection (75% ER+). For this cohort, mRNA was hybridized to Illumina HT-12 BeadArrays, and copy number was assayed on the Affymetrix SNP 6.0 platform (data available through the European Genotype Archive—http://www.ebi.ac.uk/ega/page.php under Accession Number: EGAS082).
Briefly, samples were classified into the intrinsic subtypes based on the PAM50 gene list (Parker et al, 2009). A description of the normalization, segmentation, and statistical analyses is available in Supporting information. Pathway-based analysis was carried out using Ingenuity Pathways Analysis (Ingenuity® Systems, www.ingenuity.com).
The paper explained
PROBLEM
Despite their better overall prognosis, the survival rates of patients with ER-positive breast cancers are extremely variable and identifying biomarkers and drivers of poor outcome is an important step to improve clinical management. Luminal B breast cancers are the clinically more aggressive ER-positive tumours and characterizing the genomic drivers (oncogenes) at chromosomal loci frequently altered in this subtype has been the subject of intense research.
RESULTS
Here, we characterize ZNF703 as the driver of the frequent amplification of a distal 8p12 locus, which occurs in around 1/3 of Luminal B breast cancers, less frequently in other ER-positive tumours and uncommonly in ER-negative tumours. ZNF703 behaves as a classical oncogene in that it transforms non-malignant cells and increases cellular proliferation. The amplification of the gene is accompanied by overexpression of the encoded protein, which can be observed using immunostaining of tissue sections, making its detection in routine histopathology laboratories possible.
IMPACT
ZNF703 is a new breast cancer oncogene and a potential prognostic biomarker and therapeutic target in the more aggressive ER-positive breast cancers.
Real time PCR
RT-qPCR was performed on the ABI Prism 7900HT sequence detection system (Applied Biosystems) using SYBR® Green reporter. All the samples were analysed as triplicates and some runs were repeated to assess the robustness. Details are provided in Supporting information.
NIH 3T3 transformation assays
hZNF703 and mKrasG12D4B cDNAs were cloned into pBabe-hygro (Addgene plasmid 1765) or pBabe-puro, respectively. NIH 3T3 cells were infected with retroviruses produced in Phoenix packaging cells and were selected with puromycin or hygromycin. Experiments were performed using 2 independent NIH 3T3 infected pools. For the proliferation assay NIH 3T3 cells were plated in triplicates in 12-well plates and counted every day for 4 days. For the focus formation assay, cells were plated in duplicates, cultured until confluence and a week later stained. Details are provided in Supporting information. Anchorage independent growth assay used colony formation in soft agar. Briefly, 25,000 cells were plated in duplicates in DMEM with 15% serum and 0.34% low-melting point agarose (LMP, BioGene) onto 6-cm dishes coated with 0.5% LMP. Cells were grown for 4 weeks.
Manipulation of ZNF703 levels in MCF7 cells
For knock-down experiments, sub-confluent MCF7 cultures were transfected with 100 nM either a si-ZNF703 pool targeting the 3′UTR of endogenous ZNF703 or a non-targeting siRNA (si-control) using Lipofectamine 2000 (Invitrogen). For overexpression experiments, sub-confluent MCF7 cultures were infected twice on consecutive days with either lenti-control (HIV-ZsGreen; Welm et al, 2008) or lenti-ZNF703 containing the entire ZNF703 coding sequence, and sorted by GFP expression to eliminate non-infected cells. Protein, total RNA and chromatin were extracted from replicate samples.
ZNF703 and beta-actin protein levels were assessed by Western blot analysis. Total RNA was analysed by RT-QPCR and Illumina HT-12 BeadArrays (data available through the NCBI's Gene Expression Omnibus—http://www.ncbi.nlm.nih.gov/geo/through GEO Series accession number GSE23673). Chromatin was immunoprecipitated as in (Schmidt et al, 2009) using anti-ZNF703, anti-p300 or anti-HDAC1 antibodies and analysed by QPCR. Detailed experimental description, primer sequences and statistical analyses are available in Supporting information.
TGFβ-pathway modulation
Recombinant human TGFβ1 (R&D systems) was added to cell culture at a final concentration of 2.5 ng/ml. SB-431542 (Sigma) inhibitor of TβRI was added to cell culture at a final concentration of 10 µM.
BrdU incorporation assay
Cells were pulsed with 10 µM BrdU (Sigma) for 1 h (MCF7) or 4 h (HCC1500). Cells were detached with trypsin, fixed in 75% ethanol and treated as follows (PBS with 0.5% BSA washes between each step): 2 M HCl; 0.1 M sodium borate pH 8.5; FITC-conjugated anti-BrdU (BD Biosciences) diluted 1:5 in PBS with 0.5% BSA and 0.5% Tween20 for 1 h at room temperature; finally, PBS with 5 µg/ml propidium iodide, 0.1 mg/ml RNAse A and 0.1% Triton X-100. Samples were analysed by two-dimensional flow cytometry to detect both fluorescein and propidium iodide.
ZNF703 overexpression in immortalized human mammary epithelial cells
The 184-hTERT-L9 immortalized normal mammary epithelial cell lines were infected with freshly thawed lentiviral particles and Zsgreen positive cells were expanded and subsequently subjected to cell cycle and ZNF703 expression analysis. For details see Supporting information.
ZNF703 overexpression in primary human mammary epithelium
Discarded tissue was collected with informed consent from premenopausal women (ages 19–40) undergoing reduction mammoplasty surgery as approved by the University of British Columbia Research Ethics Board. Post-collection processing was performed as previously described (Stingl et al, 2005) to generate a cryopreserved epithelial-cell rich pellet. Single cell suspensions from freshly thawed pellets were subjected to basal and luminal population discrimination by FACS-sorting using an allophycocyanin-conjugated rat antibody to human CD49f and a phycoerythrin-conjugated mouse antibody to human EpCam, respectively (Eirew et al, 2008). Haematopoietic and endothelial cells were eliminated using antibodies to human CD45 and human CD31, respectively.
Sorted populations of primary HMECs were immediately infected with freshly thawed lenti-control or lenti-ZNF703 virus at an estimated multiplicity of infection (MOI) of 3. After 18 h at 37°C, equal numbers of cells were plated in CFC assays performed as previously described (Raouf et al, 2008) and upon methylene blue staining, colonies with 50 cells or more were visually scored under a dissecting microscope. For details of tissue processing, FACS sorting, transduction, CFC assays and associated statistical analyses, see Supporting information.
Acknowledgments
The authors acknowledge scientific discussions and advice about transformation assays with Dr. David Tuveson and excellent technical contributions from Adrian Wan, Darcy Wilkinson, and the staff of the Flow Cytometry Facility of the Terry Fox Laboratory at the BC Cancer Agency, and the staff at the Genomics, Bioinformatics and Histology Core Facilities at the CRI. Mammoplasty tissue was obtained with the assistance of Drs. Jane Sproul, Peter Lennox, Nancy Van Laeken and Richard Warren.
Supporting information is available at EMBO Molecular Medicine online.
The authors declare that there is no conflict of interest.
Author contributions
DH, AB, AG, MG, PP-M, ABr, RA, WG did most experiments. S-FC performed the microarray experiments. MJD, SS, SM, OMR, AGL, SM and ChC performed the bioinformatics and statistical analysis. AH and JSC were responsible for ChIP experiments. IOE contributed the tumour samples and pathology expertise for the NT-series. CJE and SA supervised the experiments on HMECs and primary human breast epithelium. SA and CC conceived and supervised the studies on the MB-series. DH, AB, AG, ABr, JSC, ChC, SA and CC contributed to the original drafting of the manuscript. All authors contributed to manuscript editing. CC conceived and supervised the study, drafted the manuscript and did the final manuscript editing.
Supplementary material
Detailed facts of importance to specialist readers are published as ”Supporting Information”. Such documents are peer-reviewed, but not copy-edited or typeset. They are made available as submitted by the authors.
References
- Adelaide J, Finetti P, Bekhouche I, Repellini L, Geneix J, Sircoulomb F, Charafe-Jauffret E, Cervera N, Desplans J, Parzy D, et al. Integrated profiling of basal and luminal breast cancers. Cancer Res. 2007;67:11565–11575. doi: 10.1158/0008-5472.CAN-07-2536. [DOI] [PubMed] [Google Scholar]
- Blenkiron C, Goldstein LD, Thorne NP, Spiteri I, Chin SF, Dunning MJ, Barbosa-Morais NL, Teschendorff AE, Green AR, Ellis IO, et al. MicroRNA expression profiling of human breast cancer identifies new markers of tumor subtype. Genome Biol. 2007;8:R214. doi: 10.1186/gb-2007-8-10-r214. [DOI] [PMC free article] [PubMed] [Google Scholar]
- Brown JD, Dutta S, Bharti K, Bonner RF, Munson PJ, Dawid IB, Akhtar AL, Onojafe IF, Alur RP, Gross JM, et al. Expression profiling during ocular development identifies 2 Nlz genes with a critical role in optic fissure closure. Proc Natl Acad Sci USA. 2009;106:1462–1467. doi: 10.1073/pnas.0812017106. [DOI] [PMC free article] [PubMed] [Google Scholar]
- Chin K, DeVries S, Fridlyand J, Spellman PT, Roydasgupta R, Kuo WL, Lapuk A, Neve RM, Qian Z, Ryder T, et al. Genomic and transcriptional aberrations linked to breast cancer pathophysiologies. Cancer Cell. 2006;10:529–541. doi: 10.1016/j.ccr.2006.10.009. [DOI] [PubMed] [Google Scholar]
- Chin SF, Teschendorff AE, Marioni JC, Wang Y, Barbosa-Morais NL, Thorne NP, Costa JL, Pinder SE, van de Wiel MA, Green AR, et al. High-resolution aCGH and expression profiling identifies a novel genomic subtype of ER negative breast cancer. Genome Biol. 2007;8:R215. doi: 10.1186/gb-2007-8-10-r215. [DOI] [PMC free article] [PubMed] [Google Scholar]
- Dorfman R, Glazer L, Weihe U, Wernet MF, Shilo BZ. Elbow and Noc define a family of zinc finger proteins controlling morphogenesis of specific tracheal branches. Development. 2002;129:3585–3596. doi: 10.1242/dev.129.15.3585. [DOI] [PubMed] [Google Scholar]
- Eirew P, Stingl J, Raouf A, Turashvili G, Aparicio S, Emerman JT, Eaves CJ. A method for quantifying normal human mammary epithelial stem cells with in vivo regenerative ability. Nat Med. 2008;14:1384–1389. doi: 10.1038/nm.1791. [DOI] [PubMed] [Google Scholar]
- Garcia MJ, Pole JC, Chin SF, Teschendorff A, Naderi A, Ozdag H, Vias M, Kranjac T, Subkhankulova T, Paish C, et al. A 1 Mb minimal amplicon at 8p11-12 in breast cancer identifies new candidate oncogenes. Oncogene. 2005;24:5235–5245. doi: 10.1038/sj.onc.1208741. [DOI] [PubMed] [Google Scholar]
- Gelsi-Boyer V, Orsetti B, Cervera N, Finetti P, Sircoulomb F, Rouge C, Lasorsa L, Letessier A, Ginestier C, Monville F, et al. Comprehensive profiling of 8p11-12 amplification in breast cancer. Mol Cancer Res. 2005;3:655–667. doi: 10.1158/1541-7786.MCR-05-0128. [DOI] [PubMed] [Google Scholar]
- Goldfarb M, Shimizu K, Perucho M, Wigler M. Isolation and preliminary characterization of a human transforming gene from T24 bladder carcinoma cells. Nature. 1982;296:404–409. doi: 10.1038/296404a0. [DOI] [PubMed] [Google Scholar]
- Haverty PM, Fridlyand J, Li L, Getz G, Beroukhim R, Lohr S, Wu TD, Cavet G, Zhang Z, Chant J. High-resolution genomic and expression analyses of copy number alterations in breast tumors. Genes Chromosomes Cancer. 2008;47:530–542. doi: 10.1002/gcc.20558. [DOI] [PubMed] [Google Scholar]
- Horikawa I, Cable PL, Mazur SJ, Appella E, Afshari CA, Barrett JC. Downstream E-box-mediated regulation of the human telomerase reverse transcriptase (hTERT) gene transcription: evidence for an endogenous mechanism of transcriptional repression. Mol Biol Cell. 2002;13:2585–2597. doi: 10.1091/mbc.E01-11-0107. [DOI] [PMC free article] [PubMed] [Google Scholar]
- Hoyle J, Tang YP, Wiellette EL, Wardle FC, Sive H. nlz gene family is required for hindbrain patterning in the zebrafish. Dev Dyn. 2004;229:835–846. doi: 10.1002/dvdy.20001. [DOI] [PubMed] [Google Scholar]
- Kwek SS, Roy R, Zhou H, Climent J, Martinez-Climent JA, Fridlyand J, Albertson DG. Co-amplified genes at 8p12 and 11q13 in breast tumors cooperate with two major pathways in oncogenesis. Oncogene. 2009;28:1892–1903. doi: 10.1038/onc.2009.34. [DOI] [PMC free article] [PubMed] [Google Scholar]
- Letessier A, Sircoulomb F, Ginestier C, Cervera N, Monville F, Gelsi-Boyer V, Esterni B, Geneix J, Finetti P, Zemmour C, et al. Frequency, prognostic impact, and subtype association of 8p12, 8q24, 11q13, 12p13, 17q12, and 20q13 amplifications in breast cancers. BMC Cancer. 2006;6:245. doi: 10.1186/1471-2407-6-245. [DOI] [PMC free article] [PubMed] [Google Scholar]
- Lin CY, Vega VB, Thomsen JS, Zhang T, Kong SL, Xie M, Chiu KP, Lipovich L, Barnett DH, Stossi F, et al. Whole-genome cartography of estrogen receptor alpha binding sites. PLoS Genet. 2007;3:e87. doi: 10.1371/journal.pgen.0030087. [DOI] [PMC free article] [PubMed] [Google Scholar]
- Nakamura M, Choe SK, Runko AP, Gardner PD, Sagerstrom CG. Nlz1/Znf703 acts as a repressor of transcription. BMC Dev Biol. 2008;8:108. doi: 10.1186/1471-213X-8-108. [DOI] [PMC free article] [PubMed] [Google Scholar]
- Parker JS, Mullins M, Cheang MC, Leung S, Voduc D, Vickery T, Davies S, Fauron C, He X, Hu Z, et al. Supervised risk predictor of breast cancer based on intrinsic subtypes. J Clin Oncol. 2009;27:1160–1167. doi: 10.1200/JCO.2008.18.1370. [DOI] [PMC free article] [PubMed] [Google Scholar]
- Prentice LM, Shadeo A, Lestou VS, Miller MA, deLeeuw RJ, Makretsov N, Turbin D, Brown LA, Macpherson N, Yorida E, et al. NRG1 gene rearrangements in clinical breast cancer: identification of an adjacent novel amplicon associated with poor prognosis. Oncogene. 2005;24:7281–7289. doi: 10.1038/sj.onc.1208892. [DOI] [PubMed] [Google Scholar]
- Raouf A, Zhao Y, To K, Stingl J, Delaney A, Barbara M, Iscove N, Jones S, McKinney S, Emerman J, et al. Transcriptome analysis of the normal human mammary cell commitment and differentiation process. Cell Stem Cell. 2008;3:109–118. doi: 10.1016/j.stem.2008.05.018. [DOI] [PubMed] [Google Scholar]
- Runko AP, Sagerstrom CG. Isolation of nlz2 and characterization of essential domains in Nlz family proteins. J Biol Chem. 2004;279:11917–11925. doi: 10.1074/jbc.M310076200. [DOI] [PubMed] [Google Scholar]
- Russnes HG, Vollan HK, Lingjaerde OC, Krasnitz A, Lundin P, Naume B, Sorlie T, Borgen E, Rye IH, Langerod A, et al. Genomic architecture characterizes tumor progression paths and fate in breast cancer patients. Sci Transl Med. 2010;2:38ra47. doi: 10.1126/scitranslmed.3000611. [DOI] [PMC free article] [PubMed] [Google Scholar]
- Santarius T, Shipley J, Brewer D, Stratton MR, Cooper CS. A census of amplified and overexpressed human cancer genes. Nat Rev Cancer. 2010;10:59–64. doi: 10.1038/nrc2771. [DOI] [PubMed] [Google Scholar]
- Schmidt D, Wilson MD, Spyrou C, Brown GD, Hadfield J, Odom DT. ChIP-seq: using high-throughput sequencing to discover protein–DNA interactions. Methods. 2009;48:240–248. doi: 10.1016/j.ymeth.2009.03.001. [DOI] [PMC free article] [PubMed] [Google Scholar]
- Shih C, Weinberg RA. Isolation of a transforming sequence from a human bladder carcinoma cell line. Cell. 1982;29:161–169. doi: 10.1016/0092-8674(82)90100-3. [DOI] [PubMed] [Google Scholar]
- Sircoulomb F, Nicolas N, Ferrari A, Finetti P, Bekhouche I, Rousselet E, Lonigro A, Adelaide J, Baudelet E, Esteyries S, et al. ZNF703 gene amplification at 8p12 specifies luminal B breast cancer. Embo Mol Med. 2011 doi: 10.1002/emmm.201100121. DOI: 10.1002/emmm.201100121. [DOI] [PMC free article] [PubMed] [Google Scholar]
- Slorach EM, Chou J, Werb Z. Zeppo1 is a novel metastasis promoter that represses E-cadherin expression and regulates p120-catenin isoform expression and localization. Genes Dev. 2011 doi: 10.1101/gad.1998111. (in press) [DOI] [PMC free article] [PubMed] [Google Scholar]
- Sorlie T, Tibshirani R, Parker J, Hastie T, Marron JS, Nobel A, Deng S, Johnsen H, Pesich R, Geisler S, et al. Repeated observation of breast tumor subtypes in independent gene expression data sets. Proc Natl Acad Sci USA. 2003;100:8418–8423. doi: 10.1073/pnas.0932692100. [DOI] [PMC free article] [PubMed] [Google Scholar]
- Stampfer MR, Garbe J, Levine G, Lichtsteiner S, Vasserot AP, Yaswen P. Expression of the telomerase catalytic subunit, hTERT, induces resistance to transforming growth factor beta growth inhibition in p16INK4A(−) human mammary epithelial cells. Proc Natl Acad Sci USA. 2001;98:4498–4503. doi: 10.1073/pnas.071483998. [DOI] [PMC free article] [PubMed] [Google Scholar]
- Stingl J, Eaves CJ, Zandieh I, Emerman JT. Characterization of bipotent mammary epithelial progenitor cells in normal adult human breast tissue. Breast Cancer Res Treat. 2001;67:93–109. doi: 10.1023/a:1010615124301. [DOI] [PubMed] [Google Scholar]
- Stingl J, Emerman JT, Eaves CJ. Enzymatic dissociation and culture of normal human mammary tissue to detect progenitor activity. Methods Mol Biol. 2005;290:249–263. doi: 10.1385/1-59259-838-2:249. [DOI] [PubMed] [Google Scholar]
- Turgeon D, Carrier JS, Levesque E, Hum DW, Belanger A. Relative enzymatic activity, protein stability, and tissue distribution of human steroid-metabolizing UGT2B subfamily members. Endocrinology. 2001;142:778–787. doi: 10.1210/endo.142.2.7958. [DOI] [PubMed] [Google Scholar]
- Welm BE, Dijkgraaf GJ, Bledau AS, Welm AL, Werb Z. Lentiviral transduction of mammary stem cells for analysis of gene function during development and cancer. Cell Stem Cell. 2008;2:90–102. doi: 10.1016/j.stem.2007.10.002. [DOI] [PMC free article] [PubMed] [Google Scholar]
Associated Data
This section collects any data citations, data availability statements, or supplementary materials included in this article.