

Abstract
Candida albicans is the most important Candida species causing vulvovaginal candidiasis (VVC). VVC has significant medical and economical impact on women's health and wellbeing. While current antifungal treatment is reasonably effective, supportive and preventive measures such as application of probiotics are required to reduce the incidence of VVC. We investigated the potential of the probiotics Lactobacillus rhamnosus GR-1 and Lactobacillus reuteri RC-14 towards control of C. albicans. In vitro experiments demonstrated that lactic acid at low pH plays a major role in suppressing fungal growth. Viability staining following cocultures with lactobacilli revealed that C. albicans cells lost metabolic activity and eventually were killed. Transcriptome analyses showed increased expression of stress-related genes and lower expression of genes involved in fluconazole resistance, which might explain the increased eradication of Candida in a previous clinical study on conjoint probiotic therapy. Our results provide insights on the impact of probiotics on C. albicans survival.
1. Introduction
Mucosal infections by Candida albicans and related non-albicans Candida species are some of the most frequently encountered infections in modern medicine. Oral thrush and vulvovaginal candidiasis (VVC) amass the largest numbers of incidences among mucocutaneous Candida infections. While most forms of candidiasis affect immunocompromised individuals, VVC is commonly encountered by millions of otherwise healthy women. Estimates on the occurrence of VVC point to at least one episode of VVC in 75% of all women [1–3]. Clinical signs of vaginitis appear when the balance between the host and fungal colonization is disrupted, for example, by antibiotic suppression of beneficial components of the bacterial vaginal microbiota. Of note, unlike bacterial vaginosis (BV), the condition is not associated with a depletion of lactobacilli per se. Recurrent VVC, defined as at least four episodes in one year, affects a subpopulation, the treatment of whom requires long-term antifungal therapy [4]. After BV, VVC is the second most common cause of vaginitis, affecting about 40% of women with vaginal complaints [5]. In the USA, diagnosis and treatment of VVC and the concomitant loss of productivity was last estimated in 1995 to cost US$ 1.8 billion [6].
While the treatment of VVC is relatively effective, it has been suggested that patients could benefit from restoration of the vaginal microbiota and/or modulation of the local mucosal immune response via supplementation with probiotics. Furthermore, some non-albicans Candida species are inherently more resistant to antifungal agents and therefore can pose a greater challenge to treatment. Establishment of a healthy vaginal microbiota using beneficial Lactobacillus strains might be a supportive and preventive measure against VVC. A recent randomized, double-blind and placebo-controlled trial by Martinez and coworkers has shown that Lactobacillus rhamnosus GR-1 and L. reuteri RC-14 increased the efficacy of antifungal agents in women diagnosed with VVC [7]. In a related in vitro study it was also noted that these probiotics had the potential to inhibit C. albicans, the most common cause of VVC [8].
In the present study, the objective was to learn more about the molecular mechanisms of C. albicans growth inhibition by the probiotic strains using microbiological and genome-wide expression analyses.
2. Material and Methods
2.1. Strains and Culture Conditions
The Candida albicans and bacterial strains used in this study are listed in Table 1. Stock cultures of all strains were stored at −80°C with 15% v/v glycerol as cryopreservative. C. albicans was routinely grown in YPD media (10 g/L yeast extract, 20 g/L tryptone, and 20 g/L dextrose). For coculture assays, C. albicans was grown in the same media as lactobacilli and staphylococci, that is, Difco Lactobacilli MRS broth (BD Diagnostics, Franklin Lakes, NJ, USA). Regular agar plates contained 15 g/L Agar (Fisher BioReagents, Pittsburgh, PA, USA) while 7 g/L of agar were used in soft agar overlays. Standard incubation conditions for pure yeast cultures were 30°C and ambient aeration. Bacteria were grown at 37°C under a 5% CO2 atmosphere in a CO2 incubator. Bacteria-Candida cocultures were incubated as indicated in a CO2 incubator or in ambient air at 37°C growth temperature.
Table 1.
Bacterial and Candida albicans strains used in this study.
| Strain | Origin | Reference |
|---|---|---|
| Candida albicans SC5314 | Wild-type isolate | [9] |
| Lactobacillus johnsonii PV016 | Intestinal isolate | This study |
| Lactobacillus rhamnosus GR-1 | Vaginal isolate | [10, 11] |
| Lactobacillus reuteri RC-14 | Vaginal isolate | [10, 11] |
| Staphylococcus aureus ATCC 25923 | Clinical isolate | http://www.atcc.org/ |
2.2. Growth Inhibition Studies
The effects of the presence of Lactobacillus strains on the growth of C. albicans were determined in vitro on agar plates and in liquid cultures. The intestinal Lactobacillus johnsonii strain PV016 and the non-lactic acid bacterium Staphylococcus aureus ATCC 25923 were used as controls. Plate assays with deferred inoculation of C. albicans were performed on MRS or MRS-MOPS (MRS medium buffered with 0.165 M 3-morpholinopropane-1-sulfonic acid to pH 7.0) media. For the plate overlay assays, overnight cultures of the bacteria were diluted to an OD600 nm of 1 and 4 μL of the dilution were spotted on MRS or MRS-MOPS agar plates. After incubation for 2 days at 37°C in a CO2 incubator, plates were overlayed with a C. albicans suspension (OD600 nm = 0.01) in MRS soft agar (0.7% agar) that was prepared after cooling the autoclaved agar medium to 45°C. Following solidification of the soft agar overlay, plates were incubated for one day at 37°C in normal aerobic atmosphere. Overlay plates were inspected for clear zones with no C. albicans growth surrounding bacterial colonies capable of inhibiting growth of the fungi. Disk diffusion assays were used to detect inhibition of C. albicans growth by lactic acid. Briefly, 20 μL of lactic acid dilutions were pipetted onto antibiotic assay disks (diameter 6 mm, Whatman, GE Health Care, Piscataway, NJ, USA) and the disks were placed on MRS or MRS-MOPS agar plates inoculated for dense growth of C. albicans. Clear zones around the disks after 24 hr incubation at 37°C indicated fungal growth inhibition by lactic acid.
2.3. Candida albicans Viability Assay
Viability of C. albicans cells during coculture with lactobacilli was qualitatively assessed using the FUN 1 viability indicator (LIVE/DEAD Yeast Viability Kit; Invitrogen, Carlsbad, CA, USA) and fluorescence microscopy. After a 24 hr incubation of C. albicans cells in MRS at 37°C in presence or absence (control) of lactobacilli, cells were washed with GH buffer (10 mM Na-HEPES buffer pH 7.2 containing 2% glucose). FUN 1 cell stain was diluted in the same buffer to a concentration of 5 μM and the solution was added to the cells. Following incubation for 30 min in the dark, a Biorad MRC-1024 confocal laser scanning microscope was used to determine the metabolic activity of the yeast cells. Excitation and emission filter sets for green and red fluorescence of FUN 1 were used according to the manufacturer's directions. Intact metabolically active C. albicans cells converted the green-fluorescent intracellular FUN 1 dye to red fluorescent intravacuolar structures. Cells with little or no metabolic activity but still intact membranes just show diffuse cytoplasmic green fluorescence and no red intravacuolar bodies. In contrast, diffuse and extremely bright green-yellow fluorescence indicates dead cells. For semiquantitative assessment of fungal viability, the FUN 1 viability assay was adapted for fluorometric measurement of metabolic activity according to the manufacturer's recommendations. Following overnight incubation of C. albicans cells (starting OD600 nm 0.1) in MRS with bacteria (starting OD600 nm 0.05) or in the presence of lactic acid, the viability of C. albicans cells was determined by kinetic readings of red (excitation filter 485/20, emission filter 590/35) and green (excitation filter 485/20, emission filter 528/20) fluorescence in a BioTek Synergy 2 multimode microplate reader (BioTek, Winooski, VT, USA). For this purpose, aliquots from cultured cells were washed in GH buffer, adjusted to OD600 nm 0.5 in 200 μL GH + 5 μM FUN 1 and subsequently incubated for 1 hr in the microplate reader at 30°C. Red and green fluorescence readings were taken every 5 minutes and red/green ratios were determined to monitor the viability of fungal cells. An increase in the red/green ratio over time indicated the presence of the metabolic activity required for formation of the red fluorescent intravacuolar structures. Bacteria did not convert the dye (data not shown).
2.4. Transcriptional Profiling
For genome-wide transcriptional analysis of C. albicans challenged by the presence of lactobacilli, cocultures of both microorganisms were established in 6-well plates with ThinCert (Greiner Bio-One, Monroe, NC, USA) inserts that kept both cell populations separated by a PET membrane with a pore-size of 0.45 μm. Fungal cells were inoculated in the lower compartment and pregrown for 6 hrs at 37°C in 5% CO2 atmosphere without shaking. Lactobacilli were then inoculated in the ThinCert compartment and the cocultures were incubated up to 24 hrs total incubation time (i.e., 18 hrs in coculture). Parallel C. albicans cultures without addition of lactobacilli served as controls. At various time points, the pH of the medium was measured and the cell density of both bacterial and fungal cells was determined by spectrophotometry at 600 nm. C. albicans cells were harvested and total RNA was isolated using a FastPrep FP120A instrument in conjunction with the FastRNA Pro Red kit (MP Biomedicals, Solon, OH, USA). Isolated total RNAs underwent further purification with the Qiagen RNeasy Mini kit (Qiagen, Valencia, CA, USA). Integrity and concentration of the total RNAs were determined by agarose gel electrophoresis and spectrophotometry, respectively. For preparation of Affymetrix GeneChip (Affymetrix, Santa Clara, CA, USA) hybridization targets, 50 ng of the highly-purified total RNAs were used for cDNA generation, Ribo-SPIA amplification, and biotin-labeling using the NuGEN Ovation Biotin system (NuGEN Technologies Inc., San Carlos, CA, USA). The resulting biotin-labeled single-stranded cDNAs were used in C. albicans GeneChip hybridizations according to the manufacturers' directions. The custom-made C. albicans GeneChips were described previously [12]. Following hybridization in a GeneChip Hybridization Oven 640 and a GeneChip Fluidics Station 400 (Affymetrix), the microarrays were scanned using a GeneArray Scanner (Hewlett-Packard). The resulting image files were processed for absolute and comparative expression analysis using MICROARRAY SUITE 5.0 (MAS 5.0; Affymetrix). Global scaling to a target intensity of 500 was used to correct for variations between arrays. Experimental data were stored in MICRODB 3.0 and analyzed in DATA MINING TOOL 3.0 (Affymetrix) as well as MICROSOFT ACCESS. Default parameters were used for the statistical algorithms implemented in MAS 5.0 to calculate probe set signals, signal log ratios (SLR) as well as detection and change P values. For determination of differential gene expression between Lactobacillus-Candida coculture experiments and Candida-only controls, we also employed the SNOMAD software for standardization and normalization of microarray data (http://pevsnerlab.kennedykrieger.org/snomadinput.html [13]). Here, signals (intensities) of experiment-control sets are log-transformed and the log ratios are normalized by calculation of a local mean across the element signal intensities (LOESS fit). Furthermore, a local variance correction is applied and a Z score is calculated for each probe set as a measure for differential expression. Transcripts with Z scores ≥3 were considered significantly increased and transcripts with Z scores ≤−3 were considered significantly decreased in comparative analyses. In order to group genes with similar regulation, cluster analyses were performed using the programs Cluster and TreeView [14].
3. Results and Discussion
3.1. In Vitro Growth Inhibition
The rich MRS medium was chosen for these experiments because it supported vigorous growth by the Lactobacillus, Staphylococcus aureus, and C. albicans strains. Agar overlays of C. albicans on MRS plates inoculated with the probiotic lactobacilli and control bacteria represented a relatively simple screening method for growth inhibitory activities of the bacteria towards this yeast. The deferred assay regimen with a 2-day preincubation of the bacteria was the method of choice because simultaneous inoculation often led to no or very small bacterial colonies due to rapid overgrowth by the fungal cells.
After 48 hrs of incubation, the probiotic Lactobacillus—C. albicans overlays revealed clearly visible zones of fungal growth inhibition around the Lactobacillus GR-1 and RC-14 colonies (see Figure 1(a)) on MRS plates. Very weak or no inhibition zones were found around the colonies of the control strains L. johnsonii PV016 and S. aureus ATCC 25923, respectively. PV016 was isolated by us from the prairie vole intestine and classified by molecular methods as L. johnsonii (data not shown). This strain appears to have only limited anti-Candida activity. Despite the vigorous growth of the S. aureus strain on MRS, no antifungal activity was detected in the overlay assay. S. aureus is not considered a lactic acid bacterium and appears to produce only limited amounts of lactic acid under aerobic conditions [15]. On buffered MRS-MOPS agar plates the clear areas around the probiotic lactobacilli were much smaller or absent. Thus, the inhibitory activities of lactobacilli towards C. albicans appear to be decreased when the media is buffered with MOPS to an initial pH of 7.0 before inoculation. The pH of unbuffered MRS media was 6.5 before inoculation. The formation of lactic acid and other organic acids by the growing probiotic lactobacilli is likely to cause a substantial decrease in the pH of unbuffered MRS.
Figure 1.
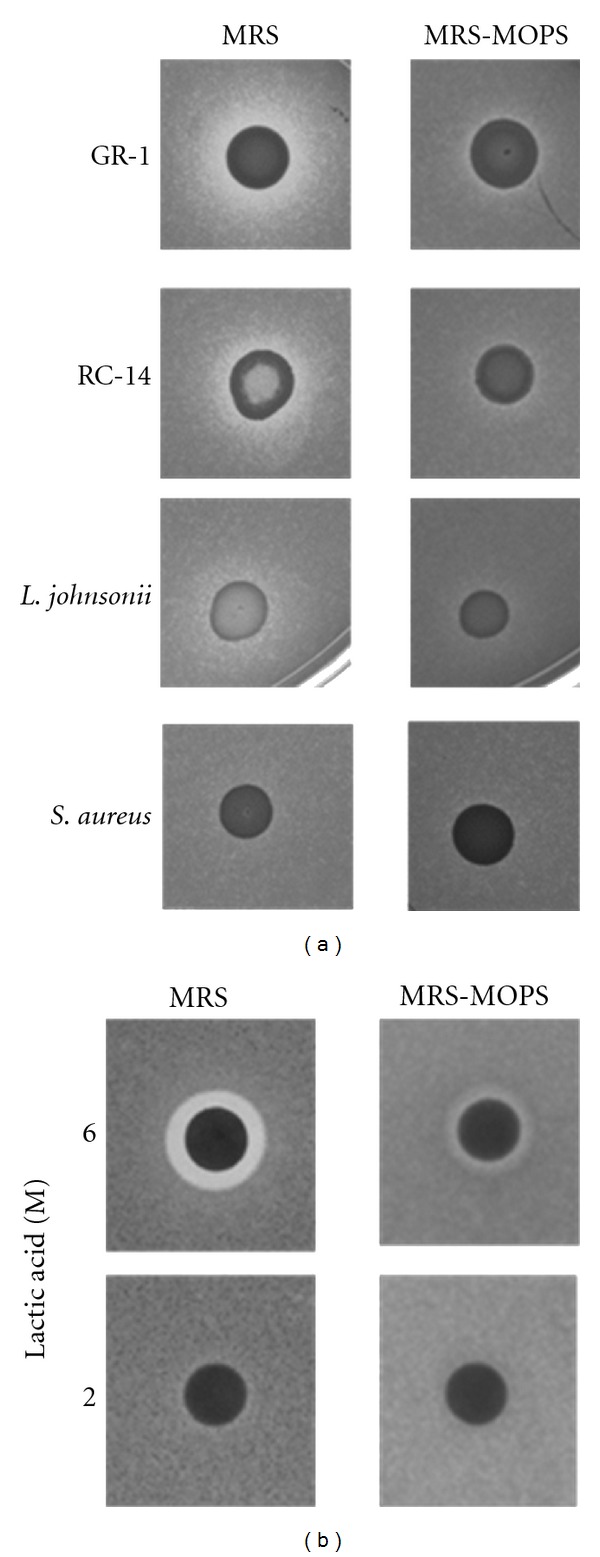
Agar inhibition assays with bacteria, lactic acid, and C. albicans. The images in (a) show the results of deferred agar overlay assays on bacterial colonies (L. rhamnosus GR-1, L. reuteri RC-14, L. johnsonii PV016, and S. aureus ATCC 25923) and C. albicans as the tester organism. The bacteria were spotted on MRS or buffered MRS-MOPS (pH 7.0) plates. After incubation for 48 hrs, bacterial colonies were overlayed with soft agar containing live C. albicans cells and incubated for another 24 hrs. For details see Section 2. A C. albicans lawn developed, but fungal growth was inhibited around the Lactobacillus colonies (clear zones), most predominantly around the probiotic strains GR-1 and RC-14. No inhibition was found with S. aureus. On MRS-MOPS buffered to pH 7 inhibition zones are much smaller or absent indicating reduced effectiveness of the lactobacilli. (b) Shows the results of disk diffusion assays using lactic acid in the indicated molarities (20 μL per disk) as the inhibitory compound. Plates were inoculated to produce a lawn of C. albicans and disks with lactic acid were immediately placed on the inoculated plates. Following 24 hrs incubation, only the 6 M concentration of lactic acid showed an inhibition zone on MRS. Similar to the overlay assays, the inhibition zone on the buffered MRS-MOPS medium was largely reduced.
In comparison to the probiotics, the L. johnsonii and S. aureus control strains apparently were not able to produce sufficient acid or other metabolic products to inhibit the fungi. On the other hand, the control results suggest that potential glucose or other nutrient exhaustion around the bacterial colonies is not a likely cause for fungal growth inhibition in the overlay assay. C. albicans also produces acids during aerobic growth and can drastically reduce the pH of batch cultures in some media [16, 17]. However, in an overnight culture of C. albicans grown in MRS at 37°C, we observed a pH reduction to only pH 6.0. In a disk diffusion assay with lactic acid, the potential inhibition of C. albicans growth by the acid was confirmed (Figure 1(b)). Clear zones around the disks were visible if the concentration of the acid was sufficiently high. However, performing the disk diffusion assay on MRS-MOPS revealed that buffering diminished the antifungal activity, similar to the overlay assays with bacteria.
For a more detailed assessment of the acid tolerance of C. albicans in MRS broth, we conducted growth assays with MRS containing lactic acid at different pH levels (not pH adjusted or adjusted to pH 7.0 and 4.5), and MRS adjusted to pH 4.5 using hydrochloric acid (Figure 2). These experiments revealed that C. albicans SC5314 growth is decreased at lower pH levels. The strongest growth inhibition was detected in MRS that contained lactic acid (120 mM) with no pH adjustment. Addition of 120 mM lactic acid to MRS resulted in an actual pH of 4.2. The growth inhibitory effect of this high concentration of lactic acid was reduced by pH adjustment to 4.5 and completely abrogated by neutralization to pH 7.0 with sodium hydroxide. Adjustment of the pH of MRS to 4.5 using hydrochloric acid led to intermediate growth reduction which was significantly lower than the reduction achieved by 120 mM lactic acid at pH 4.5. These results indicate that C. albicans appears to be sensitive to low pH and lactic acid.
Figure 2.
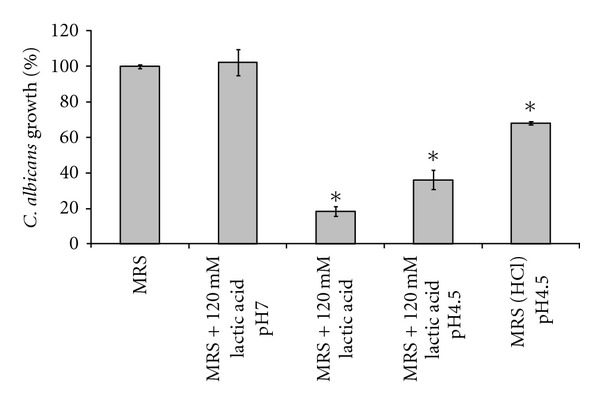
Inhibition of C. albicans growth by lactic acid at low pH. Microplate growth assays were used to determine the effect of lactic acid on the growth of C. albicans. MRS medium was supplemented with 120 mM lactic acid and the pH was adjusted to pH 4.5 or 7.0. MRS with 120 mM lactic acid had a pH of 4.2. As a control for low pH, MRS was adjusted to pH 4.5 using hydrochloric acid (MRS (HCL)). While acidic pH slows growth of C. albicans, the strongest growth inhibition was achieved with lactic acid at low pH. This inhibitory effect was completely lost by neutralization. Error bars show the standard deviations of two experiments with quadruplicate measurements. Statistical significant (P < 0.01) differences to all other conditions as calculated by ANOVA are indicated by asterisks.
In conjunction with acid stress, the increased concentration of membrane-permeable, undissociated lactic acid (pKa = 3.86) at low pH could have an inhibitory effect on the growth of the pathogenic yeast. Undissociated lactic acid permeates the plasma membrane by diffusion and subsequently dissociates into protons (H+) and lactic acid counterions. The charged ions are unable to cross the membrane bilayer, accumulate, and interfere with cell metabolism by acidification of the cytosol. Inhibition of fungal growth through lactic acid production by lactobacilli might therefore be most efficient at low pH.
Growth inhibition assays using culture filtrates from L. rhamnosus GR-1 and L. reuteri RC-14 indeed revealed that C. albicans growth was suppressed at low pH by the bacterial culture supernatants. Neutralization of the culture filtrates, however, completely abrogated the inhibitory effects of these supernatants (Figure 3). While the contribution of additional antifungal compounds produced by the lactobacilli in inhibiting C. albicans is unknown at present, our results indicate that lactic acid at low pH plays a major role in keeping fungal growth in check. Hydrogen peroxide production by L. reuteri RC-14 could be an additional anti-Candida factor. In contrast to L. rhamnosus GR-1, L. reuteri RC-14 produces H2O2 constitutively on MRS (data not shown). However, the relatively high resistance of C. albicans to this potential growth inhibitor likely diminishes its efficacy. The growth assays conducted in this study did not show that L. reuteri RC-14 was more potent in inhibiting C. albicans, despite the strain's ability to generate H2O2.
Figure 3.
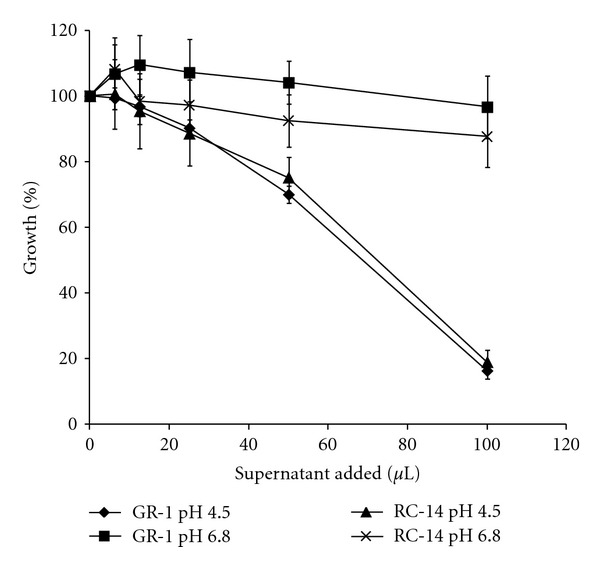
Growth inhibition of C. albicans by culture supernatants from probiotic lactobacilli. Cell-free culture supernatants of L. rhamnosus GR-1 and L. reuteri RC-14 were collected after 48 hrs of growth and adjusted to pH 4.5 and pH 6.8 using sodium hydroxide. Varying amounts of the supernatants were added to MRS media inoculated with C. albicans in microtiter plates (total volume per well 200 μL). After incubation at 37°C for 24 hrs, the cell densities were determined by OD600 nm readings. The inhibitory effect of the supernatants at low pH was lost at pH 6.8. Error bars show the standard deviations of at least triplicate experiments.
3.2. Fungicidal Activities of Lactobacilli
A microscopic approach was taken to visualize whether the probiotic lactobacilli are in fact able to kill the fungal cells. FUN-1 LIVE/DEAD staining following cocultures of the bacteria with C. albicans revealed that fungal cells lost metabolic activity in the presence of the lactobacilli and eventually were killed (Figure 4(a)). Semiquantitative analyses of C. albicans cell viability following exposure to low pH, lactic acid, and the bacterial strains used in this study revealed again that lactic acid at low pH and the probiotic strains GR-1 and RC-14 exert the most potent antifungal properties. The microplate-based assay system was used to determine cell viability by kinetic measurement of the intracellular conversion of the green fluorescent FUN-1 dye to red fluorescent intravacuolar structures. Only viable and metabolically active cells are able to carry out this conversion which can be monitored by determination of red/green fluorescence ratios in a fluorometer. Figure 4(b) shows the effect of MRS with lactic acid at pH 4.5 compared to MRS with HCl-adjusted pH 4.5 on C. albicans cell viability after overnight incubation. Presence of lactic acid under these conditions appears to affect fungal cell viability substantially more than just the low pH. The efficacy of the probiotic strains GR-1 and RC-14 to compete with C. albicans growth is also confirmed by the fluorometric viability assay results shown in Figure 4(c). Both strains generated the flattest red/green ratio curves indicating the strongest antagonistic effects on the fungi in this assay system. L. johnsonii PV016 appeared to have an intermediate effect on fungal cell viability while S. aureus only produced a minor reduction in the conversion rate from green to red fluorescence when compared to the C. albicans control (see Figure 4(c)). Overall, these viability assay results provide strong evidence that the probiotics are not only competing for nutrients and have fungistatic properties—under suitable conditions they can indeed exert fungicidal effects.
Figure 4.
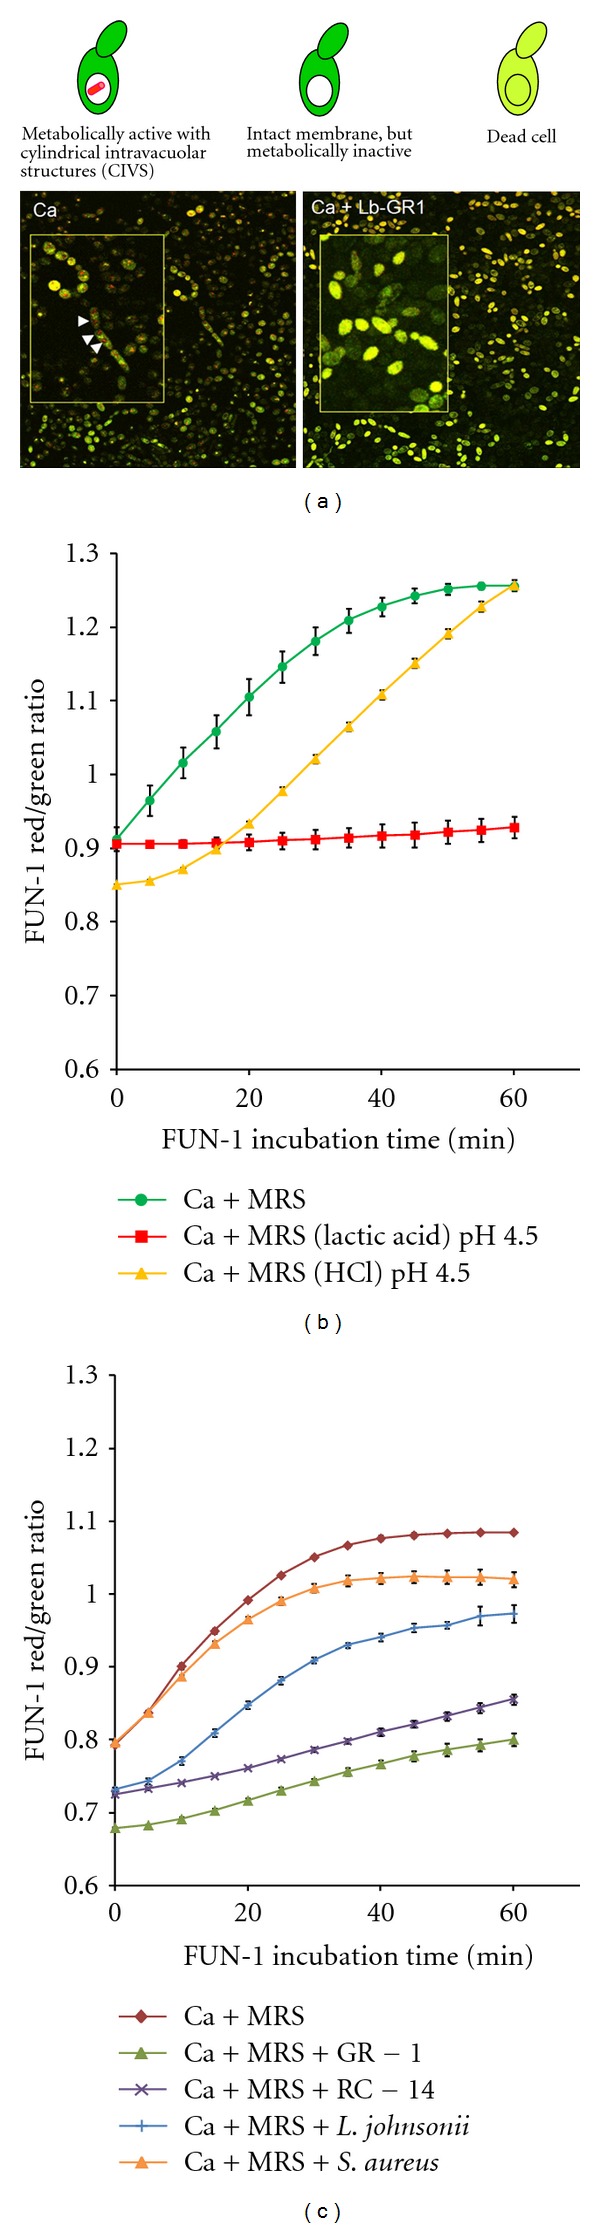
Viability assays of C. albicans cells following coculture with bacteria and exposure to lactic acid. (a) Microscopic viability assay: C. albicans cells were stained with the FUN 1 cell stain (Invitrogen) for viability after coculture with L. rhamnosus GR-1 (Ca + Lb-GR-1). A C. albicans culture without lactobacilli served as control (Ca). Cell images were obtained by confocal laser scanning microscopy. Results for the vital staining procedure are depicted above the images. White arrows in the zoomed insert image on the left indicate CIVS formation in metabolically active cells of the control culture. The presence of lactobacilli increases the number of metabolically inactive and dead cells (right image). (b) Fluorometric assay of C. albicans cells viability following 16 hr incubation in MRS, MRS (HCl) pH 4.5, and MRS (lactic acid) pH 4.5. Cell viability was measured by monitoring the conversion of FUN 1 to red fluorescent intravacuolar structures in a microplate assay. The red/green fluorescence ratio increases in the presence of viable, metabolically active cells, particularly within the first 30 min of the assay. Metabolically inactive cells show no increase of the red/green ratio. For assay details see Section 2. The figure shows the results of a representative experiment. Incubation of C. albicans cells in MRS at pH 4.5 in the presence of lactic acid appears to reduce cell viability much more than incubation in MRS that was adjusted to pH 4.5 using HCl. (c) Example of a fluorometric FUN 1 cell viability assay of C. albicans following coculture with L. rhamnosus GR-1, L. reuteri RC-14, L. johnsonii, or S. aureus. A C. albicans culture without bacteria served as control (Ca + MRS). GR-1 and RC-14 consistently caused the strongest reduction in C. albicans viability. All fluorometric experiments were conducted in triplicate. Error bars indicate standard deviations.
3.3. Transcriptional Profiling of C. albicans in Coculture with Lactobacilli
The 0.45 μm porous membrane was effective at separating the fungi from the lactobacilli cells (see Figure 5(a)). Using this approach, it was possible to isolate total fungal RNA without contaminating bacterial RNA. Similar to previous experiments, presence of lactobacilli in the culture reduced C. albicans growth as determined by OD600 nm measurements (Figure 5(b)). Despite physical separation of the microorganisms, the competition for nutrients and the presence of diffusible inhibiting substances (e.g., lactic acid) produced by the lactobacilli led to fungal growth retardation. Transcriptome analysis of C. albicans using custom-made Candida Affymetrix GeneChip expression arrays revealed that genes involved in lactic acid utilization were induced early in cocultures with lactobacilli in contrast to control cultures without the bacteria. Table 2 lists genes that were differentially expressed in at least three of the seven coculture experiments. Surprisingly, the lactate importer gene JEN1 in C. albicans [18] was not induced and remained at relatively low expression levels in all conditions tested. JEN1 is reportedly induced on lactate as the sole carbon source, but subject to glucose repression [18]. Thus, presence of glucose (MRS contains 2% glucose) might have affected the lactate transporter expression at least in the early stage cocultures. Interestingly, the related JEN2 gene encoding a dicarboxylic acid transport protein [19] was transiently induced in two experiments (data not shown). Whether increased acidification of the cytosol at later growth stages also suppressed the expression of the lactate/proton symporter gene JEN1 is unknown.
Figure 5.
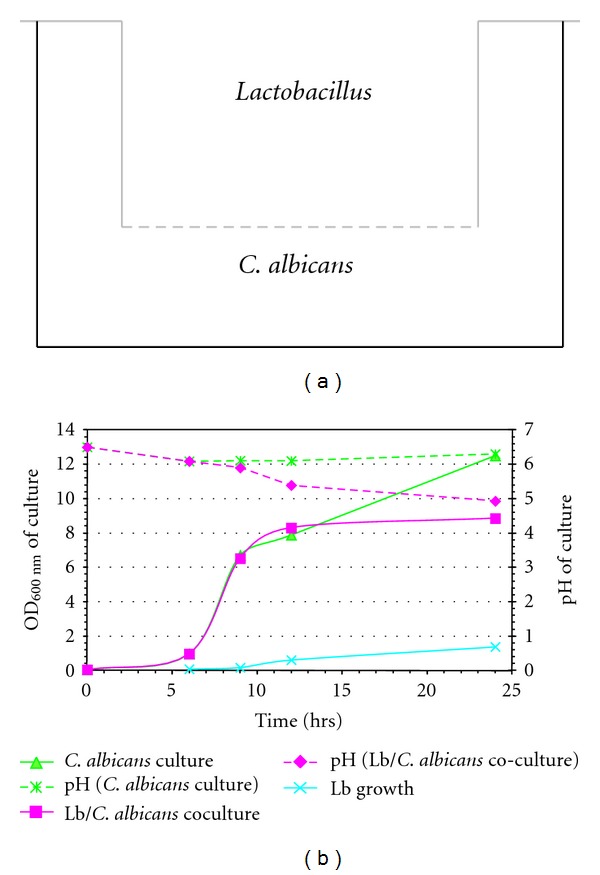
Lactobacillus-C. albicans cocultures for transcriptome analysis. The experimental setup employing a 0.45 μm membrane for separation of the bacterial and fungal cultures in 6-well tissue culture plates is represented schematically in (a). Results of a typical Lactobacillus-C. albicans coculture and C. albicans-only control experiment are shown in (b). Growth of C. albicans and Lactobacillus (Lb) in the respective compartments was determined by OD600 nm readings (left y-axis). The pH of the culture media is depicted in dashed lines using the right y-axis. For transcriptome analysis, total RNA was isolated from C. albicans cells harvested from cocultures and controls.
Table 2.
Differentially expressed C. albicans genes in cocultures with L. rhamnosus GR-1 or L. reuteri RC-14. Z values for genes with at least three observed incidences of significant differential regulation in the tested conditions are shown. Z-values ≥3 and ≤−3 were considered significant (see Section 2). Values followed by the symbol † indicate gene induction when compared to C. albicans cultures without addition of lactobacilli. Downregulation values are followed by symbol #. Differential gene expression data from coculture experiments with L. rhamnosus GR-1 (GR1_a, b, c, d, e) and L. reuteri RC-14 (RC14_a, b) are grouped according to the C. albicans growth phase (log phase and late log to early stationary phase). Genes are ordered in functional groupings adapted from gene ontology (GO) annotations shown in the Candida Genome Database (http://www.candidagenome.org/). Differentially expressed genes are also divided into upregulated genes (a), genes with mixed regulation (b), and downregulated genes (c). Genes followed by the symbol * are further discussed in the text.
(a) Upregulated C. albicans genes
| ORFa | Gene | Molecular functionb | Log phase cocultures | Late log to early stationary phase cocultures | |||||
|---|---|---|---|---|---|---|---|---|---|
| GR1_a | RC14_a | GR1_b | GR1_c | GR1_d | RC14_b | GR1_e | |||
| Amino acid metabolismc | |||||||||
| orf19.5610 | ARG3 | Ornithine carbamoyltransferase | 0.49 | 2.43 | −0.53 | 1.69 | 3.54† | 4.36† | 3.20† |
|
| |||||||||
| Carbohydrate metabolism | |||||||||
| orf19.3675 | GAL7 | Putative galactose-1-phosphate uridyl transferase | 0.69 | 2.12 | 1.55 | 6.12† | 3.40† | 4.11† | 0.47 |
| orf19.1788 | XKS1 | Putative xylulokinase | 0.39 | 2.26 | 0.37 | 3.24† | 2.91 | 4.33† | 3.06† |
|
| |||||||||
| Cell wall biosynthesis | |||||||||
| orf19.3688 | Putative chromatin DNA binding protein | 7.69† | 1.66 | 0.35 | 0.19 | 10.34† | 4.25† | −0.09 | |
| orf19.3674 | GAL102 | UDP-glucose 4,6-dehydratase with role in mannosylation of cell wall proteins | 0.11 | 1.70 | −0.06 | 3.63† | 4.48† | 4.75† | 0.21 |
|
| |||||||||
| Fatty acid metabolism | |||||||||
| orf19.5640 | PEX5 | Putative peroxisomal targeting receptor | 0.14 | −2.14 | 3.31† | 5.21† | 3.34† | 4.03† | 1.03 |
| orf19.5215 | TES15 | Putative acyl-CoA thioesterase | −0.91 | −0.76 | 1.91 | 3.58† | 5.17† | 5.66† | −2.00 |
|
| |||||||||
| Glycogen metabolism | |||||||||
| orf19.3302 | Putative type-1 protein phosphatase targeting subunit | −0.61 | −0.98 | 0.58 | 3.03† | 6.26† | 3.28† | 1.32 | |
|
| |||||||||
| Glycolysis | |||||||||
| orf19.6116 | GLK4 | Glucokinase | −0.85 | 0.48 | 1.25 | 0.82 | 4.13† | 3.05† | 6.62† |
|
| |||||||||
| Intracellular transport | |||||||||
| orf19.3233 | HSE1 | Putative SH3-domain-containing protein | −1.94 | −0.81 | 2.30 | 3.34† | 5.24† | 3.66† | −0.24 |
| orf19.7086 | Putative protein transporter | 0.54 | −1.18 | −1.10 | 1.35 | 4.74† | 4.15† | 3.27† | |
| orf19.3841 | Putative protein serine/threonine kinase | −2.91 | −0.82 | −0.68 | 4.07† | 4.94† | 4.92† | −1.58 | |
|
| |||||||||
| Oxidation/Reduction | |||||||||
| orf19.5805* | DLD1* | D-lactate dehydrogenase* | 1.34 | 0.72 | 4.57† | 3.63† | 6.23† | 5.90† | 8.57† |
| orf19.1048 | IFD6 | Aldo-keto reductase | −0.09 | 2.07 | 1.36 | −0.92 | 5.16† | 3.41† | 6.71† |
| orf19.742 | ALD6 | Putative aldehyde dehydrogenase | −1.27 | 0.96 | −0.19 | 4.46† | 4.77† | 5.36† | 3.16† |
| orf19.5288 | IFE2 | Alcohol dehydrogenase | 1.03 | −0.07 | −0.66 | 5.77† | 6.75† | 6.04† | 0.33 |
|
| |||||||||
| Protein catabolism | |||||||||
| orf19.1191 | Possible ubiquitin-protein ligase | 1.12 | −0.91 | 3.14† | 2.25 | 3.64† | 4.31† | −0.45 | |
| orf19.5752 | Possible ubiquitin-protein ligase | −1.59 | −0.66 | 0.17 | 4.35† | 3.16† | 3.29† | 2.38 | |
|
| |||||||||
| Repair | |||||||||
| orf19.1331 | HSM3 | Protein may be involved in DNA mismatch repair | −0.74 | −2.27 | −0.14 | 4.18† | 8.78† | 6.68† | 5.39† |
|
| |||||||||
| Respiration | |||||||||
| orf19.4551 | CTN1 | Predicted carnitine acetyl transferase | 1.21 | 1.97 | 0.08 | 11.85† | 3.64† | 7.52† | 2.61 |
|
| |||||||||
| RNA catabolism | |||||||||
| orf19.5614 | RNH1 | Putative ribonuclease H1 | −1.33 | 0.38 | −0.07 | 3.06† | 4.11† | 2.96 | 3.22† |
|
| |||||||||
| Signaling | |||||||||
| orf19.399 | Putative serine/threonine protein kinase | −2.21 | −2.59 | −0.10 | 4.08† | 4.88† | 4.44† | −0.22 | |
| orf19.5531 | CDC37 | Chaperone for Crk1 protein kinase | −0.45 | 0.95 | 0.80 | 2.13 | 5.46† | 3.19† | 6.05† |
|
| |||||||||
| Stress response | |||||||||
| orf19.882* | HSP78* | Heat-shock protein* | 0.00 | −1.35 | 0.06 | 4.21† | 4.52† | 5.81† | 4.66† |
| orf19.3861* | SIS1* | Putative Type II HSP40 co-chaperone* | −0.91 | −0.40 | 0.79 | 1.65 | 3.92† | 4.78† | 3.10† |
| orf19.5348* | TPS3* | Trehalose-phosphate synthase subunit* | 0.59 | −0.26 | −0.99 | 4.23† | 8.95† | 7.42† | 5.40† |
|
| |||||||||
| Transcriptional regulation | |||||||||
| orf19.3047 | SIP3 | Protein kinase-related protein | 1.23 | 0.77 | 0.66 | 3.62† | 3.69† | 4.84† | 4.52† |
| orf19.909 | STP4 | Putative transcription factor | −0.52 | −1.28 | 1.29 | 6.75† | 5.15† | 7.01† | 2.41 |
| orf19.3190 | HAL9 | Putative transcription factor involved in salt tolerance | 0.98 | 1.83 | 2.82 | 3.87† | 4.99† | 5.03† | −0.59 |
|
| |||||||||
| Translation | |||||||||
| orf19.154 | Possible 90S pre-ribosome complex protein | 9.04† | 1.52 | −0.03 | 4.19† | 3.22† | 2.77 | 0.90 | |
|
| |||||||||
| Transport | |||||||||
| orf19.5079* | CDR4* | ABC transporter* | 2.77 | 3.79† | −0.06 | 3.22† | 2.89 | 3.51† | 1.78 |
| orf19.4802 | FTH1 | Putative high affinity iron transporter (vacuolar) | −0.45 | 0.76 | 1.10 | 4.54† | 5.95† | 7.85† | −0.38 |
| orf19.3668 | HGT2 | Putative glucose transporter | 1.17 | 1.35 | 1.73 | 9.56† | 4.30† | 3.16† | −2.49 |
| orf19.5447 | HGT19 | Putative glucose/myo-inositol transporter | 2.51 | 3.11† | 2.55 | 4.67† | 2.95 | 5.05† | 5.41† |
| orf19.3526 | ITR1 | Inositol transporter | 1.82 | −0.20 | 1.69 | 3.52† | 5.21† | 5.25† | 2.91 |
| orf19.1979 | GIT1 | Putative glycerophosphoinositol permease | 0.97 | 6.75† | −1.94 | 3.73† | 5.82† | 8.01† | 1.64 |
| orf19.1027 | PDR16 | Phosphatidylinositol transfer protein | −0.47 | −1.63 | 0.61 | 2.19 | 3.61† | 4.23† | 3.05† |
| orf19.4737* | TPO3* | Possible polyamine transporter* | 0.08 | −0.02 | 3.65† | 4.30† | 4.59† | 7.16† | 3.48† |
| orf19.700* | SEO1* | Similar to permeases (↑weak acid stress)* | −0.79 | −1.34 | 4.50† | 4.90† | 2.88 | 5.02† | −0.14 |
|
| |||||||||
| Unknown | |||||||||
| orf19.2498 | Unknown | −2.12 | −1.08 | 0.29 | 3.03† | 3.05† | 3.99† | −0.55 | |
| orf19.5245 | Unknown | −0.36 | −1.74 | 1.59 | 0.84 | 5.03† | 5.24† | 4.78† | |
| orf19.6321 | PGA48 | Putative GPI-anchored protein of unknown function | −1.55 | −0.79 | 0.71 | −1.46 | 5.14† | 3.50† | 3.62† |
| orf19.5295 | Unknown | −0.76 | 1.02 | −2.03 | 5.83† | 3.06† | 3.51† | −1.02 | |
| orf19.3448 | Unknown | 1.02 | 0.86 | −0.59 | 5.89† | 2.51 | 3.32† | 3.52† | |
(b) C. albicans genes with mixed regulation
| ORFa | Gene | Molecular functionb | Log phase cocultures | Late log to early stationary phase cocultures | |||||
| GR1_a | RC14_a | GR1_b | GR1_c | GR1_d | RC14_b | GR1_e | |||
|
| |||||||||
| Amino acid metabolismc | |||||||||
| orf19.3974 | PUT2 | 1-Pyrroline-5-carboxylate dehydrogenase | −4.32# | −0.86 | −0.39 | 3.07† | −3.25# | −6.02# | −1.68 |
| orf19.105 | HAL22 | Put. phosphoadenosine-5′-phosphate phosphatase | −2.16 | −4.51# | 3.44† | 3.62† | −0.79 | 3.67† | −3.38# |
| orf19.5811 | MET1 | Putative uroporphyrin-3 C-methyltransferase | 0.37 | 0.59 | 0.67 | 4.93† | −1.93 | 3.53† | −4.15# |
|
| |||||||||
| Carbohydrate metabolism | |||||||||
| orf19.7481 | MDH1 | Malate dehydrogenase | −1.68 | −2.14 | 1.19 | 3.97† | −3.66# | −3.34# | −1.21 |
|
| |||||||||
| Cell morphogenesis | |||||||||
| orf19.4892 | TPK1 | Subunit of cAMP-dependent protein kinase (PKA) | 0.19 | 1.68 | −3.02# | −1.85 | 2.69 | 3.01† | −3.77# |
|
| |||||||||
| Cell wall assembly | |||||||||
| orf19.377 | PHR3 | Putative beta-1,3-glucanosyltransferase | −1.11 | 0.74 | 3.09† | 3.46† | 1.67 | 1.60 | −3.52# |
|
| |||||||||
| Cytoskeleton maintenance | |||||||||
| orf19.3505 | Similar to S. cerevisiae phosphoinositide binding protein Slm2 | −0.04 | −4.18# | −1.26 | 0.59 | 5.35† | 3.91† | 0.07 | |
|
| |||||||||
| Filamentous growth | |||||||||
| orf19.4246 | Similar to S. cerevisiae Ykr070w protein | −1.10 | −4.36# | 0.89 | 4.67† | 3.16† | 2.66 | 3.93† | |
| orf19.860 | BMT8 | Putative beta-mannosyltransferase | −4.31# | 1.93 | 3.88† | 1.90 | −3.35# | −2.13 | −0.42 |
|
| |||||||||
| Oxidation/reduction | |||||||||
| orf19.7323 | CBP1 | Corticosteroid binding protein | −1.74 | 3.42† | 0.83 | 0.26 | −3.66# | −3.27# | −1.81 |
| orf19.6139 | FRE7 | Putative ferric reductase | −1.25 | 0.17 | 4.56† | −2.56 | −3.14# | −4.12# | −0.42 |
| orf19.6531 | NUC2 | NADH-ubiquinone oxidoreductase | −2.95 | 0.14 | 3.33† | −2.10 | −3.89# | −4.12# | −1.28 |
|
| |||||||||
| pH response | |||||||||
| orf19.101 | RIM9 | Unknown, involved in cellular response to pH | −0.73 | −0.50 | −0.84 | 2.43 | 3.69† | 3.75† | −3.08# |
|
| |||||||||
| Stress response | |||||||||
| orf19.3707* | YHB1* | Nitric oxide dioxygenase* | −0.61 | −1.54 | 1.07 | 4.53† | 2.61 | 5.15† | −3.06# |
| orf19.6232* | NPR1* | Predicted serine/threonine protein kinase* | −3.75# | −1.63 | 4.49† | 3.98† | −0.21 | 1.51 | −0.30 |
|
| |||||||||
| Transcription | |||||||||
| orf19.2831 | RPC31 | Putative RNA polymerase III subunit C31 | −0.70 | 3.18† | 2.42 | −3.33# | −3.63# | −2.32 | −1.66 |
| orf19.5908 | TEC1 | TEA/ATTS transcription factor | 2.31 | 2.20 | 1.74 | 6.57† | 1.81 | 4.84† | −4.97# |
| orf19.5992 | WOR2 | Transcriptional regulator of white-opaque switching | −1.25 | −3.19# | −0.42 | 6.58† | 6.05† | 8.17† | −3.00# |
|
| |||||||||
| Transport | |||||||||
| orf19.6578 | Predicted membrane transporter | 0.28 | −3.37# | −0.56 | 4.20† | 6.39† | 3.27† | 0.01 | |
|
| |||||||||
| tRNA aminoacylation | |||||||||
| orf19.5239 | similarity to alanyl-tRNA synthases | 0.30 | −4.73# | −3.55# | 0.74 | 0.58 | 3.76† | 0.69 | |
|
| |||||||||
| Unknown | |||||||||
| orf19.925 | −1.03 | −1.59 | 3.42† | −0.81 | −4.07# | −3.38# | 0.11 | ||
| orf19.599 | 2.89 | 4.04† | 4.02† | −3.40# | 0.51 | 0.33 | 2.02 | ||
| orf19.4765 | PGA6 | Putative GPI-anchored cell wall adhesin-like protein | −0.67 | 5.78† | −3.74# | −0.92 | −0.13 | −4.12# | 2.61 |
| orf19.6342 | 2.06 | 4.26† | −3.63# | −3.94# | 1.70 | 2.11 | 1.27 | ||
(c) Downregulated C. albicans genes
| ORFa | Gene | Molecular functionb | Log phase cocultures | Late log to early stationary phase cocultures | |||||
| GR1_a | RC14_a | GR1_b | GR1_c | GR1_d | RC14_b | GR1_e | |||
|
| |||||||||
| Adhesionc | |||||||||
| orf19.2122* | ALS12* | ALS family protein; role in adhesion, biofilm formation, germ tube induction* | −1.84 | −3.38# | 0.64 | 1.51 | −3.68# | −0.73 | −3.71# |
|
| |||||||||
| Amino acid metabolism | |||||||||
| orf19.646 | GLN1 | Putative glutamate synthase | −3.16# | −0.50 | 0.45 | 1.56 | −1.62 | −3.20# | −3.08# |
| orf19.3846 | LYS4 | Homoaconitase | −2.68 | −1.54 | 0.63 | −4.04# | −5.51# | −4.80# | −0.52 |
| orf19.2360 | URA2 | Putative bifunctional carbamoylphosphate synthetase-aspartate transcarbamylase | −0.58 | −5.46# | −0.75 | −1.48 | −3.62# | −4.30# | −0.13 |
| orf19.6257 | GLT1 | Putative glutamate synthase | −0.80 | −3.46# | 0.19 | −3.07# | −5.30# | −3.61# | 0.29 |
|
| |||||||||
| Cell wall organization | |||||||||
| orf19.386 | SAM4 | Putative S-adenosylmethionine-homocysteine methyltransferase | −1.87 | −1.60 | 0.64 | −3.11# | −3.40# | −4.50# | −2.44 |
| orf19.3829* | PHR1* | Glycosidase of cell surface* | −4.84# | −4.20# | −3.95# | −7.74# | −3.17# | −6.66# | −5.39# |
| orf19.5171 | PMT1 | Protein mannosyltransferase, | −0.75 | −0.20 | 0.42 | −4.18# | −3.67# | −4.02# | −0.86 |
|
| |||||||||
| Cytoskeleton organization | |||||||||
| orf19.2286 | Putative deoxyhypusine hydroxylase | −2.97 | 0.36 | −1.06 | −1.51 | −3.07# | −3.08# | −3.49# | |
|
| |||||||||
| DNA replication | |||||||||
| orf19.5183* | POL3* | Large subunit of DNA polymerase III* | −2.60 | −4.03# | 0.98 | −0.12 | −4.07# | −3.39# | −2.58 |
| orf19.6078 | POL93 | Putative gypsy-like reverse transcriptase | −3.48# | −0.48 | −0.43 | −6.24# | −1.66 | −4.44# | 0.28 |
| orf19.2885* | PRI2* | Putative DNA primase* | 0.27 | −3.17# | −3.27# | −3.20# | 0.35 | −2.05 | 0.31 |
| orf19.3322 | DUT1 | dUTP pyrophosphatase | −3.24# | −4.14# | −0.28 | −2.23 | −3.38# | −4.36# | −0.44 |
|
| |||||||||
| Ergosterol biosynthesis | |||||||||
| orf19.1631* | ERG6* | Delta(24)-sterol C-methyltransferase* | −0.67 | 0.20 | −3.61# | −2.84 | −6.05# | −4.09# | −1.34 |
| orf19.2016* | Possible role in ergosterol biosynthesis* | −2.26 | 0.16 | 2.13 | −3.22# | −3.69# | −3.14# | 1.05 | |
| orf19.922* | ERG11* | Lanosterol 14-alpha-demethylase* | −1.29 | −0.44 | −0.73 | −5.19# | −4.14# | −5.50# | −2.26 |
|
| |||||||||
| Filamentous growth | |||||||||
| orf19.815 | DCK1 | Putative guanine nucleotide exchange factor required for embedded filamentous growth | −1.76 | −4.90# | −0.07 | 0.47 | −4.22# | −1.11 | −4.89# |
| orf19.3669 | SHA3 | Putative serine/threonine kinase | −1.04 | −2.35 | −0.77 | −3.24# | −3.27# | −1.55 | −3.89# |
| orf19.3575* | CDC19* | Putative pyruvate kinase; mutation affects filamentation* | −2.04 | −0.07 | 0.20 | −3.09# | −3.12# | −3.97# | 0.49 |
|
| |||||||||
| Gluconeogenesis | |||||||||
| orf19.7514* | PCK1* | Phosphoenolpyruvate carboxykinase* | −0.22 | −3.90# | 2.82 | 1.21 | −3.89# | −3.66# | −2.91 |
|
| |||||||||
| Glutathione biosynthetic process | |||||||||
| orf19.5059 | GCS1 | Gamma-glutamylcysteine synthetase | −2.60 | −3.06# | −3.10# | 1.00 | −2.27 | −0.52 | −3.85# |
|
| |||||||||
| Intracellular transport | |||||||||
| orf19.4805 | Putative membrane protein | −1.19 | 1.35 | −0.56 | −3.69# | −3.87# | −3.64# | −2.47 | |
|
| |||||||||
| Lipoate biosynthetic process | |||||||||
| orf19.819 | Possible role in lipoate biosynthesis | −1.06 | −3.54# | 1.91 | 0.27 | −4.15# | −3.69# | −0.94 | |
|
| |||||||||
| NAD biosynthetic process | |||||||||
| orf19.1460 | Putative glutamine-dependent NAD synthetase | −2.41 | −2.49 | 0.05 | −0.79 | −3.60# | −3.23# | −3.51# | |
|
| |||||||||
| Oxidation/Reduction | |||||||||
| orf19.5517 | Similar to alcohol dehydrogenases | −2.94 | −0.19 | −0.85 | −4.83# | −6.56# | −8.21# | −0.07 | |
| orf19.2525 | LYS12 | Mitochondrial homoisocitrate dehydrogenase | −2.17 | 1.04 | −1.19 | −5.01# | −5.72# | −7.22# | 0.65 |
|
| |||||||||
| RNA processing | |||||||||
| orf19.7215 | Ortholog(s) have snoRNA binding activity | −2.83 | −0.06 | −0.38 | −0.16 | −5.20# | −4.12# | −3.23# | |
| orf19.3159 | UTP20 | Similar to S. cerevisiae nucleolar protein Utp10p | −1.27 | −0.48 | −0.20 | −2.29 | −5.60# | −3.26# | −3.15# |
|
| |||||||||
| Signaling | |||||||||
| orf19.3453 | Possible role in signal transduction | −1.58 | −0.21 | 0.89 | −4.27# | −3.25# | −4.07# | 0.09 | |
| orf19.6906* | ASC1* | Protein described as part of 40S ribosomal subunit* | −3.30# | −2.92 | −1.91 | 0.37 | −3.74# | −4.70# | −2.62 |
|
| |||||||||
| TCA cycle | |||||||||
| orf19.6632 | ACO2 | Aconitate hydratase 2 | −1.14 | −0.25 | 0.55 | −3.34# | −6.53# | −4.39# | 0.05 |
|
| |||||||||
| Translation | |||||||||
| orf19.6253* | RPS23A* | Putative ribosomal protein* | −1.19 | −3.68# | −0.63 | −3.51# | −2.82 | −2.86 | −3.17# |
| orf19.4152* | CEF3* | Translation elongation factor 3* | −2.13 | −3.35# | 0.54 | 0.12 | −3.18# | −1.03 | −3.86# |
|
| |||||||||
| Transport | |||||||||
| orf19.4599 | PHO89 | Putative phosphate permease | 0.73 | −0.06 | −2.63 | −11.05# | −6.49# | −5.80# | −6.50# |
| orf19.5170 | ENA21 | Possible sodium transporter sodium transporters | −0.77 | −2.46 | −1.35 | −3.59# | −4.30# | −5.16# | −1.38 |
| orf19.6000* | CDR1* | ABC transporter involved in multidrug resistance* | −0.09 | −0.21 | −2.97 | −1.76 | −5.00# | −5.04# | −3.82# |
|
| |||||||||
| Unknown | |||||||||
| orf19.7413 | MMS21-SMC5-SMC6 complex component | −3.01# | −3.22# | 1.62 | −3.10# | −1.53 | −1.75 | 0.55 | |
| orf19.1549 | Unknown | −0.42 | −1.89 | −3.17# | −3.96# | −3.83# | −2.95 | −1.10 | |
| orf19.4651 | PGA53 | Putative GPI-anchored protein | −0.84 | −1.33 | −1.16 | −3.73# | −3.33# | −3.75# | 0.35 |
| orf19.5799 | Unknown | 0.24 | −0.13 | −1.23 | −3.54# | −4.95# | −5.27# | −1.11 | |
| orf19.915 | Unknown | −0.56 | 1.05 | −0.59 | 0.19 | −3.60# | −3.15# | −3.21# | |
| orf19.5760 | IHD1 | Putative GPI-anchored protein | −2.64 | −5.84# | −0.54 | −5.21# | −3.27# | −5.36# | −5.36# |
| orf19.3548 | Unknown | −3.48# | −1.88 | −0.44 | 1.89 | −3.13# | −3.08# | −0.96 | |
aFor further information on the open reading frames (ORFs) see the Candida Genome Database (CGD: [20]) (http://www.candidagenome.org/).
bInformation on the molecular function is abridged. More information is available at the CGD website.
cFunctional groupings derived from Biological Process GO annotations. Due to space restrictions, the groupings are simplified. Individual genes can be involved in multiple biological processes.
The upregulation of the L-lactate cytochrome-c oxidoreductase gene CYB2 (orf19.5000) in two experiments in conjunction with the continued induction of the putative D-lactate dehydrogenase gene DLD1 (orf19.5805, see Table 2(a)) indicated that the fungal cells indeed metabolized lactate despite the lack of strong induction of lactate transporter genes. It remains to be determined whether additional transport systems facilitate the transport of lactic acid or whether undissociated lactic acid enters the fungal cell by simple diffusion. Transcriptional profiling of the C. albicans cells during coculture with the probiotic lactobacilli also indicated that the fungal cells came under increased stress. The increased expression of stress-related genes (e.g., SIS1, TPS3, HSP78, TPO3, SEO1) in progressed cocultures might signify that the fungal cells were challenged by acid production of the lactobacilli and the concomitant lowering of the pH.
The mixed expression profile of the stress-related genes YHB1 and NPR1 (Table 2(b)) might indicate transient induction of components of the stress response, however further studies are necessary for detailed analysis of stress responses induced by the lactobacilli. Interesting aspects of the interaction of the microorganisms can also be gleaned from the list of downregulated genes (see Table 2(c)): For example, ergosterol biosynthetic genes (ERG6, ERG11, orf19.2016) were repressed. It remains to be elucidated, whether this repression was caused simply by growth retardation or specific interactions with products of the lactobacilli. Several important antifungals target the ergosterol biosynthetic pathway in fungi. The ERG11 gene product lanosterol 14-alpha-demethylase is the target enzyme for fluconazole and other azoles [21–23]. The CDR1 gene encoding an important drug efflux pump involved in fluconazole resistance [21, 24, 25] appears also on the list of genes with significantly lower expression (Table 2(c)). In contrast, a related ABC transporter gene, CDR4, showed increased expression in the present study. CDR4 is not involved in fluconazole resistance, but appears to be induced in the core stress response of C. albicans [26, 27]. Thus, downregulation of the target enzyme Erg11p and the drug efflux pump Cdr1p could render the fungal cells more susceptible to the antifungal drug. These findings are especially interesting in light of recent results in a randomized, double-blind and placebo-controlled trial on the effect of L. rhamnosus GR-1 and L. reuteri RC-14 application in fluconazole-treated women with vulvovaginal candidiasis [7]. The probiotics significantly improved the outcome of the treatment.
Production of lactic acid and other short-chain fatty acids by the lactobacilli leads to acidification of the surrounding microenvironment such as the vaginal ecosystem or an in vitro culture vessel. Low pH favors the yeast form of C. albicans and inhibits the invasive hyphal form of these fungi [28, 29]. The transcriptome analysis in this study confirmed at the gene expression level that the fungi were in an increasingly acidic environment. For example, acidic culture conditions were indicated in all cocultures by the observed repression of the cell wall beta-(1,3)-glucanosyltransferase encoded by the PHR1 gene. This pH-responsive gene is only induced under high pH (in vitro pH > 5.5) or conditions supporting hyphal growth of C. albicans [30, 31]. Interestingly, phr1/phr1 null mutants of C. albicans show defects in adhesion to abiotic and epithelial surfaces [32] indicating that repression of this gene could affect biofilm formation of C. albicans. Probiotic lactobacilli such as L. rhamnosus GR-1 are able to suppress biofilm formation of C. albicans on abiotic surfaces [33]. This is presumably achieved by combining growth inhibition and repression of genes involved in biofilm formation (e.g., PHR1, ALS12; see Table 2(c)).
The list of downregulated genes in the cocultures experiments also reflects the growth inhibitory effects of the lactobacilli. Key genes involved in DNA replication (POL3, PRI2), translation (CEF3, RPS23A, ASC1), glycolysis (CDC19), and gluconeogenesis (PCK1) are expressed at lower levels. Overall, the exploratory C. albicans transcriptome analysis presented in this study has revealed first indications on the molecular mechanisms of probiotic interference instigated by L. rhamnosus GR-1 and L. reuteri RC-14 towards the opportunistic fungal pathogen C. albicans. Elucidation of the specific inhibitory mechanisms employed by the probiotic strains will require further analysis. To this end, the development of continuous coculture systems mimicking the vaginal environment as close as possible in conjunction with genomic and proteomic analyses will further improve our understanding of the molecular basis of probiotic effects.
4. Conclusions
The results of the present study confirm that the probiotic strains L. rhamnosus GR-1 and L. reuteri RC-14 are able to suppress the growth of VVC-causing C. albicans and can even kill the fungus. The probiotics were effective at low pH levels, similar to those found in a healthy vaginal environment. The transcriptome analysis elucidated some of the molecular mechanisms of probiotic interference.
Acknowledgments
This paper was supported partially by funds from the California HIV/AIDS Research Program (former University-wide AIDS Research Program) of the University of California, Grant ID04-SF-030 to G. Köhler. Additional funding to G. Köhler was provided by the Oklahoma State University Center for Health Sciences. For annotation information on Candida genes, the authors are grateful to the Candida Genome Database (CGD) which is funded by the National Institute of Dental & Craniofacial Research at the US National Institutes of Health. Funding of the Reid lab was provided by NSERC. They also would like to thank R. Tom Glass and Jay Bullard, OSU Center for Health Sciences, for providing the S. aureus strain.
References
- 1.Achkar JM, Fries BC. Candida infections of the genitourinary tract. Clinical Microbiology Reviews. 2010;23(2):253–273. doi: 10.1128/CMR.00076-09. [DOI] [PMC free article] [PubMed] [Google Scholar]
- 2.Sobel JD. Vulvovaginal candidosis. Lancet. 2007;369(9577):1961–1971. doi: 10.1016/S0140-6736(07)60917-9. [DOI] [PubMed] [Google Scholar]
- 3.Sobel JD, Faro S, Force RW, et al. Vulvovaginal candidiasis: epidemiologic, diagnostic, and therapeutic considerations. American Journal of Obstetrics and Gynecology. 1998;178(2):203–211. doi: 10.1016/s0002-9378(98)80001-x. [DOI] [PubMed] [Google Scholar]
- 4.Sobel JD. Current trends and challenges in candidiasis. Oncology. 2004;18(14):7–8. [PubMed] [Google Scholar]
- 5.Anderson MR, Klink K, Cohrssen A. Evaluation of vaginal complaints. Journal of the American Medical Association. 2004;291(11):1368–1379. doi: 10.1001/jama.291.11.1368. [DOI] [PubMed] [Google Scholar]
- 6.Foxman B, Barlow R, D’Arcy H, Gillespie B, Sobel JD. Candida vaginitis: self-reported incidence and associated costs. Sexually Transmitted Diseases. 2000;27(4):230–235. doi: 10.1097/00007435-200004000-00009. [DOI] [PubMed] [Google Scholar]
- 7.Martinez RCR, Franceschini SA, Patta MC, et al. Improved treatment of vulvovaginal candidiasis with fluconazole plus probiotic Lactobacillus rhamnosus GR-1 and Lactobacillus reuteri RC-14. Letters in Applied Microbiology. 2009;48(3):269–274. doi: 10.1111/j.1472-765X.2008.02477.x. [DOI] [PubMed] [Google Scholar]
- 8.Martinez RCR, Seney SL, Summers KL, Nomizo A, De Martinis ECP, Reid G. Effect of Lactobacillus rhamnosus GR-1 and Lactobacillus reuteri RC-14 on the ability of Candida albicans to infect cells and induce inflammation. Microbiology and Immunology. 2009;53(9):487–495. doi: 10.1111/j.1348-0421.2009.00154.x. [DOI] [PubMed] [Google Scholar]
- 9.Gillum AM, Tsay EYH, Kirsch DR. Isolation of the Candida albicans gene for orotidine-5’-phosphate decarboxylase by complementation of S. cerevisiae ura3 and E. colipyrF mutations. Molecular and General Genetics. 1984;198(1):179–182. doi: 10.1007/BF00328721. [DOI] [PubMed] [Google Scholar]
- 10.Reid G, Charbonneau D, Erb J, et al. Oral use of Lactobacillus rhamnosus GR-1 and L. fermentum RC-14 significantly alters vaginal flora: randomized, placebo-controlled trial in 64 healthy women. FEMS Immunology and Medical Microbiology. 2003;35(2):131–134. doi: 10.1016/S0928-8244(02)00465-0. [DOI] [PubMed] [Google Scholar]
- 11.Reid G, Cook RL, Bruce AW. Examination of strains of lactobacilli for properties that may influence bacterial interference in the urinary tract. Journal of Urology. 1987;138(2):330–335. doi: 10.1016/s0022-5347(17)43137-5. [DOI] [PubMed] [Google Scholar]
- 12.Lan CY, Newport G, Murillo LA, et al. Metabolic specialization associated with phenotypic switching in Candida albicans. Proceedings of the National Academy of Sciences of the United States of America. 2002;99(23):14907–14912. doi: 10.1073/pnas.232566499. [DOI] [PMC free article] [PubMed] [Google Scholar]
- 13.Colantuoni C, Henry G, Zeger S, Pevsner J. SNOMAD (Standardization and Normalization of MicroArray Data): web-accessible gene expression data analysis. Bioinformatics. 2002;18(11):1540–1541. doi: 10.1093/bioinformatics/18.11.1540. [DOI] [PubMed] [Google Scholar]
- 14.Eisen MB, Spellman PT, Brown PO, Botstein D. Cluster analysis and display of genome-wide expression patterns. Proceedings of the National Academy of Sciences of the United States of America. 1998;95(25):14863–14868. doi: 10.1073/pnas.95.25.14863. [DOI] [PMC free article] [PubMed] [Google Scholar]
- 15.Fuchs S, Pané-Farré J, Kohler C, Hecker M, Engelmann S. Anaerobic gene expression in Staphylococcus aureus. Journal of Bacteriology. 2007;189(11):4275–4289. doi: 10.1128/JB.00081-07. [DOI] [PMC free article] [PubMed] [Google Scholar]
- 16.Samaranayake LP, Geddes DAM, Weetman DA, MacFarlane TW. Growth and acid production of Candida albicans in carbohydrate supplemented media. Microbios. 1983;37(148):105–115. [PubMed] [Google Scholar]
- 17.Samaranayake LP, Hughes A, Weetman DA, MacFarlane TW. Growth and acid production of Candida species in human saliva supplemented with glucose. Journal of Oral Pathology. 1986;15(5):251–254. doi: 10.1111/j.1600-0714.1986.tb00617.x. [DOI] [PubMed] [Google Scholar]
- 18.Soares-Silva I, Paiva S, Kötter P, Entian KD, Casal M. The disruption of JEN1 from Candida albicans impairs the transport of lactate. Molecular Membrane Biology. 2004;21(6):403–411. doi: 10.1080/09687860400011373. [DOI] [PubMed] [Google Scholar]
- 19.Vieira N, Casal M, Johansson B, MacCallum DM, Brown AJP, Paiva S. Functional specialization and differential regulation of short-chain carboxylic acid transporters in the pathogen Candida albicans. Molecular Microbiology. 2010;75(6):1337–1354. doi: 10.1111/j.1365-2958.2009.07003.x. [DOI] [PMC free article] [PubMed] [Google Scholar]
- 20.Skrzypek MS, Arnaud MB, Costanzo MC, et al. New tools at the Candida genome database: biochemical pathways and full-text literature search. Nucleic Acids Research. 2009;38(1):D428–D432. doi: 10.1093/nar/gkp836. [DOI] [PMC free article] [PubMed] [Google Scholar]
- 21.Marr KA, Lyons CN, Rustad T, Bowden RA, White TC. Rapid, transient fluconazole resistance in Candida albicans is associated with increased mRNA levels of CDR. Antimicrobial Agents and Chemotherapy. 1998;42(10):2584–2589. doi: 10.1128/aac.42.10.2584. [DOI] [PMC free article] [PubMed] [Google Scholar]
- 22.White TC. Increased mRNA levels of ERG16, CDR, and MDR1 correlate, with increases in azole resistance in Candida albicans isolates from a patient infected with human immunodeficiency virus. Antimicrobial Agents and Chemotherapy. 1997;41(7):1482–1487. doi: 10.1128/aac.41.7.1482. [DOI] [PMC free article] [PubMed] [Google Scholar]
- 23.White TC, Holleman S, Dy F, Mirels LF, Stevens DA. Resistance mechanisms in clinical isolates of Candida albicans. Antimicrobial Agents and Chemotherapy. 2002;46(6):1704–1713. doi: 10.1128/AAC.46.6.1704-1713.2002. [DOI] [PMC free article] [PubMed] [Google Scholar]
- 24.Sanglard D, Kuchler K, Ischer F, Pagani JL, Monod M, Bille J. Mechanisms of resistance to azole antifungal agents in Candida albicans isolates from AIDS patients involve specific multidrug transporters. Antimicrobial Agents and Chemotherapy. 1995;39(11):2378–2386. doi: 10.1128/aac.39.11.2378. [DOI] [PMC free article] [PubMed] [Google Scholar]
- 25.Prasad R, De Wergifosse P, Goffeau A, Balzi E. Molecular cloning and characterization of a novel gene of Candida albicans, CDR1, conferring multiple resistance to drugs and antifungals. Current Genetics. 1995;27(4):320–329. doi: 10.1007/BF00352101. [DOI] [PubMed] [Google Scholar]
- 26.Enjalbert B, Smith DA, Cornell MJ, et al. Role of the Hog1 stress-activated protein kinase in the global transcriptional response to stress in the fungal pathogen Candida albicans. Molecular Biology of the Cell. 2006;17(2):1018–1032. doi: 10.1091/mbc.E05-06-0501. [DOI] [PMC free article] [PubMed] [Google Scholar]
- 27.Franz R, Michel S, Morschhäuser J. A fourth gene from the Candida albicans CDR family of ABC transporters. Gene. 1998;220(1-2):91–98. doi: 10.1016/s0378-1119(98)00412-0. [DOI] [PubMed] [Google Scholar]
- 28.Han T-L, Cannon RD, Villas-Bôas SG. The metabolic basis of Candida albicans morphogenesis and quorum sensing. Fungal Genetics and Biology. 2011;48(8):747–763. doi: 10.1016/j.fgb.2011.04.002. [DOI] [PubMed] [Google Scholar]
- 29.Lee KL, Buckley HR, Campbell CC. An amino acid liquid synthetic medium for the development of mycelial and yeast forms of Candida albicans. Sabouraudia Journal of Medical and Veterinary Mycology. 1975;13(2):148–153. doi: 10.1080/00362177585190271. [DOI] [PubMed] [Google Scholar]
- 30.Saporito-Irwin SM, Birse CE, Sypherd PS, Fonzi WA. PHR1, a pH-regulated gene of Candida albicans, is required for morphogenesis. Molecular and Cellular Biology. 1995;15(2):601–613. doi: 10.1128/mcb.15.2.601. [DOI] [PMC free article] [PubMed] [Google Scholar]
- 31.De Bernardis F, Mühlschlegel FA, Cassone A, Fonzi WA. The pH of the host niche controls gene expression in and virulence of Candida albicans. Infection and Immunity. 1998;66(7):3317–3325. doi: 10.1128/iai.66.7.3317-3325.1998. [DOI] [PMC free article] [PubMed] [Google Scholar]
- 32.Calderon J, Zavrel M, Ragni E, Fonzi WA, Rupp S, Popolo L. PHR1, a pH-regulated gene of Candida albicans encoding a glucan-remodelling enzyme, is required for adhesion and invasion. Microbiology. 2010;156(8):2484–2494. doi: 10.1099/mic.0.038000-0. [DOI] [PubMed] [Google Scholar]
- 33.Reid G, Kim SO, Köhler GA. Selecting, testing and understanding probiotic microorganisms. FEMS Immunology and Medical Microbiology. 2006;46(2):149–157. doi: 10.1111/j.1574-695X.2005.00026.x. [DOI] [PubMed] [Google Scholar]