Abstract
Background
Measurement scales seeking to quantify latent traits like attitudes, are often developed using traditional psychometric approaches. Application of the Rasch unidimensional measurement model may complement or replace these techniques, as the model can be used to construct scales and check their psychometric properties. If data fit the model, then a scale with invariant measurement properties, including interval-level scores, will have been developed.
Aims
This paper highlights the unique properties of the Rasch model. Items developed to measure adolescent attitudes towards abortion are used to exemplify the process.
Method
Ten attitude and intention items relating to abortion were answered by 406 adolescents aged 12 to 19 years, as part of the “Teen Relationships Study”. The sampling framework captured a range of sexual and pregnancy experiences. Items were assessed for fit to the Rasch model including checks for Differential Item Functioning (DIF) by gender, sexual experience or pregnancy experience.
Results
Rasch analysis of the original dataset initially demonstrated that some items did not fit the model. Rescoring of one item (B5) and removal of another (L31) resulted in fit, as shown by a non-significant item-trait interaction total chi-square and a mean log residual fit statistic for items of -0.05 (SD=1.43). No DIF existed for the revised scale. However, items did not distinguish as well amongst persons with the most intense attitudes as they did for other persons. A person separation index of 0.82 indicated good reliability.
Conclusion
Application of the Rasch model produced a valid and reliable scale measuring adolescent attitudes towards abortion, with stable measurement properties. The Rasch process provided an extensive range of diagnostic information concerning item and person fit, enabling changes to be made to scale items. This example shows the value of the Rasch model in developing scales for both social science and health disciplines.
Keywords: Rasch unidimensional measurement model, adolescent, abortion, attitudes, attitude scale
What this study adds:
Whilst many recent studies have utilised the Rasch unidimensional measurement model, this research is a unique opportunity to apply the technique to attitudinal data in the domain of adolescent sexual health.
Provision of a valid and reliable unidimensional scale to measure adolescent attitudes towards abortion with invariant, interval-level scores.
Accurate assessment of attitude scores will greatly benefit the development and administration of sexual health interventions for adolescents.
Background
Social science researchers often utilise questionnaires or scales to measure latent traits such as quality of life, anxiety levels or maths ability. Such scales consist of a collection of questions or items, where item responses are scored and summed to yield a final scale score.
Scale scores can be ranked according to the level of measurement.1 Traditionally, social research will generate nominal or ordinal scores, which are considered less precise measures than the interval and ratio scores used by the physical sciences. Scores will also be influenced by the sample used to construct the scale, the subsequent population/s to whom the scale is administered, and the items or persons that are used when making comparisons.2 Recently these traditional approaches have been complemented, and in some instances replaced, by application of the Rasch unidimensional measurement model.3-6
The Rasch unidimensional measurement model,7 a robust model for the objective measurement of latent traits, addresses weaknesses in traditional approaches because it is based on principles of fundamental measurement – the only measurement model in the social sciences to do so. For this reason it was chosen as the model for this study; to establish the measurement properties of a scale assessing adolescent attitudes towards abortion.
When fundamental measurement occurs, invariant comparisons of items and persons can be made in terms of a constant unit.8 Fundamental measurement is taken for granted in the physical sciences, whereas social scientists have been cautioned against treating raw scores and the summation of such scores as measures of a construct without first checking they conform to these fundamental principles.9,10 Raw scores for both items and persons are transformed into measures (known as locations) using a logistic mathematical function derived by the Danish mathematician Georg Rasch.7
Comparison of different techniques
The measurement paradigm on which the Rasch model is based differs from alternative theoretical paradigms that researchers may use to construct and scale scores. The advantages of the Rasch model over traditional psychometric methods has been stated previously.11,12
Most commonly, researchers will apply the Classical Test Theory (CTT) approach, whereby the strength of the attribute (or ability) is defined by an observed score, derived through summation of a true score and a measurement error term.13 Alternatively, Item Response Theory (IRT) may be applied, whereby trait levels (or the probability of a correct response) are calculated as a mathematical function of person and item parameters.14
The Rasch model also uses person and item parameters to determine the probability of an item score. However, whilst IRT models seek to fit the response model to the data, the Rasch model operates in the reverse direction by requiring the data to fit the model. Application of the Rasch model to a set of data produces a range of diagnostic information which may be used to determine how well items work to measure traits.13,15
In essence, Rasch analysis is a statistical technique that enables questionnaires or scales to be modified, with items rescored or removed, so that the instrument better measures the trait, attitude or ability under consideration. This is in contrast to trying to change the model of the trait, attitude or ability to fit the data based on the original questionnaire.
The Rasch model is used to help establish the internal consistency and reliability of a set of items. Estimates of person locations are independent of which items are used for comparisons. Likewise, estimates of item locations are independent of which persons are used for comparisons. The model also requires invariance in the unit of measurement, and it is the production of these constant units of measurement that result in equal-interval scale scores for persons. These scores (locations) can then be used in standard statistical analyses.
The Rasch model uses fit statistics and graphical inspection to indicate whether a set of items can be considered to comprise a unidimensional measurement scale with equal-interval level properties, and whether scale scores remain invariant across different groups. Invariance is the core measurement principle on which the model rests, with the analysis seeking to identify anomalies in the data which may undermine such invariance of measurement. Anomalies can lead to a better understanding of the property being measured and the task is to work towards a better fit of data to the model's requirements, until the match is sufficient to provide invariant measures.9 This may be achieved by the deletion or modification of items, the development of new items; and in some instances the deletion of specific persons or the measurement of further groups of persons.
The Rasch unidimensional measurement model
The Rasch model is essentially a probabilistic version of the Guttman scale.16 Figure 1 illustrates the response structure of an item according to both models. The red line in Figure 1 illustrates the ideal Guttman pattern. The Guttman scale assumes that if a person has an ability equal to (the position * on the x axis) or greater than the difficulty of the test item, the probability of getting an affirmative response is 100%. Those having ability less than the difficulty of the item have 0% probability.
Figure 1: The response structure of a single dichotomous (yes/no) item under Guttman and Rasch principles.
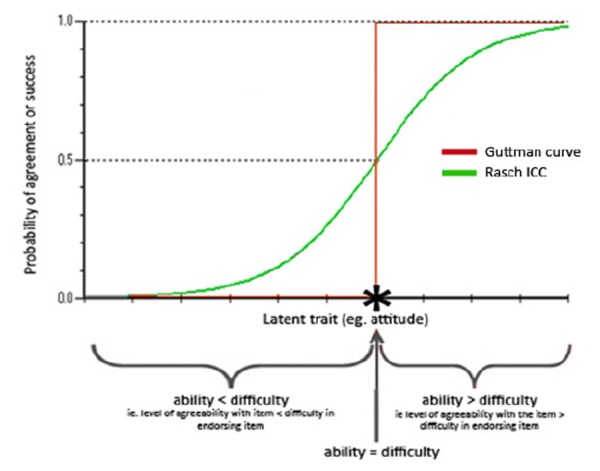
In contrast, according to the Rasch model (illustrated by the green curve in Figure 1) if the difficulty of the item and the ability of the respondent are equal (at *) the person has only a 50% probability of responding affirmatively. There is a gradient of probability on both sides; falling as ability decreases and increasing as ability increases. The green curve in Figure 1 is termed an Item Characteristic Curve (ICC).
When the Rasch model is applied to ordered response data, like attitudes, where successively higher scores indicate increasing levels of agreement with a particular statement or item, person ability represents how strongly respondents support the attitude item and item difficulty represents how easy the item is to endorse.
Ordered response data also introduces the probability of a response being made in any one response category (e.g. the probability of selecting strongly agree, agree, disagree or strongly disagree). In this instance, in addition to the ICC, a Category Characteristic Curve (CCC) is produced for each item. The CCC displays the probability of a person endorsing a particular response category based on their level of support for the item and the intensity or difficulty of the item.
Figure 2 illustrates a CCC with well-spaced response categories. The range of person total scores, termed person locations in Rasch analysis, is plotted along the x-axis. More detail about the unit of measurement (i.e. logits) will be forthcoming. The probability of selecting each category is plotted along the y-axis. In Figure 2, the probability of selecting disagree, across different person locations, is shown by the red curve.
Figure 2: Category Characteristic Curve (CCC) for an item where the response categories are operating well.
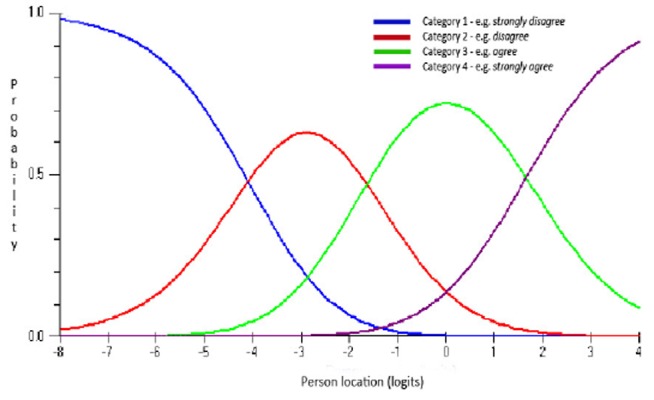
The point between two adjacent categories, where either response is equally probable, is termed the threshold. For data to adhere to the Rasch model, threshold points should be correctly ordered, such that respondents would consider endorsing strongly agree to represent greater support for the latent trait than selection of the agree category. It would also mean that respondents with high overall levels of the latent trait being measured would consistently endorse the higher-scoring responses and respondents who possessed lower trait levels would consistently endorse the lower-scoring responses.
Disordered thresholds occur when participants have difficulty consistently discriminating between response categories. This may arise if there are too many response options or if the labelling is confusing.3
Person and item locations are logarithmically transformed and plotted on the same continuum using a common unit of measurement termed a logit; thereby converting ordinal data to equal-interval data. Figure 3 illustrates how person and item locations (measured in logits) can be plotted on the same continuum along the x axis. In Rasch modelling, these logit values are termed locations instead of scores.
Figure 3: Example of a person-item distribution map showing person (red) and item (blue) locations in logits.
A person's location in logits is their natural log odds for agreeing to a set of items. People with higher levels of the attitude under consideration have more positive endorsement of items and thus have locations (in logits) that occur to the right of the scale.
An item's location may be interpreted as the relative difficulty respondents, as a whole, have in responding affirmatively to that item. Items located to the right of the continuum midpoint of 0 logits (i.e. a positive logit value) are more difficult to endorse than those to the left (a negative logit value), with the item content helping to define what more or less of the construct signifies. More intense items are likely to be affirmed only by persons possessing higher total scores on a set of items, whereas easier or less intense items are likely to be affirmed by many persons, including those with lower total scores.10
Logits possess several advantages over raw scores. Firstly, as these measures share a common unit on a common scale, researchers can readily visualise the order of difficulty or intensity of items relative to each other and can easily ascertain where any individual person is located in relation to all items.17 Secondly, the conversion of ordinal data to equal-interval data means any difference in logits implies equal difference in ability or latent trait possession.17 Item or person logit locations can therefore be summed and used in standard statistical analyses. Finally, unlike raw person and item scores, these measures allow comparisons between subjects from the same group to be made independently of the items chosen for comparison, and for comparisons between items to be made independently of which participants are used for the comparison.6
A variety of software programs are available to assess how well data conform to Rasch measurement criteria.18-20 They function by producing both expected and observed values of person responses for comparison. Fit statistics and graphical inspection of these values help establish which persons and/or items should or should not be retained to ensure the best possible fit of data to the model;13 specifically whether items can be considered to comprise a unidimensional measurement scale with equal-interval level properties. If the data fit the model, the programs provide both item and person locations (raw scores transformed according to the Rasch logistic function) which can be plotted on the same continuum. The person locations may then be submitted to traditional statistics to test, for example, the significance of mean differences between groups of persons.
Checks are also made to determine if different groups within a sample (e.g. gender or age), despite having the same levels of the latent trait, respond differently to an individual item. This phenomenon is termed Differential Item Functioning (DIF). When DIF is present, the probability of an item response cannot be explained wholly by the respondents' levels of attitude and the difficulty of endorsing the item, as their performance is also influenced by another characteristic such as their gender or age.21
In Rasch analysis, no single test of fit statistic is paramount or sufficient, and each must be considered for comprehensive appraisal of the data.22 Knowledge of the construct, scale, sample and test conditions will help to explain or theorise about any discrepancies between the model and the data. “Failure of the data to conform to the Rasch model implies further work on the substantive problem of scale construction, not on the identification of a more complex model that might account for the data”.(8 p. 86) Refinement of poorly fitting items (e.g. removing items, splitting items, collapsing categories) is used to create a scale that better measures the latent trait under consideration.
The remainder of this paper details application of the Rasch model to measure attitudes towards abortion, along with an evaluation of the scale's properties. This same process could be applied to the measurement of other latent traits. The specific aim is to illustrate how a psychometrically sound unidimensional measure of adolescent attitudes and intentions towards abortion was created.
Method
The “Adolescent Attitudes to Abortion (AAA) Scale” was derived using data from a multiphase research project entitled the “Teen Relationships Study”.23 This study aimed to explore biopsychosocial antecedents to adolescent pregnancy, and was conducted in Perth, Western Australia between 2006 and 2008 with adolescent samples.
Phase one of the “Teen Relationships Study” involved indepth semi-structured interviews with a purposive sample of sexually active adolescent females (aged 14-19 years). Thematic analysis was performed on the narrative data and prominent themes were identified. From these themes, attitude and intention items were created. Further detail of the method used to obtain these data and some of the thematic findings have been published elsewhere.24,25
In phase two of the “Teen Relationships Study,” attitude and intention items were integrated into an extensive questionnaire collecting demographic information and data on functioning in individual, family, and extrafamilial domains. To capture a range of sexual experiences and pregnancy outcomes, the questionnaire was administered to attendees of antenatal clinics (females), termination services (females) and secondary schools (males and females).
Participants
In total 1681 adolescents, aged 12 to 19 years, responded to the questionnaire. Of the attitude and intention items relating to abortion (n=10), three items were female-specific and two items were given to males only. For the purpose of scale development, the sample size was amended to include only those individuals who answered all the items applicable to their gender (n=203 males, 510 females).
As there were nearly twice as many female respondents, a random sub-sample of 203 females was selected to make the size of each gender group equitable. This approach was taken to help ensure the final scale would be relevant to both sexes. Therefore, the final sample size used for the Rasch analysis was 406 participants.
Additional checks to ensure the scale content was meaningful to particular population subsets, including gender, were made. These checks, specifically assessment for DIF, are discussed later.
Scale structure
The “AAA Scale” originally consisted of ten attitude and intention items relating to abortion, as listed in Table 1. Items were answered on a four-point Likert scale consisting of strongly disagree, disagree, agree and strongly agree; and were scored from 0 to 3 respectively. Items marked with an asterix (*) were reverse-scored. A higher score equated to greater support for terminating a pregnancy. Items preceded by an L were asked of both males and females, G items were only given to girls and B items to boys.
Table 1: Original Conceptualisation of the “Adolescent Attitudes to Abortion Scale” (n=10).
| Item | |
|---|---|
| L3 | I would have an abortion if there was something wrong with the baby |
| L10* | I do not believe in abortion |
| L17 | Abortion is a good option if you need to use it |
| L31* | I do not think abortion should be available |
| L39* | My family does not agree with abortion |
| G2 | I would have an abortion if I was not ready to have a baby |
| B2 | I would want my partner to have an abortion if I wasn't ready to have a baby |
| G5 | I would have an abortion if I was raped and became pregnant |
| B5 | It is okay for a girl to have an abortion if she was raped and became pregnant |
| G23 | I would have an abortion if I didn't have a partner to support me |
indicates item is reverse-scored
To establish the internal consistency and reliability of the set of items, all responses were analysed using the interactive computer program Rasch Unidimensional
Measurement Model 2030 (RUMM2030).20
RUMM2030 ranked person locations and divided them into class intervals (CIs) of approximately equal numbers. The mean observed scores for each CI were then compared to the value expected by the Rasch model. The process, including the various output and fit statistics generated by RUMM2030, and how they are evaluated, is provided in the results section.
Results
Thresholds
The expectation is that response curves for each category and for each item function according to logical expectations and the requirements of the Rasch model, as shown in the CCCs in Figure 2. For the “AAA Scale” this means the response curves plot from left to right in order of increasing agreement. Therefore, the probability of selecting the “easiest” (least intense) option is more likely to occur amongst those scoring low on the scale overall (i.e. amongst individuals indicating a low support for abortion), and those who scored higher on the overall scale would have a greater probability of selecting a more intense, higher-scoring response option. In addition to viewing CCCs, a table detailing the logit locations of threshold points can be examined to detect any disordered thresholds.
Disordered thresholds are indicative of broader validity and reliability issues.6 Before any additional assessment of fit to the Rasch model was made, the possibility of correcting such thresholds was explored by collapsing adjacent categories where the problem occurred.
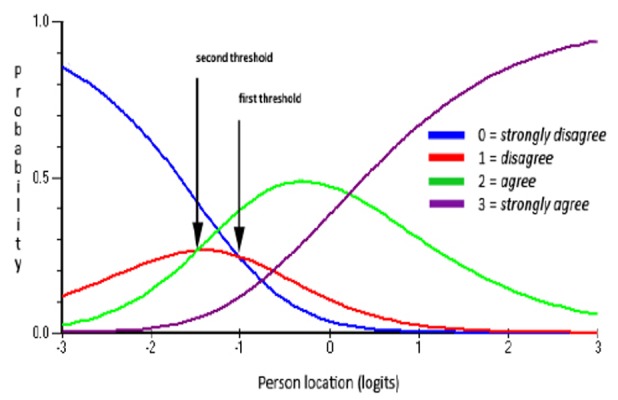
Table 2 illustrates threshold locations for two items from the “AAA Scale”. Item B5 had thresholds that were reversed and therefore were not operating according to logical expectations or the requirements of the model. The highlighted section of the table illustrates that the second threshold occurred before the first. In comparison, the thresholds for item G5 operated as expected and were ordered sequentially.
Table 2: Threshold Values for two Items from the “Adolescent Attitudes to Abortion Scale”.
| Thresholds | ||||
|---|---|---|---|---|
| Item | 1 strongly disagree/ disagree | 2 disagree/ agree | 3 strongly agree/agree | |
| G5 | −1.14 | 0.26 | 0.89 | |
| B5 | −0.24 | −0.77 | 1.01 | * |
*indicates reversed thresholds
Assessment of the CCC for item B5, as illustrated in Figure 4, highlights these disordered thresholds graphically. The figure illustrates that the first threshold (i.e. where the probability of responding in either category 0 or 1 intersect) occurred after the second threshold (where categories 1 and 2 intersect) along the logit continuum. This would mean that for persons located anywhere along the response continuum, and especially for those persons located at the maximum value for this category, disagreeing with the item (i.e. selecting category 1) is never the most probable response.
Figure 4: Category characteristic curve for item B5 with disordered thresholds.
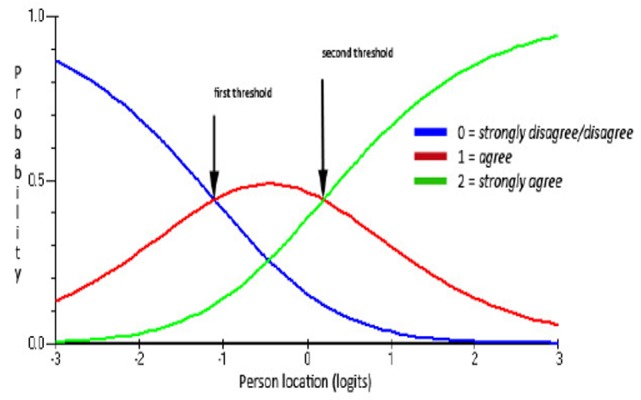
To address these disordered thresholds, before any additional assessment of fit to the Rasch model was made, the response categories for this item were reduced from four categories to three. This was achieved by rescoring as follows: 0/1=0, 2=1, and 3=2. In descriptive terms this meant combining strongly disagree and disagree, leaving agree and strongly agree separate. Figure 5 illustrates the CCC for item B5 after the categories were rescored. It can be seen that the thresholds now operated correctly.
Figure 5: Category characteristic curve for item B5 with ordered thresholds.
As correctly ordered response category thresholds are an integral test of fit to the Rasch model, the remainder of the analyses were carried out using the rescored data.
Item Fit
Fit of the individual items to the model was examined via individual item log residual test of fit statistics, the item-trait interaction test of fit (a chi -square test) and graphical inspection of the ICCs. Results of all three were taken into account when making decisions about fit or misfit to the model.
A negative fit residual indicates the item is overdiscriminating in relation to the discrimination of all items taken as a whole, and a positive value suggests the item is less discriminating. Log residual test of fit statistics within the range -2.5 to 2.5 are usually acceptable.26
The hypothesis of the chi-square test is that there is no difference between the observed and theoretical values for a particular ICC. Therefore, p-values of less than 0.05, which show that there is a difference, indicate poor fit of the item to the model. x 2 values may vary in size and if ranked, may increase gradually, but ideally there should be no sudden increases in size and none should be statistically significant.27
Table 3 illustrates item fit statistics for the original 10 items of the “AAA Scale”, arranged by increasing x 2 value. The location is the item intensity measured in logits. Most of the statistics comply with criteria for good data to model fit: low log residuals (<± 2.5) and high x 2 probability (p>0.05). To account for multiple testing, Bonferroni adjustments28 were made to the chi-square significance tests based on the number of items in the scale.
Table 3: Item Fit Statistics for all Items of the “Adolescent Attitudes to Abortion Scale” (n=10).
| Item | Location | Log residual | X 2 | p |
|---|---|---|---|---|
| G5 | −0.72 | 0.55 | 1.48 | 0.69 |
| G2 | −0.25 | 0.28 | 1.79 | 0.62 |
| L3 | 0.70 | 0.23 | 2.56 | 0.46 |
| G23 | 0.94 | 0.52 | 2.58 | 0.46 |
| L17 | 0.15 | −0.48 | 2.78 | 0.43 |
| L10 | −0.14 | −2.03 | 3.02 | 0.39 |
| B5 | −0.46 | −0.28 | 4.40 | 0.22 |
| L39 | 0.03 | 2.86 | 4.72 | 0.19 |
| B2 | 0.36 | −0.74 | 7.04 | 0.07 |
| L31 | −0.61 | −1.77 | 12.80 | 0.01 |
Table 3 indicates that two items do not fit the model well. Item L39 has a log residual greater than the maximum set and L31 registers a high x 2 value.
After removing item L31 and recalculating the item fit statistics, all x 2 values complied but the fit residual for L39 remained high (3.32).
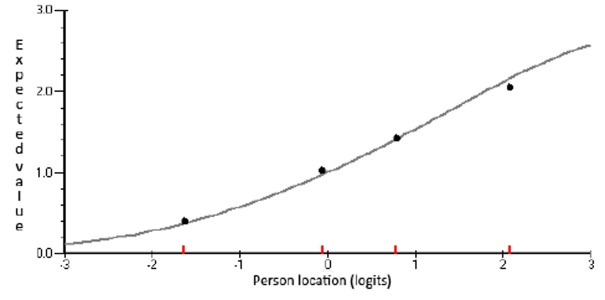
Finally, graphical inspection of the ICCs for each item was made to examine the fit between expected and observed values. The ICC for item L39, now considered the worst-fitting item, is illustrated in Figure 6. The average response of persons within each class interval (CI) is represented graphically by a dot and expected values are represented by the solid curve. As these points were closely aligned, item L39 was retained. The ICC for the best-fitting item, G23, is shown in Figure 7 for comparative purposes.
Figure 6: Item Characteristic Curve for worst-fitting item (L39).
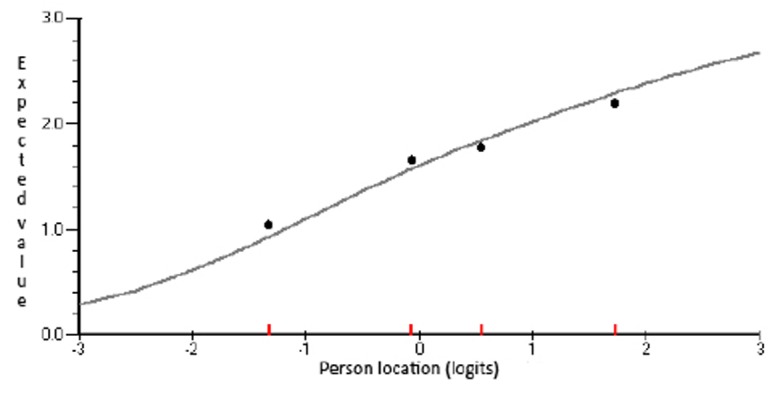
Figure 7: Item Characteristic Curve for best-fitting item (G23).
Overall fit of the items to the Rasch model was examined by assessing the mean item log residual test of fit. For items to fit the model, the mean across all items should be close to 0 and the standard deviation close to 1.26 A mean item fit residual of -0.05 (SD=1.43) indicated overall item fit was acceptable for the “AAA Scale”.
Differential Item Functioning
To assess DIF, an F-test for each item was performed to determine if the obtained mean location values were statistically comparable, irrespective of what group the person may have belonged to. In an F-test, if the two variances used for comparison are equal, they are considered to be from the same population. Bonferroni adjustments were also made for these tests.
The “AAA Scale” displayed no evidence of DIF within the following groups: males and females; those reporting previous sexual experience versus those with no prior experience; and amongst people with different pregnancy histories. Thus direct comparisons of mean locations for these groups can be made as the construct has the same meaning across sub-groups.
Person fit
The fit of individual persons to the model was assessed via person fit residuals. Log residual values less than -2.5 indicate a purer Guttman response pattern than expected and may indicate a problem if the value is very low (e.g. the persons could be responding according to a mental set or fixed pattern of thinking). Values exceeding 2.5 indicate a response pattern that is disordered more than expected and may indicate carelessness or low motivation in responding. Both extremes were investigated to determine whether to remove such persons from the sample.29
Of the final sample of 406 participants, 29 individuals displayed person fit log residuals outside the range −2.5 to 2.5. As these residuals were all negative and their removal did not change the overall fit of the data to the Rasch model, a decision was taken to retain all persons.
Overall fit of persons to the model was examined via the mean person log residual test of fit. Like the item log residual test of fit, it is expected to approximate a Normal distribution (x=0, SD=1).26 A mean person log residual test of fit of -0.57 (SD=1.36) indicated overall person fit was reasonable.
Overall fit to the Rasch model
The item-trait interaction statistic is a measure of the overall fit of the data to the Rasch model. A statistically significant result on this chi-square test indicates that some items do not fit the model. Misfit would indicate that the items are assessing something in addition to, or other than, the property or construct of interest.
For the “AAA Scale” the non-significant total item-trait interaction test of fit (x2=32.04, df=27, p=0.23) indicated that invariance was maintained along the latent trait. Together with the other tests of fit, this meant the items were internally consistent and can be accepted as forming a single variable at this level of scale. The interval-level locations (scores), which the Rasch transformation produced, can be used for further statistical analyses such as comparisons of mean locations for various groups of persons.
Item/person distribution
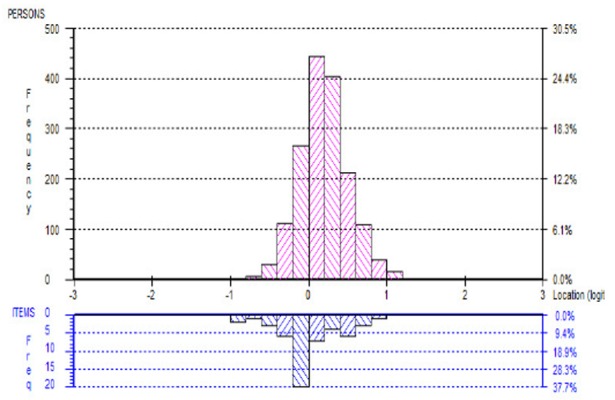
The targeting of items and persons was assessed by viewing the person-item location distribution map, where person locations are plotted together with item locations or item threshold locations on the same continuum. The distributions of person (for both gender groups) and item threshold locations are represented in Figure 8. The figure illustrates that whilst the items are reasonably well distributed, some individuals (of both genders) cannot be measured as reliably as the majority by this set of items. This is because they find the items either too intense or not intense enough for them. These areas have been highlighted by black circles. Females were more widely distributed along the continuum than males.
Figure 8: Person-item threshold distribution map for the “Adolescent Attitudes to Abortion Scale.”.
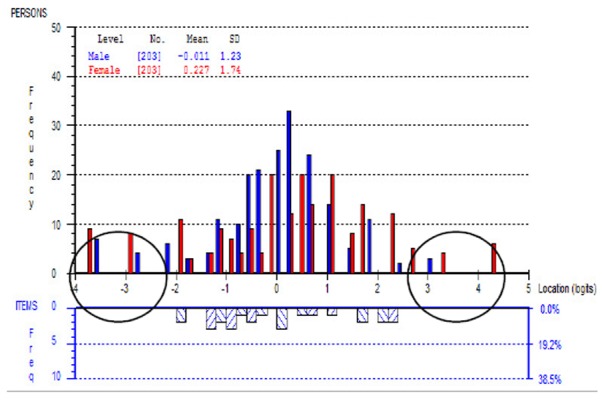
Table 4 summarises the comparisons amongst mean person location scores of different population groups, revealing that support for abortion was greatest amongst older individuals, females, those from non-Aboriginal or Torres Strait Islander (ATSI) backgrounds, individuals with no religious affiliations, and those who reported being sexually active. Persons with a previous experience of pregnancy also showed greater support for abortion services, with the greatest support shown by those participants reporting a previous abortion.
Table 4: Relative Mean Scale Scores for Different Subgroups responding to the “Adolescent Attitudes to Abortion Scale”.
| Support for abortion | |
|---|---|
| Age | increased with age |
| Gender | females > males |
| ATSI status | non-ATSI > ATSI |
| Religious affiliation | no religion > religious |
| Sexual activity | sexually active > not yet sexually active |
| Pregnancy history | history of pregnancy > never been pregnant |
| Pregnancy outcome | history of abortions only > history of live births only > never been pregnant |
Order and location of items
Examining the order and location of items provides further evidence of scale validity. A well-developed scale will possess item locations that are evenly distributed along the logit continuum and the ranked order of item difficulties or intensities should make sense empirically.
Table 5 lists the final set of items by increasing location (in logits) along the continuum, along with the final response categories used. The table illustrates that items B5 and G5 were the “easiest” for participants to agree with and item G23 was the most “difficult”; with the order of intensity making sense intuitively.
Table 5: Final List of Items in the “Adolescent Attitudes to Abortion Scale” (location order) (n=9).
| Item | Location | Response categories | |
|---|---|---|---|
| B5 | It is okay for a girl to have an abortion if she was raped and became pregnant | −0.798 | SD/D, A, SA |
| G5 | I would have an abortion if I was raped and became pregnant | −0.483 | SD, D, A, SA |
| B2 | I would want my partner to have an abortion if I wasn't ready to have a baby | −0.326 | SD, D, A, SA |
| L10* | I don't believe in abortion | −0.206 | SD, D, A, SA |
| L39* | My family does not agree with abortion | −0.04 | SD, D, A, SA |
| L17 | Abortion is a good option if you need to use it | 0.074 | SD, D, A, SA |
| G2 | I would have an abortion if I was not ready to have a baby | 0.315 | SD, D, A, SA |
| L3 | I would have an abortion if there was something wrong with the baby | 0.628 | SD, D, A, SA |
| G23 | I would have an abortion if I did not have a partner to support me | 0.836 | SD, D, A, SA |
indicates items is reverse-scored
As a spread of −3 to +3 logits is usually considered adequate,6 the logit values in Table 5 (together with the graphical illustration shown in Figure 8) confirms that more and less intense items could be included to better distinguish between participants at both extremes of the scale.
Reliability
An indication of the reliability of the scale is provided by the Person Separation Index (PSI), the Rasch equivalent of Cronbach's a. This index indicates how well the scale can distinguish amongst persons in terms of their latent trait locations.
For the “AAA Scale” the PSI was 0.82, indicating good reliability. A Cronbach's a statistic could not be calculated as the final scale included gender-specific items which resulted in missing data for each respondent.
Discussion
On the basis of the analyses described here, the final nine item “AAA Scale” can be accepted as an effective and valid measurement tool for the assessment of adolescent attitudes and intentions towards abortion, demonstrating good reliability. The scale is unidimensional and interval-level scores of attitude were obtained.
The rescoring of item B5 and removal of item L31 provided the best fit between the data and the Rasch model. Future application of this scale may require re-wording of the response categories for item B5, with subsequent re-testing. To make male and female versions of the scale congruent, the response categories for the similarly-worded item G5 could also be revised, although Rasch analysis did not deem it necessary. Whilst it is not ideal to reduce categories post hoc, these analyses indicate that item B5 operated more effectively with fewer categories and that rescoring was justified.
Mean person locations for different population groups matched expectations. For example, support for abortion was strongest amongst females and those self-reporting a previous abortion. Such results provide further evidence of the scale's validity.
The addition of more and less intense items would enable the scale to make better distinctions between people with very high or very low total scores. As it currently exists, the absence of DIF indicates that the scale could be administered to participants of different gender and to those with different sexual and/or pregnancy experiences, without concern that the items may mean something different to these population subsets.
The creation of interval-level measures by the “AAA Scale” allows intensity of attitude to be more explicitly measured than previously developed ordinal scales measuring attitudes towards abortion.30-33 For example, the correlations between attitude and behaviour can be examined with greater specificity; and Rasch person locations will enable the investigation of changes in these measures over time and between groups to be undertaken with greater precision.
Another benefit the “AAA Scale” has over previous measurement scales is that the estimated item parameters and person values derived from the Rasch model are not sample-dependent (if no DIF is present and a reasonable range of persons have been used for the analysis), whereas important statistics about test items (e.g. their difficulty) derived through traditional methods can only be confidently generalised to the population from which the sample was drawn.2 Most other scales also require all items to be administered to derive and interpret scores. Calibration of items using Rasch methods remain independent of the sample used and enable individuals to obtain the same score irrespective of what items are answered;34 meaning missing data can be accommodated.
There are some limitations of this study. Firstly, the scale items were developed and then administered to the sample prior to any application of the Rasch paradigm. However, whilst the Rasch paradigm and model could have been utilised in the initial development and trialling of items, it is not uncommon for it to be used in the improvement and/or assessment of existing scales. O'Connor13 provides several examples of how the Rasch model has been subsequently applied to health outcome measures that were established by other theoretical approaches.
Secondly, the sampling framework resulted in a relatively homogenous sample of adolescents. Although Rasch analysis enables scores to be calibrated independently of the distribution of item responses,34 further analyses need to be carried out with more diverse populations before applying the scoring mechanism more widely.
Finally, although the final nine items demonstrated close adherence to the principles of objective measurement, the study did not afford the opportunity to re-test them in the same population.
Conclusion
The Rasch unidimensional measurement model is a simple and effective tool in the development of attitude measurement scales. This paper described how the model was used to develop a scale measuring attitudes towards abortion; with an emphasis on illustrating the psychometric properties of the scale. If fit to the model is satisfactory, interval-level item and person locations can be produced that are invariant in nature. The information about fit allows researchers to better understand the strengths and weaknesses of their scales, providing clear direction for future amendments of scale items and further understanding of the construct of interest.
ACKNOWLEDGEMENTS
The authors would like to acknowledge the investigative team of the “Teen Relationships Study” who kindly granted access to their dataset for these analyses. Special mention is given to Rosemary Austin and Jennifer Smith for their tireless efforts with data collection. Additional thanks are given to all the recruitment sites that participated, and to the many adolescents who took the time to share their viewpoints and experiences.
Footnotes
PEER REVIEW
Not commissioned. Externally peer reviewed
CONFLICTS OF INTEREST
The authors declare that they have no competing interests.
FUNDING
The “Teen Relationships Study”, from which the data in this research paper was originally derived, was funded by a NHMRC Research Grant (New Investigator). Funding to support the Rasch analysis process discussed in this paper was provided by a Curtin University Postgraduate Scholarship and a University of Western Australia Ad-Hoc Scholarship.
ETHICS COMMITTEE APPROVAL
- King Edward Memorial Hospital Human Research Ethics Committee
- Western Australian Aboriginal Health Information and Ethics Committee
- Curtin University Human Research Ethics Committee
Please cite this paper as: Hendriks J, Fyfe S, Styles I, Skinner SR, Merriman G. Scale construction utilising the Rasch unidimensional measurement model: A measurement of adolescent attitudes towards abortion. AMJ 2012, 5, 5, 251- 261. http//dx.doi.org/10.4066/AMJ.2012.952.
References
- 1.Dawis R.. Scale construction. Journal of Counseling Psychology. 1987;34((4)):481–9. [Google Scholar]
- 2.Kline T. Thousand Oaks, CA: SAGE Publications; 2005. Psychological testing: A practical approach to design and evaluation. [Google Scholar]
- 3.Pallant J, Miller R, Tennant A.. Evaluation of the Edinburgh Post Natal Depression Scale using Rasch analysis. BMC Psychiatry. 2006;6((1)):28–38. doi: 10.1186/1471-244X-6-28. [DOI] [PMC free article] [PubMed] [Google Scholar]
- 4.Muller S, Roddy E.. A Rasch analysis of the Manchester Foot Pain and Disability Index. Journal of Foot and Ankle Research. 2009;2((1)):29. doi: 10.1186/1757-1146-2-29. [DOI] [PMC free article] [PubMed] [Google Scholar]
- 5.Tor E, Steketee C.. Rasch analysis on OSCE data: An illustrative example. Australasian Medical Journal. 2011;4((6)):339–345. doi: 10.4066/AMJ.2011.755. [DOI] [PMC free article] [PubMed] [Google Scholar]
- 6.Andrich D, Styles I. Perth: Murdoch University; 2004. Final report on the psychometric analysis of the Early Development Instrument (EDI) using the Rasch model: A technical paper commissioned for the development of the Australian Early Development Instrument (AEDI) [Google Scholar]
- 7.Rasch G. In: Expanded edition with foreword and afterword. Wright B.D., editor. Chicago: The University of Chicago Press; (1980). 1960/1980. Probabilistic models for some intelligence and attainment tests (Copenhagen, Danish Institute for Educational Research) by. [Google Scholar]
- 8.Andrich D. California: SAGE Publications; 1988. Rasch models for measurement. [Google Scholar]
- 9.Bond TG, Fox CM. Mahwah, NJ: Lawrence Erlbaum Associates; 2001. Applying the Rasch model: Fundamental measurement in the health sciences. [Google Scholar]
- 10.Cavanagh RF, Romanoski JT. Rating scale instruments and measurement. Learning Environments Research. 2006;9((3)):273–89. [Google Scholar]
- 11.Waugh RF, Chapman E.. An analysis of dimensionality using Factor analysis (True-Score theory) and Rasch measurement: What is the difference? Which method is better? Journal of Applied Measurement. 2005;6((1)):80–99. [PubMed] [Google Scholar]
- 12.Wright BD. Comparing Rasch measurement and Factor analysis. Structural Equation Modeling. 1996;3((1)):3–24. [Google Scholar]
- 13.O'Connor R. Churchill Livingstone. Edinburgh: 2004. Measuring quality of life in health. [Google Scholar]
- 14.Embretson S, Reise S. Mahwah, NJ: Lawrence Erlbaum Associates; 2000. Item response theory for psychologists. [Google Scholar]
- 15.Andrich D.. Controversy and the Rasch model: A characteristic of incompatible paradigms? Medical Care. 2004;42:1–16. doi: 10.1097/01.mlr.0000103528.48582.7c. [DOI] [PubMed] [Google Scholar]
- 16.Andrich D.. An elaboration of Guttman scaling with Rasch models for measurement. Sociological Methodology. 1985;15:33–80. [Google Scholar]
- 17.Wright BD, Masters GN. Chicago: MESA Psychometric Laboratory, University of Chicago, Department of Education; 1981. The measurement of knowledge and attitude. [Google Scholar]
- 18.Linacre M, Wright BD. Chicago: MESA Press; 2000. WINSTEPS: Multiple-choice, rating scale, and partial credit Rasch analysis. [Computer software]. [Google Scholar]
- 19.Adams RJ, Wu ML, Wilson MR. Camberwell, Victoria; Australian Council for Educational Research; 1998. ConQuest: Generalised item response modelling software. [Computer software]. [Google Scholar]
- 20.Andrich D, Sheridan B, Luo G. Perth: RUMM Laboratory; 2030. 2008. Rasch Unidimensional Measurement Model. [Computer software]. [Google Scholar]
- 21.Hagquist C, Andrich D.. Is the Sense of Coherence-instrument applicable on adolescents? A latent trait analysis using Rasch-modelling. Personality and Individual Differences. 2004;36:955–68. [Google Scholar]
- 22.Smith RM, Plackner C.. The family approach to assessing fit in Rasch measurement. Journal of Applied Measurement. 2009;10((4)):424–37. [PubMed] [Google Scholar]
- 23.Skinner SR. Perth, Western Australia: National Health and Medical Research Council; 2005. Why do Australian teenagers fall pregnant? Exploring the antecedents of teenage pregnancy. [Google Scholar]
- 24.Skinner SR, Smith J, Fenwick J, Fyfe S, Hendriks J.. Perceptions and experiences of first sexual intercourse in Australian adolescent females. Journal of Adolescent Health. 2008;43((6)):593–9. doi: 10.1016/j.jadohealth.2008.04.017. [DOI] [PubMed] [Google Scholar]
- 25.Skinner SR, Smith J, Fenwick J, Hendriks J, Fyfe S, Kendall G.. Pregnancy and protection: Perceptions, attitudes and experiences of Australian female adolescents. Women and Birth. 2009;22((2)):50–6. doi: 10.1016/j.wombi.2008.12.001. [DOI] [PubMed] [Google Scholar]
- 26.RUMM Laboratory. 2004. Interpreting RUMM2020. Part 1: Dichotomous data;
- 27.Andrich D, van Schoubroeck L.. The General Health Questionnaire: A psychometric analysis using latent trait theory. Psychological Medicine. 1989;19:469–85. doi: 10.1017/s0033291700012502. [DOI] [PubMed] [Google Scholar]
- 28.Bland M. Oxford: Oxford University Press; 1995. An introduction to medical stastistics. [Google Scholar]
- 29.Tennant A, Conaghan P.. The Rasch measurement model in rheumatology: What is it and why use it? When should it be applied, and what should one look for in a Rasch paper? Arthritis and Rheumatism. 2009;57:1358–62. doi: 10.1002/art.23108. [DOI] [PubMed] [Google Scholar]
- 30.Davis C, Yarber W, Bauserman G, Schreer G, Davis S. Thousand Oaks, CA: Sage Publications; 1988. Handbook of sexuality-related measures. [Google Scholar]
- 31.Stets JE, Leik RK. Attitudes about abortion and varying attitude structures. Social Science Research. 1993;22((3)):265–82. [Google Scholar]
- 32.Carlton CL, Nelson ES, Coleman PK. College students' attitudes toward abortion and commitment to the issue. The Social Science Journal. 2000;37((4)):619–25. [Google Scholar]
- 33.Beere C. Westport, CT: Greenwood Press; 1990. Sex and gender issues: A handbook of tests and measures. [Google Scholar]
- 34.Wright BD, Stone MH. Chicago: MESA Press; 1979. Best test design: Rasch measurement. [Google Scholar]


