Eosinophil contamination affects thioglycollate-elicited peritoneal macrophage responses during in vitro stimulation.
Keywords: Siglec F, F4/80, flow cytometry
Abstract
Thioglycollate-elicited peritoneal cells are a common source of macrophages for various in vitro assays, including stimulation with TLR ligands, cell signaling assays, phagocytosis, toxicology studies, and cytokine/chemokine production. The most common method for enrichment of cultured thioglycollate-elicited peritoneal cells is adherence. However, the presence of other cell types in freshly isolated and cultured thioglycollate-elicited peritoneal cells has not been examined. Here, we demonstrate that thioglycollate-elicited peritoneal cavity contains 55–60% nonmacrophage cells, and even after adherence, there are still 12–20% nonmacrophage cells remaining. Excluding macrophages, eosinophils are the major cell type in the freshly elicited cavity (30–40%). Eosinophils are also the major cell type contaminating in vitro cultures of thioglycollate-elicited peritoneal macrophages. Moreover, the contamination of macrophage cultures by eosinophils significantly diminishes activation of p38 MAPK and the serine threonine kinase Akt and production of proinflammatory cytokines in response to LPS stimulation. Taken together, these data suggest that thioglycollate-elicited peritoneal cells are far more heterogeneous than reported previously. Further, a failure to remove contaminating eosinophils may greatly affect the interpretation of results obtained with cultured thioglycollate-elicited macrophages. Thus, our data indicate that future studies intent on accurately assessing cultured macrophage phenotype and activation require depletion of all cocontaminating cells, especially eosinophils.
Introduction
Cultured primary mouse macrophages are often used for various types of in vitro studies, including production of pro- and anti-inflammatory cytokines and arachidonic acid metabolites, phagocytosis and killing of intracellular organisms, antigen presentation and interactions with T cells, cell signaling assays, chemotaxis, and toxicology studies [1]. One advantage in using peritoneal macrophages is their relative ease of isolation; however, the naïve peritoneal cavity yields ∼1–2 × 10⁶ cells, of which, only 40% are macrophages (0.4–0.8×10⁶macrophages/mouse). To overcome this limitation, various methods for eliciting macrophages in the peritoneal cavity have been developed, including stimulation with thioglycollate, caseinate [2], protease peptone [3], sodium-periodate [2, 3], and biogel particles [4]. Thioglycollate-elicited peritoneal macrophages were introduced in 1964 by Gallily and colleagues [5] as a modification of Barski's method [6] and have rapidly become the most common tool for macrophage generation (or eliciting macrophages). Nonenzymatic reactions between proteins and reducing sugars in thioglycollate broth lead to formation of advanced glycation end-products [7]. These end products are recognized by members of the PRR family, such as receptor for advanced glycation end-products [8] and the macrophage scavenger receptor. The resulting sterile peritonitis attracts monocytes, which upon entrance into peritoneal cavity, differentiate into macrophages.
Recently, two detailed studies have identified multiple populations of leukocytes that occupy the naïve and thioglycollate-elicited peritoneal cavity [9, 10]. Moreover, the macrophage population in the naïve peritoneal cavity was found to be heterogeneous, as it contained cells that were F4/80hiMHC II− and F4/80lowMHC II+/− macrophages [10]. Nonetheless, a high purity of macrophage cultures is of great importance for in vitro experiments. Freshly isolated thioglycollate-elicited peritoneal cells have been reported to contain a high percentage of macrophages 86–95% [9, 11, 12], and their purity increased further to almost 99% by adherence [1, 3, 9, 13]. However, the assessment of the percent macrophages was based solely on the presence of antigens, such as CD11b or F4/80, which were previously considered to be “macrophage specific”. It is now clear that not only macrophages but also other myeloid cells, such as neutrophils, eosinophils, and DCs express CD11b or F4/80 [10, 14]. Thus, the presence of even minor amounts of contaminating cells may affect the results of in vitro assays and lead to misinterpretation of the data [9].
In this manuscript, we characterized the cellular content of thioglycollate-elicited peritoneal cavity and cultured peritoneal macrophages. We demonstrated that the percent of macrophages from the elicited cavity was less than reported previously and that eosinophils were present in large quantities. Additionally, eosinophils were a major cell type contaminating adherent cultures of peritoneal macrophages and that the presence of these cells affected the functional readout on common assays performed on macrophages. Taken together, these data suggest that avoidance of contamination by eosinophils is crucial for accurate interpretation of in vitro studies of cultured thioglycolate-elicited peritoneal macrophages.
MATERIALS AND METHODS
Mice
C57Bl/6 mice were bred and housed at a barrier and specific pathogen-free facility at the Center for Comparative Medicine at Northwestern University (Chicago, IL, USA). Eight-week-old mice were used for all experiments. Brewer's thioglycollate broth (4%; Becton Dickinson, Franklin Lakes, NJ, USA) was prepared, autoclaved, and aged for at least 1 month prior to use. Mice were euthanized 72 h after i.p. injection of 1 ml 4% thioglycollate. Peritoneal cells were harvested by peritoneal lavage with DMEM, counted using a “Countess” automated cell counter (Invitrogen, Carlsbad, CA, USA), and analyzed by flow cytometry or used for cell culture. All procedures were approved by the Institutional Animal Care and Use committee at Northwestern University.
Cell culture
Macrophages were enriched by adherence by plating peritoneal cells in FBS-free media for 1 h. Nonadherent cells were removed, replaced with fresh media, and then treated 24 h later with LPS (10 ng/ml; Sigma-Aldrich, St. Louis, MO, USA) for 6 and 12 h. Fluorescent and phase-contrast images of the cell cultures were obtained on a Revolution XD spinning disk confocal system (Andor Technology, Northern Ireland) with a Nikon Ti Perfect Focus microscope (Nikon Instruments, Melville, NY, USA), located at the Northwestern University Cell Imaging Facility.
Flow cytometry
Peritoneal cells were labeled with Aqua LIVE/DEAD dye (Invitrogen), preincubated with Fc block (BD Biosciences, San Jose, CA, USA), stained with fluorochrome-conjugated antibodies (see below), and acquired on a BD LSR II flow cytometer (BD Biosciences), located in the Translational Medicine Division of the Rheumatology Flow Cytometry Core facility, Northwestern University. FMO or isotype controls were used when appropriate. For intracellular signaling assays, peritoneal cells were first labeled with antibodies to cell surface antigens, fixed with BD Lys/Fix buffer (BD Biosciences), permeabilized with BD Perm III buffer (BD Biosciences), and stained for phosphorylated p38 and Akt. Tables 1 and 2 include detailed information concerning antibodies, including fluorochrome, clone, manufacturer, and cytometer configuration. Data were compensated and analyzed using FlowJo software (Tree Star, Ashland, OR, USA). Frequencies of specific cell subtypes were calculated as the percentage of live/single cells (see Fig. 1A). For cell sorting, thioglycollate-elicited peritoneal cells were processed and stained as above, and then macrophages and eosinophils were sorted at the University of Chicago Flow Cytometry Facility (Chicago, IL, USA) on a BD FACSAria II instrument (BD Biosciences). Sorted macrophages and eosinophils were cultured separately or together (2:1 ratio) and analyzed for expression of surface activation markers 24 h later.
Table 1. Antibodies Used Flow Cytometric Analysis.
| Antigen | Clone | Fluorochrome | Manufacturer |
|---|---|---|---|
| Akt (pS473) | M89-61 | PE | BD Biosciences |
| CD3 | 145-2C11 | APC-Cy7 | BD Biosciences |
| CD11b | M1/70 | PE-Texas Red | Invitrogen |
| CD11c | HL3 | APC | BD Biosciences |
| PE-Cy7 | BD Biosciences | ||
| CD19 | 1D3 | PE-Cy7 | BD Biosciences |
| Alexa Fluor 700 | BD Biosciences | ||
| CD40 | HM40-3 | Alexa Fluor 647 | BioLegend |
| CD69 | H1.2F3 | PerCP-Cy5.5 | BD Biosciences |
| CD80 | 16-10A1 | Pacific Blue | BD Biosciences |
| CD86 | GL1 | Alexa Fluor 700 | BD Biosciences |
| F4/80 | BM8 | eFluor 450 | eBioscience |
| Ly6G | 1A8 | PerCP-Cy5.5 | BD Biosciences |
| Ly6C | AL-21 | APC-Cy7 | BD Biosciences |
| MHC II (I-A/I-E) | M5/114.15.2 | FITC | eBioscience |
| APC-eFluor 780 | eBioscience | ||
| NF-κB (p65) | K10-985 | PECy7 | BD Biosciences |
| NK1.1 | PK136 | Alexa Fluor 700 | BD Biosciences |
| p38 | 36/p38 | APC | BD Biosciences |
| Siglec F | E50-2440 | PE | BD Biosciences |
| TLR2 | 6C2 | FITC | eBioscience |
| TLR4 | MTS510 | PE-Cy7 | eBioscience |
APC, Allophycocyanin. BioLegend, San Diego, CA, USA; eBioscience, San Diego, CA, USA.
Table 2. Configuration of the BD LSR II Instrument.
| Laser | Detector | Filter | Mirror | Fluorochromes | |
|---|---|---|---|---|---|
| Blue (488 nm) | A | 710/50 | 685LP | PerCP-Cy5.5 | |
| B | 525/50 | 505LP | FITC | ||
| C | 488/10 | SSC | |||
| Red (640 nm) | A | 780/60 | 735LP | APC-Cy7 | APC-eFluor 780 |
| B | 730/45 | 690LP | Alexa Fluor 700 | ||
| C | 670/30 | APC | Alexa Fluor 647 | ||
| Yellow-green (561 nm) | A | 780/60 | 735LP | PE-Cy7 | |
| B | 610/20 | 600LP | PE-Texas Red | ||
| C | 582/15 | PE | |||
| Violet (405 nm) | A | 582/15 | 570LP | Aqua | |
| B | 450/50 | Pacific Blue | eFluor 450 | ||
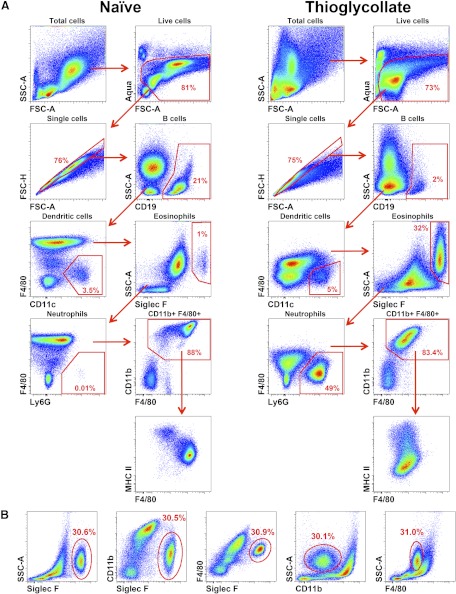
Figure 1. Flow cytometric analysis of the mouse peritoneal cavity.
(A) Gating strategy used to identify specific cell subtypes. Cells were obtained from naïve and thioglycolate-elicited peritoneal cavity, as described in Materials and Methods. (B) Different gating strategies to identify eosinophils in the thioglycollate-stimulated peritoneal cavity. Numbers on the dot plots represent percentages of the parent population.
ELISA
IL-6 and TNF-α ELISAs (R&D Systems, Minneapolis, MN, USA) were performed according to the manufacturer's protocol.
Depletion of eosinophils
Freshly isolated cells from the peritoneal cavity were stained with anti-Siglec F PE-conjugated antibody (BD Biosciences), washed with MACS running buffer (Miltenyi Biotec, Auburn, CA, USA), and labeled with anti-PE microbeads (Miltenyi Biotec), according to the manufacturer's instructions. Eosinophils were depleted on an AutoMACS separator (Miltenyi Biotec), using the “Depletes” program. Control (mock-depleted) cells were stained with anti-Siglec F-PE and run through the AutoMACS separator, omitting the anti-PE microbeads step. For high-purity selection of eosinophils, the “Possel” program was used. Following depletion, cells were analyzed using flow cytometry to assess purity. Collected cells were counted, washed, resuspended in serum-free media, and plated as above.
Statistical analysis
Comparison between experimental and control groups was performed using Student's unpaired two-tailed t tests.
RESULTS
Characterization of the thioglycollate-elicited peritoneal cells
To resolve uncertainty regarding the purity of thioglycollate-elicited peritoneal cells, we analyzed the cellular content of naïve and thioglycollate-stimulated peritoneal cavities using multicolor flow cytometry. Debris and dead cells were excluded on FSC-A versus Aqua LIVE/DEAD dot plots, and subsequently doublets were excluded on FSC-A versus FSC-H dot plots (Fig. 1A). B cells were defined as CD19+, T cells as CD3+, and NK cells as NK1.1+. DCs were identified as CD11chiMHC II+F4/80−, neutrophils as Ly6G+CD11b+F4/80−, and eosinophils as Siglec F+CD11bintF4/80intSSChi. Macrophages were identified after gating out B cells, neutrophils, eosinophils, and DCs as CD11bhiF4/80hi-intMHC II+/− cells (Fig. 1A). The untreated peritoneal cavity contains ∼1–3 × 10⁶ cells, which are comprised of ∼40% B cells, ∼10% T cells, ∼3% NK cells, 40–45% F4/80hiMHC II− resident macrophages, and 5% F4/80loMHC II+ macrophages. Additionally, neutrophils, monocytes, mast cells, and eosinophils together account for 2–3% of the total cells, corroborating a previous study [10].
I.p. injection of thioglycollate has been used to elicit peritoneal inflammation and has been reported to yield 15–25 × 106 cells, of which 86–95% are macrophages [1]. Seventy-two hours after injection of 4% thioglycollate, the peritoneal cavity yielded ∼20–35 × 106 cells. In contrast to naïve specimens, the cellular composition of the thioglycollate-stimulated peritoneal cavity consisted of 5–9% B cells, 1–5% neutrophils, 3–5% DCs, and a small percentage of T and NK cells (Fig. 1A). F4/80intMHC II+/− macrophages consisted of only 40–45% isolated peritoneal cells and appeared heterogeneous, based on expression of MHC II and Ly6C antigens. Moreover, the eosinophils were a second major population in the elicited cavity and accounted for 30–40%. These data indicate that macrophages and eosinophils are the two major cell types in the elicited peritoneal cavity at 72 h postinjection of thioglycollate.
Eosinophils also express CD11b and F4/80, albeit at lower levels than macrophages. Therefore, previous flow cytometric analyses, relying on only one of these antigens, may have overestimated the frequency of macrophages in the peritoneal cavity. Thus, to accurately separate macrophages from eosinophils, multiple gating strategies were devised using flow cytometry (Fig. 1B). The analysis of CD11b versus Siglec F expression or CD11b versus SSC allowed for the most accurate separation of macrophages and eosinophils. Whereas comparing F4/80 versus Siglec F expression enabled separation of eosinophils from macrophages, F4/80 versus SSC failed to provide resolution between populations. Thus, using specific markers for eosinophils, such as Siglec F, or their characteristic high SSC profile, together with lower expression of CD11b, may be considered essential for excluding these cells during flow cytometric analysis.
Eosinophils are the main contaminating cell type in the cultures of thioglycollate-elicited peritoneal macrophages
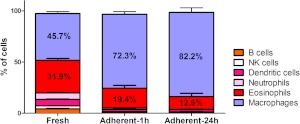
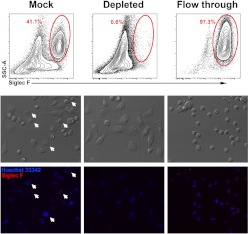
As the thioglycollate-stimulated peritoneal cavity contains large numbers of eosinophils, the presence of these cells on cultures of peritoneal cells was investigated. Even after removal of nonadherent cells from the cultures, eosinophils were retained (7–15%) and survived for at least 24 h (Fig. 2). To investigate whether the presence of eosinophils in culture affects macrophage phenotype, eosinophils were depleted from freshly isolated peritoneal cells using the anti-Siglec F-PE antibody and anti-PE microbeads. Mock-depleted cells (control) were stained with anti-Siglec F-PE but not with anti-PE microbeads. Prior to depletion, elicited peritoneal exudates contained ∼41.1% eosinophils, whereas following depletion, the percent eosinophil was reduced to 0.6% (Fig. 3). Moreover, after 24 h in culture, the mock eosinophil-depleted cells contained 8% eosinophils, whereas the eosinophil-depleted cultures had a pure macrophage culture with no detectable eosinophils. At 24 h of culture, depletion of eosinophils had no effect on macrophage expression of CD11b, CD11c, F4/80, MHC class II, CD40, CD86, TLR2, and TLR4 as compared with macrophages in the mock-treated cells (data not shown). These data show that simply removing nonadherent cells is not sufficient for providing reliable macrophage homogeneity in cultured peritoneal cells.
Figure 2. Eosinophils are retained in in vitro cultures of thioglycollate-elicited peritoneal cells.
Cells were analyzed 72 h after the injection of 1 ml 4% thioglycollate (Fresh, left column), after 1 h in culture and removal of nonadherent cells (Adherent-1 h, middle column), or after 24 h in culture and removal of dead and nonadherent cells (Adherent-24 h, right column). Graph represents three or more independent experiments. The data are mean percentage ± sem.
Figure 3. Eosinophil depletion from thioglycollate-elicited peritoneal cells.
(Upper row) Flow cytometric analysis of eosinophil content of freshly isolated peritoneal cells in the mock-depleted (left), depleted (middle), and flow-through (right) fractions. Contour plots show cells after gating on live/singlets (as shown in Fig. 1A). Numbers on the contour plots represent percentages of the parent population. (Middle row) Phase-contrast photomicrograph of cultured peritoneal cells. (Bottom row) Immunofluorescent photomicrographs of the corresponding phase-contrast images. Siglec F-PE staining is shown in red; nuclei are stained in blue with Hoechst 33342. Arrows indicate eosinophils.
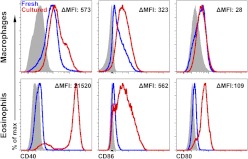
Previous studies have suggested that eosinophils interact with T cells and may be involved in antigen presentation during inflammation [15, 16]. However, there was virtually no expression of activation markers, including CD40, on eosinophils immediately isolated from the thioglycollate-stimulated peritoneal cavity. In contrast, cultured eosinophils showed increased expression of CD40, CD80, and CD86 (Fig. 4) that was independent of the method of isolation, such as FACS, MACS, or culturing with or without macrophages. Taken together, these data suggest that contamination of the macrophage cultures with eosinophils does not affect macrophage phenotype. In contrast, cultured eosinophils showed up-regulation of the activation markers. Thus, it is unknown whether the eosinophils are innocent bystanders or can affect the readouts of in vitro assays on cultured peritoneal macrophages.
Figure 4. Activation of macrophages and eosinophils in culture.
Activation markers are up-regulated on cultured thioglycollate-elicited peritoneal cells. ΔMean fluorescence intensity (MFI) was calculated as [(MFIcultured stain−MFIcultured FMO)−(MFIfresh stain−MFIfresh FMO)]. Gray-filled histograms represent FMO control, blue histograms represent freshly isolated cells, and red histograms represent peritoneal cells cultured for 24 h.
Presence of eosinophils in the cultures of thioglycollate-elicited peritoneal cells affects response to TLR stimulation
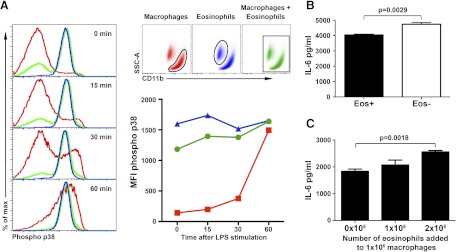
Our data suggest that eosinophils do not affect the activation status of macrophages; however, it is unknown whether eosinophils can alter macrophage functional responses. Mock- and eosinophil-depleted cultures were rested for 1 h and stimulated with LPS, and the levels of active p38 and Akt were measured using intracellular flow cytometry (Fig. 5A). Separate analysis of macrophages and eosinophils in depleted and control cultures revealed a similar pattern of p38 activation, namely that stimulation with LPS increased the levels of phosphorylated p38 in macrophages but not in eosinophils. However, when activation of p38 was analyzed in macrophages without first gating out eosinophils, as would occur using Western blot analysis or Luminex-based assays, depleted and control cultures responded differently. The cultures depleted for eosinophils reproduced the response seen in macrophages, whereas control cultures containing eosinophils revealed markedly reduced levels of p38 activation in response to LPS stimulation (Fig. 5A). Similar data were observed for phosphorylated Akt (Supplemental Fig. 1) and NF-κB (data not shown). The influence of eosinophils on cytokine production in cultures of thioglycollate-elicited peritoneal cells was also investigated. Peritoneal cultures depleted for eosinophils produced more IL-6 (3492±115.1 vs. 4402±76.67 pg/mL; P=0.0028) and TNF-α (8089±101.7 vs. 9483±233.7 pg/mL; P=0.0054) compared with control mock-depleted cultures (Fig. 5B, and data not shown). However, as the total number of cells/culture was the same between groups, these differences can be attributed to the number of macrophages in the cultures. To address this possibility, we plated the same number of macrophages (1×10⁶/well), added eosinophils in a dose-dependent manner, and then stimulated cells with LPS (Fig. 5C). Peritoneal cultures containing eosinophils produced more IL-6 and TNF-α as more eosinophils were added to the culture, whereas the macrophage numbers were static (Fig. 5C). Taken together, these data indicate that adherent nonmacrophage cells remaining in culture, namely eosinophils, are not innocent bystanders. Failure to exclude them from analysis significantly skews assessment of the phenotype and activation status of stimulated macrophages. Although eosinophil data may be subtracted in some forms of analysis, such as flow cytometry, other assays do not allow separation of data for accurate interpretation. Finally, we now show that eosinophils are capable of directly altering macrophage activity, even at levels normally generated from a thioglycollate-stimulated peritoneal cavity, as depleted cultures had higher levels of inflammatory cytokines than those that were mock-treated.
Figure 5. Functional response of the cultured peritoneal macrophages.
(A) Activation (phosphorylation) of p38 kinase in response to stimulation with LPS. Representative histograms of macrophages (red) and eosinophils (blue) that were cultured together but subsequently analyzed with or without first gating out eosinophils (green). Quantification of p38 activation upon stimulation with LPS. The data represent MFI. (B) IL-6 production by cultured peritoneal cells with or without eosinophils. The data represent a mean ± sem. Comparison was performed using Student's unpaired two-tailed t test. (C) IL-6 production by the macrophages cultured with eosinophils in a dose-dependent fashion. The data are mean ± sem.
DISCUSSION
Despite the fact that the thioglycollate-elicited peritoneal cavity model has been widely used for more than 50 years [6], there have been few studies that addressed the impact of other cell types on macrophage function. Further, the purity of macrophages may have been overestimated, as it is now clear that additional cell types in the peritoneal cavity express antigens that were thought to be macrophage-specific. Here, we characterized thioglycollate-elicited peritoneal cells using multiparameter flow cytometry. Our study demonstrates that reliance on one or two markers typically associated with macrophages, such as CD11b and F4/80, will lead to an overestimation of the percentage of macrophages in the thioglycollate-elicited peritoneal cavity. Eosinophils are one of the main contributing cells in the thioglycollate-elicited peritoneal cavity, and they express intermediate levels of CD11b and F4/80. Whereas previous studies have suggested that CD11bint/F4/80int/SSChi may be macrophages or a precursor of macrophages [9], our data now clearly discount this notion and show that they are eosinophils. Thus, we propose that studies using freshly isolated thioglycollate-elicited peritoneal cells should use CD11b versus SSC dot plots, which can easily identify eosinophils, whereas those using cultured peritoneal cells, where identification of eosinophils is more complicated, should add eosinophil-specific antibodies, such as anti-Siglec F antibody.
Eosinophils are present in large quantities, not only in freshly isolated, thioglycollate-elicited peritoneal cells but also in cultures of peritoneal macrophages. The presence of eosinophils may affect the result and interpretation of LPS-induced cytokine production and kinase activation in cultured macrophages. These data suggest that elimination of eosinophils for assays that examine macrophage function may be more beneficial for data analysis. One of the best examples of a potential misinterpretation of data relating to macrophage function has been the SHIP−/− mouse. Previous studies have suggested that macrophages lacking Ship fail to become classically activated and are skewed toward the alternatively activated phenotype [17]. However, recent studies have now demonstrated that this effect is not mediated by an intrinsic defect of Ship in macrophages but a result of the high expression of IL-4 in Ship−/− basophils, contaminating macrophage cultures [18]. These studies highlight issues that may arise when comparing two genotypes whose macrophages have substantially altered responses to microenvironments established by other cells such as eosinophils. One can envision how cocultured eosinophils may have mild effects on the response to stimulation of a wild type macrophage but may significantly skew that of another genotype. This may lead to erroneous conclusions about the role of the gene in macrophages themselves, whereas the root cause of their altered phenotype is really the defect in eosinophils.
In summary, this study has revealed that macrophage frequency in thioglycollate-elicited peritoneal cells is significantly less than was reported previously as a result of the coexistence of eosinophils expressing CD11b and F4/80. Eosinophils are the main contaminating cell types in peritoneal macrophage cultures and may affect the outcomes of in vitro assays. Collectively, our data suggest that for optimal results, eosinophils should be deleted prior to performing studies using thioglycollate-elicited peritoneal macrophages.
Supplementary Material
ACKNOWLEDGMENTS
The study was performed with support of U.S. National Institutes of Health grants to H.P. (AR050250, AR054796, AI092490, HL108795) and by funds from Northwestern University. Cell imaging was performed at the Northwestern University Cell Imaging Facility located in the Robert H. Lurie Comprehensive Cancer Center and supported by a grant from the National Cancer Institute (CA060553). The authors thank Ryan Duggan at University of Chicago Flow Cytometry Facility and for assistance with cell sorting and Dr. Angelica K. Gierut for valuable critique and discussion of the project.
The online version of this paper, found at www.jleukbio.org, includes supplemental information.
- Abbreviations: FMO
- fluorescence minus one
- FSC-A
- forward-scatter-area
- FSC-H
- forward-scatter-height
- SHIP
- Src homology 2-containing inositol 5-phosphatase
- SSC
- side-scatter
AUTHORSHIP
A.V.M. and H.P. initiated the study, analyzed the data, and wrote the manuscript. A.V.M. and R.S. performed the experiments.
REFERENCES
- 1. Schleicher U., Bogdan C. (2009) Generation, culture and flow-cytometric characterization of primary mouse macrophages. Methods Mol. Biol. 531, 203–224 [DOI] [PubMed] [Google Scholar]
- 2. Tsunawaki S., Nathan C. F. (1984) Enzymatic basis of macrophage activation. Kinetic analysis of superoxide production in lysates of resident and activated mouse peritoneal macrophages and granulocytes. J. Biol. Chem. 259, 4305–4312 [PubMed] [Google Scholar]
- 3. Ding A. H., Nathan C. F., Stuehr D. J. (1988) Release of reactive nitrogen intermediates and reactive oxygen intermediates from mouse peritoneal macrophages. Comparison of activating cytokines and evidence for independent production. J. Immunol. 141, 2407–2412 [PubMed] [Google Scholar]
- 4. Fauve R. M., Jusforgues H., Hevin B. (1983) Maintenance of granuloma macrophages in serum-free medium. J. Immunol. Methods 64, 345–351 [DOI] [PubMed] [Google Scholar]
- 5. Gallily R., Warwick A., Bang F. B. (1964) Effect of cortisone of genetic resistance to mouse hepatitis virus in vivo and in vitro. Proc. Natl. Acad. Sci. USA 51, 1158–1164 [DOI] [PMC free article] [PubMed] [Google Scholar]
- 6. Barski G., Messore G., Lepine P. (1955) [Artificial peritoneal exudate, source of cells for virus culture in vitro]. Ann. Inst. Pasteur (Paris) 89, 366–371 [PubMed] [Google Scholar]
- 7. Li Y. M., Baviello G., Vlassara H., Mitsuhashi T. (1997) Glycation products in aged thioglycollate medium enhance the elicitation of peritoneal macrophages. J. Immunol. Methods 201, 183–188 [DOI] [PubMed] [Google Scholar]
- 8. Neeper M., Schmidt A. M., Brett J., Yan S. D., Wang F., Pan Y. C., Elliston K., Stern D., Shaw A. (1992) Cloning and expression of a cell surface receptor for advanced glycosylation end products of proteins. J. Biol. Chem. 267, 14998–15004 [PubMed] [Google Scholar]
- 9. Schleicher U., Hesse A., Bogdan C. (2005) Minute numbers of contaminant CD8+ T cells or CD11b+CD11c+ NK cells are the source of IFN-γ in IL-12/IL-18-stimulated mouse macrophage populations. Blood 105, 1319–1328 [DOI] [PubMed] [Google Scholar]
- 10. Ghosn E. E., Cassado A. A., Govoni G. R., Fukuhara T., Yang Y., Monack D. M., Bortoluci K. R., Almeida S. R., Herzenberg L. A. (2010) Two physically, functionally, and developmentally distinct peritoneal macrophage subsets. Proc. Natl. Acad. Sci. USA 107, 2568–2573 [DOI] [PMC free article] [PubMed] [Google Scholar]
- 11. Vodovotz Y., Bogdan C., Paik J., Xie Q. W., Nathan C. (1993) Mechanisms of suppression of macrophage nitric oxide release by transforming growth factor β. J. Exp. Med. 178, 605–613 [DOI] [PMC free article] [PubMed] [Google Scholar]
- 12. Schindler H., Lutz M. B., Rollinghoff M., Bogdan C. (2001) The production of IFN-γ by IL-12/IL-18-activated macrophages requires STAT4 signaling and is inhibited by IL-4. J. Immunol. 166, 3075–3082 [DOI] [PubMed] [Google Scholar]
- 13. Zhang X., Goncalves R., Mosser D. M. (2008) The isolation and characterization of murine macrophages. Curr. Protoc. Immunol. Chapter 14, Unit 14.1 [DOI] [PMC free article] [PubMed] [Google Scholar]
- 14. Martinez-Pomares L., Gordon S. (2008) Murine macrophages: a technical approach. Methods Mol. Biol. 415, 255–272 [DOI] [PubMed] [Google Scholar]
- 15. Duez C., Dakhama A., Tomkinson A., Marquillies P., Balhorn A., Tonnel A. B., Bratton D. L., Gelfand E. W. (2004) Migration and accumulation of eosinophils toward regional lymph nodes after airway allergen challenge. J. Allergy Clin. Immunol. 114, 820–825 [DOI] [PubMed] [Google Scholar]
- 16. Akuthota P., Wang H., Weller P. F. (2010) Eosinophils as antigen-presenting cells in allergic upper airway disease. Curr. Opin. Allergy Clin. Immunol. 10, 14–19 [DOI] [PMC free article] [PubMed] [Google Scholar]
- 17. Rauh M. J., Ho V., Pereira C., Sham A., Sly L. M., Lam V., Huxham L., Minchinton A. I., Mui A., Krystal G. (2005) SHIP represses the generation of alternatively activated macrophages. Immunity 23, 361–374 [DOI] [PubMed] [Google Scholar]
- 18. Kuroda E., Ho V., Ruschmann J., Antignano F., Hamilton M., Rauh M. J., Antov A., Flavell R. A., Sly L. M., Krystal G. (2009) SHIP represses the generation of IL-3-induced M2 macrophages by inhibiting IL-4 production from basophils. J. Immunol. 183, 3652–3660 [DOI] [PubMed] [Google Scholar]
Associated Data
This section collects any data citations, data availability statements, or supplementary materials included in this article.


