Abstract
Abstract: Advances in swept source laser technology continues to increase the imaging speed of swept-source optical coherence tomography (SS-OCT) systems. These fast imaging speeds are ideal for microvascular detection schemes, such as speckle variance (SV), where interframe motion can cause severe imaging artifacts and loss of vascular contrast. However, full utilization of the laser scan speed has been hindered by the computationally intensive signal processing required by SS-OCT and SV calculations. Using a commercial graphics processing unit that has been optimized for parallel data processing, we report a complete high-speed SS-OCT platform capable of real-time data acquisition, processing, display, and saving at 108,000 lines per second. Subpixel image registration of structural images was performed in real-time prior to SV calculations in order to reduce decorrelation from stationary structures induced by the bulk tissue motion. The viability of the system was successfully demonstrated in a high bulk tissue motion scenario of human fingernail root imaging where SV images (512 × 512 pixels, n = 4) were displayed at 54 frames per second.
OCIS codes: (110.4500) Optical coherence tomography, (170.3880) Medical and biological imaging, (170.2655) Functional monitoring and imaging
1. Introduction
Fourier domain optical coherence tomography (FD-OCT) is becoming a well-established high-resolution biomedical imaging modality with numerous pre-clinical and clinical applications, such as real-time assessment of optimal coronary artery stent placement and as a supplement in lymph node biopsies [1–3]. Swept source OCT (SS-OCT) uses tunable lasers to sweep the wavelength of the light to interrogate the tissue, thus allowing the reconstruction of a depth-resolved axial scan (A-scan or A-line) [4]. Owing to the continuous advancement of swept source laser technology, A-scan rates exceeding multi-megahertz have been demonstrated [5]. These fast imaging speeds are beneficial for functional imaging techniques, such as speckle variance (SV) analysis for microvasculature detection, where interframe motion can cause severe imaging artifacts and loss of vascular contrast.
Speckle variance identifies microvasculature by calculating the interframe intensity variance of structural images, providing a non-invasive high sensitivity imaging technique capable of visualizing capillaries without the use of exogenous contrast agents [6]. However, practical application of using SV, including the presentation of real-time diagnostic information, is hindered by the computationally intensive signal processing required by structural and SV calculations when implemented on a serially oriented central processing unit (CPU). In comparison, commercially available graphics processing units (GPUs) are optimized for parallel data processing, and have recently been adapted to accelerate processing speeds of computationally intensive algorithms such as spectrometer-based FD-OCT [7–12]. While SV has been used to identify microvasculature for many studies, the added ability to image in real-time would open SV to assist in interventional procedures such as stroke, spinal cord injury (SCI), age-related macular degeneration (AMD) and oncology.
Here, we describe a high-speed SS-OCT imaging platform capable of real-time SV processing, display and saving at 108,000 A-scans per second. The system utilizes a polygon-based short cavity ring laser at 54 kHz, where buffering and amplification is performed to double the A-scan rate of the laser [5]. The complete SS-OCT signal processing including λ-to-k spectral resampling, fast Fourier transform (FFT), post-FFT (structural and SV) processing, and display were implemented on a GPU. In addition, subpixel image registration of structural images was performed prior to SV calculations to reduce decorrelation from stationary structures induced by the bulk tissue motion. To the best of our knowledge, this is the first demonstration of real-time high-speed functional SS-OCT, where structural images were processed and displayed at 216 (512 × 512 pixels) frames per second (fps) along with the processing and display of n = 4 averaged structural and SV images at 54 fps. This enables real-time imaging of microvasculature and allows SV to be used as an interventional guide to procedure. While the capabilities of SV OCT as an imaging tool has been demonstrated many times in the past, the added function of providing real-time information extends this technique to new applications both in preclinical and clinical settings.
2. Materials and methods
2.1. System hardware configuration
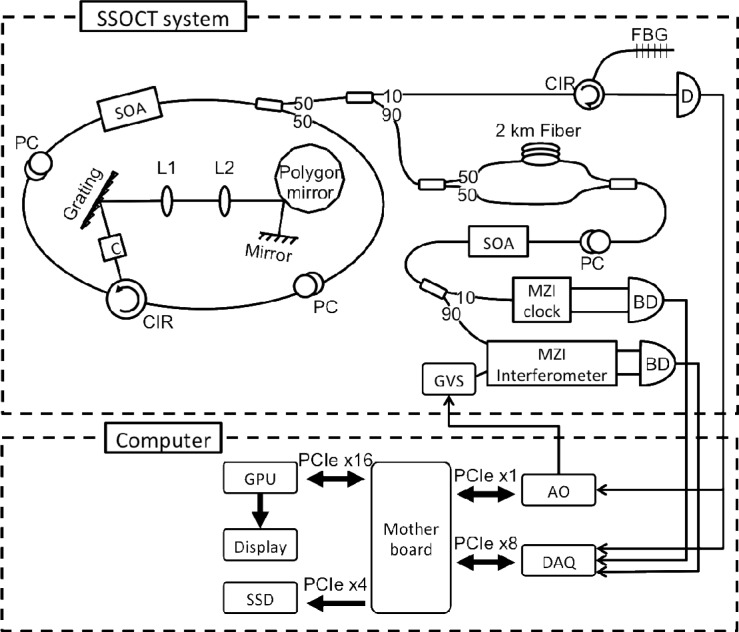
Figure 1 shows the system configuration, which consists of a swept source OCT system and a custom-built personal computer. The swept source laser design employed a buffered polygon ring cavity laser. A 600 lines/mm diffraction grating (GR25-0613, Thorlabs) was selected to create the necessary dead time between laser sweeps and enabled buffering from 54kHz to 108kHz [13]. The laser had a total output power of ~50mW, a coherence length of 3mm, and an axial resolution of 9μm in tissue. A Mach-Zehnder interferometer (MZI) was used to interrogate the biological samples, while standard techniques for triggering with a fiber Bragg grating (FBG) and recalibration with a MZI clock were used in this system [14]. The laser beam scanning was implemented using a pair of galvanometer mirrors controlled by an analog output card (PXI-6259, National Instrument), where the fast-axis sweep was driven by the FBG A-scan trigger and the slow-axis sweep was controlled by the software.
Fig. 1.
System configuration consists of a polygon filter based swept source OCT system and a custom-built personal computer, showing the bus interface between all essential hardware components to the computer motherboard. SOA: semiconductor optical amplifier; PC: polarization controller; CIR: optical circulator; C: collimator; L: lenses; FBG: fiber Bragg gratings; D: photodetector, BD: balanced detector; GVS: galvanometer pair; AO: analog output card; DAQ: data acquisition card; GPU: graphics processing unit; SSD: solid-state drive.
A custom-built personal computer housed high-end consumer-level electronic components that were specially selected and configured to enable continuous real-time acquisition, processing, and display of both structural and speckle variance data. Recalibrated fringe data can be simultaneously saved at an A-scan rate of 108kHz, taking full advantage of the laser sweep rate. The analog signals were digitized at 250MS/s by a 12-bit data acquisition card (ATS9350, Alazartech), and transferred frame-by-frame (B-scan) to the computer memory via PCIe x8 interface. The raw and recalibrated data was copied to and from the memory of a GPU (GeForce GTX 460 1GB, NVIDIA) at 3.0GB/s over PCIe x16. The final structural and speckle variance images were rendered and displayed directly off the GPU memory. Concurrently, the recalibrated data was streamed to a solid-state drive (SSD) (RevoDrive 3 X2, OCZ) at 1.3GB/s through PCIe x4.
2.2. Software development
The custom-built software was developed with Microsoft Visual C++ 2008 and the Alazartech software development kit (SDK), OpenGL, and National Instrument NiDAQmx application programming interface for acquisition, display, and galvanometer control, respectively. For signal processing, the GPU was programmed using NVIDIA’s compute unified device architecture (CUDA) toolkit and SDK 4.0 [15]. Custom CUDA kernels, in combination with built-in CUDA libraries, were used to manipulate and reconstruct structural and speckle variance OCT images on the 336 cores of the GPU. Utilizing the GPU to perform massive parallel data processing, not only dramatically enhances the data throughput when compared to processing using only the CPU, but also concurrently frees up CPU resources. Another advantage for processing data directly on the GPU is that the reconstructed OCT images can be rendered and displayed without any additional memory transactions.
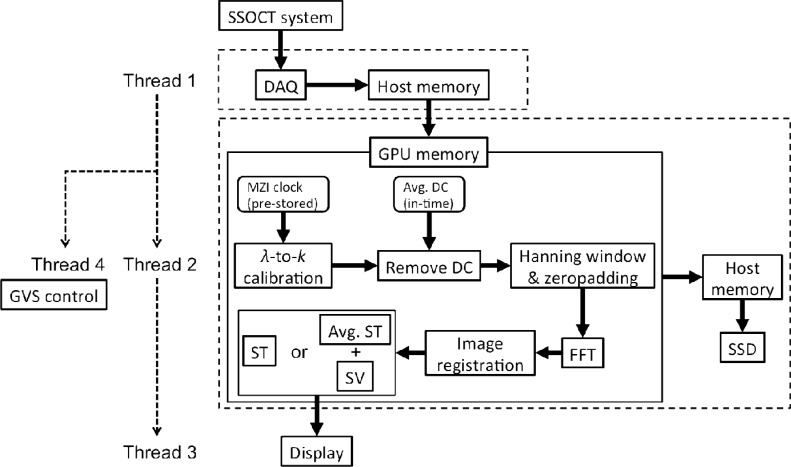
To minimize dead time between frame captures, tasks were divided into four threads, as depicted in Fig. 2 , for data acquisition (Thread 1), processing and saving (Thread 2), image display (Thread 3), and slow axis galvanometer control (Thread 4). The four threads were synchronized in a cascaded producer-consumer paradigm, where Thread 1 triggered both Thread 2 and 4, and Thread 2 triggered Thread 3 on every B-scan acquired and processed, respectively, as indicated by the dashed arrows. A circular memory buffer and two semaphores (flags to prevent simultaneous reading and writing to the same memory address) were used between Thread 1 and 2 to regulate data flow from the motherboard to the GPU. The solid arrows show the data flow through each hardware or processing kernel. In Thread 2, a MZI clock for A-scan recalibration was pre-stored on the GPU memory, whereas the average A-scan intensity of a B-scan could be updated on the fly to remove the DC noise. A Hanning window and zero padding were applied to each A-scan followed by fast Fourier transform (FFT). Either structural or averaged structural plus speckle variance OCT images were calculated and finally displayed by Thread 3. Any data that resided on the GPU memory could be continuously copied back to the host memory and transferred to the SSD for storage. The recalibrated (DC component removed) data were saved for post processing and 3D visualization purposes.
Fig. 2.
Signal processing flow chart, where the dashed arrows indicate thread triggering and solid arrows illustrate the data flow through each hardware or processing kernel. Thread 1 to 4 corresponds to data acquisition, processing and saving, display and galvanometer control thread, respectively.
Bulk tissue motion (BTM), such as cardio-respiratory motion, cannot be avoided during in vivo imaging, and this results in a lower vascular contrast in the SV images. A subpixel image registration algorithm [16] was adopted and implemented on the GPU using custom CUDA kernels and built-in CUDA libraries. The aim was to reduce the adverse effects of the BTM by digital realignment of the structural images prior to the SV calculation. The algorithm assumes 2D rigid translation between two images, and first obtains an initial estimate of whole pixel shifts using a traditional 2× upsampled FFT cross correlation technique. Subpixel shifts are then calculated using a single-step discrete Fourier transform (DFT) algorithm, where an upsampled cross correlation (by a user-defined upsampling factor, κ) is computed in 1.5 × 1.5 pixel neighborhood about the initial estimate. The use of DFT greatly reduces the memory and computational requirement when compared to traditional FFT approach.
3. Results
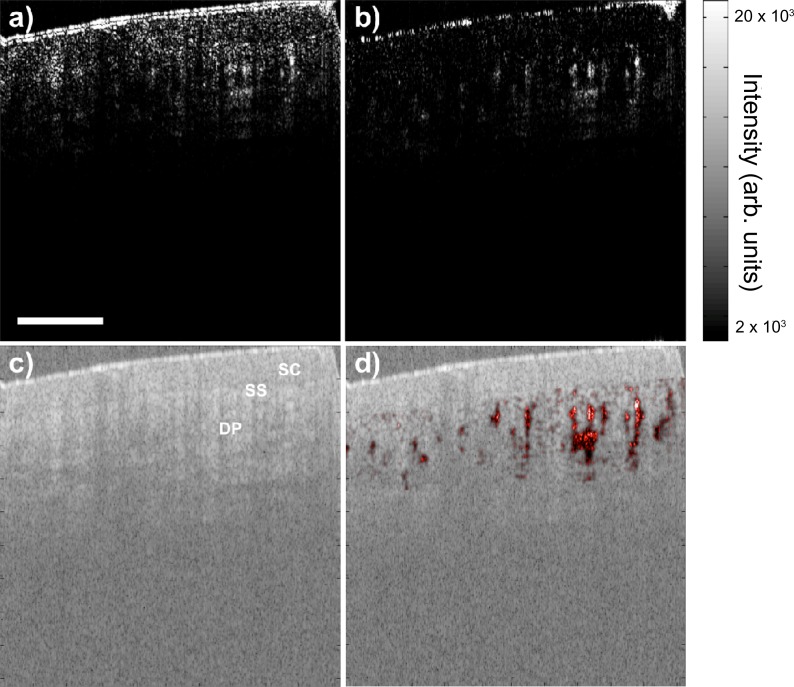
We have previously demonstrated SV in a low BTM scenario by imaging mouse dorsal skinfold window chamber, where small capillaries could be detected with relatively slow image speed of 36kHz by optimizing the SV parameters (i.e. gate length, n, or the number of frames used to calculate the SV, and frame rate, F) [6]. In this study, the viability of the fast imaging system (108kHz) was evaluated in a high BTM scenario by in vivo imaging of non-stabilized human fingernail root on a healthy volunteer. B-mode scanning and real-time display of averaged structural OCT and SV image were examined first. Each B-scan consisted of 512 A-lines spanning over 2mm. Each A-scan had 2096 and ~364 samples before and after recalibration, respectively, which was zero padded to 1024 prior to the FFT. Subpixel image registration was performed on the top center region (256 × 256) of the structural image with an upsampling factor of 100. For calculating SV in a high BTM case, a small gate length of either 2 or 4 and a fast frame rate are desired to obtain a high SV signal-to-noise ratio (SNR) [6]. While the A-line density fixed the frame rate at 216fps, the software allowed for a real-time update of the gate length between 2 to 16. A gate length of 4 was chosen to reconstruct the averaged structural OCT and SV images, as shown in Fig. 3 , at an effectively display rate of 54fps. The galvanometer sweepback is seen on the right of each image. Layers of tissue morphology could be delineated easily in the structural image, whereas microvasculature appears as high contrast regions in the SV images. Figure 3(a) (Media 1 (2.4MB, AVI) ) and 3(b) (Media 2 (2.1MB, AVI) ) compare the SV image quality with and without subpixel image registration realignment, clearly showing less bulk tissue signal and higher vascular contrast in the realigned image.
Fig. 3.
B-mode SV image (a) without (Media 1 (2.4MB, AVI) ) and (b) with (Media 2 (2.1MB, AVI) ) subpixel image registration realignment displayed at 54fps during human fingernail fold imaging. (c) Corresponding real-time structural OCT image. (d) Structural image overlaid with SV image (b) in post-processing. Different layers of tissue can be delineated easily in the structural image, while microvasculature can be clearly visualized in the SV image. SC: stratum corneum; SS: stratum spinosum; DP: dermal papillae. Scale bar is 500μm.
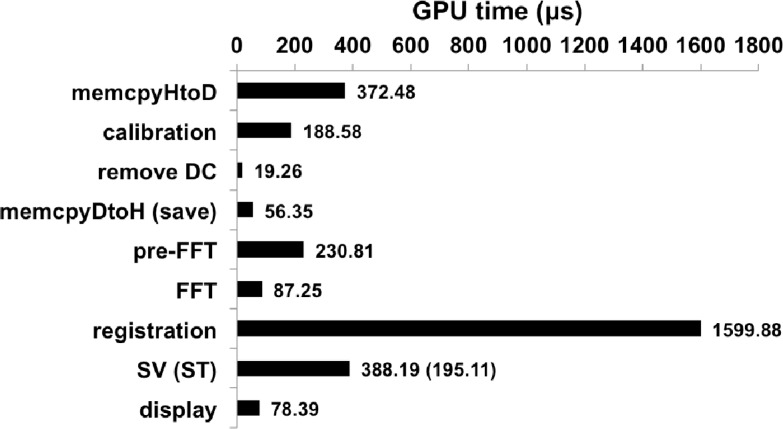
With the same B-mode imaging parameters as above, the software performance was analyzed using the CUDA’s built-in visual compute profiler 4.2, which provided detailed timing statistics of each kernel executed on the GPU as shown in Fig. 4 . The longest possible processing path was considered by including all data transfers to and from the GPU, subpixel image registration, and SV calculation on the nth frame. The GPU times were the average of 100 kernel calls, and the total processing time per SV image was ~3.02ms. This processing speed can theoretically support a 169kHz SS-OCT system at 2096 samples per A-scan. The most time-consuming step was the image registration algorithm, which took 1.6ms to complete. Compared with a CPU implementation reported by Guizar-Sicairos et al. [16] which employed the same algorithm (image size of 256 × 256, and an upsampling factor κ = 25), our GPU implementation with κ = 100 is two orders of magnitude faster. SV calculation and data transfer to the GPU took 388μs and 372μs, respectively, making these tasks the second and third most time-consuming step. The GPU time for the SV calculation is independent of the number of frames used. This is because the mean structural OCT and the sum of squares are calculated as each frame is being acquired, and on the nth frame the same number of arithmetic operations are performed to produce the SV image. It is worthwhile to note that the structural image calculation only took 195μs, and for normal structural OCT imaging, where image registration is not essential, the processing time becomes ~1.23ms, which can theoretically support a 416kHz system. Approximately 30MB of GPU memory was allocated to process each B-scan of 2.15MB in size. Such low memory requirement allows for this parallelized implantation through standard, commercially available GPUs. Finally, each recalibrated B-scan contained ~745kB of data and took on average 573μs to transfer to the solid state drive. This data transfer is relatively time-consuming and will require its own dedicated thread to hide this latency for larger data sizes.
Fig. 4.
Time expenditure of each processing step preformed on the GPU in the order of execution as shown in Thread 2 of Fig. 2. The total average processing time was 3.02ms for each SV image (512 × 512 pixels, n = 4) with registration image size of 256 × 256. memcpyHtoD and memcpyDtoH are data transfer to and from the GPU, respectively.
To test the 3D SV imaging capability the real-time data saving function, 10,000 B-scans (512 A-lines in each B-scan) of recalibrated data covering a 2mm-by-2mm region were saved for post-processing. Data transfer did not degrade the software performance, which provided the shortest time delay between adjacent frames, and hence the higher SV SNR. In our previous study [6], a 50% decrease in variance signal was observed when the frame step size was the same as the beam spot size. Here, the large number of frames corresponded to a 0.2µm step size, which was 65× smaller than the beam spot size of 13µm.
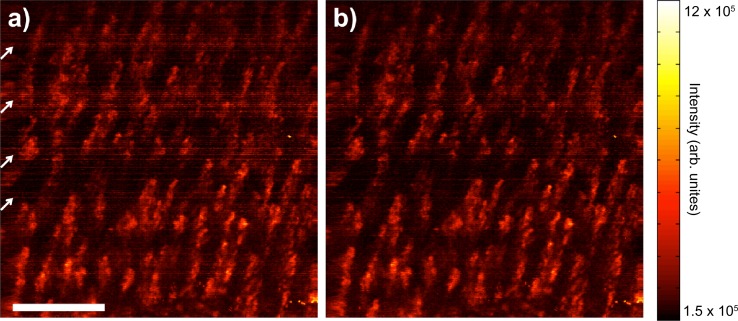
In post-processing, the same steps were followed as in real-time processing. Figure 5(a) shows an en face 2D SV projection image in which the high contrast regions closely resemble capillary loops commonly observed in nailfold capillaroscopy [17]. The projection image is a summation over 860μm starting from 310μm below the tissue surface. Motion artifacts due to heartbeat and breathing can be seen as periodic horizontal striations (indicated by the white arrows) resulted from an increase of the noise floor of the entire SV image and adjacent frames. Figure 5(b) shows the projection image after the structural images are realignment using the image registration algorithm, which improved the image quality via the removal of the periodic striation noise.
Fig. 5.
2D SV projection image (a) without and (b) with structural image realignment using subpixel image registration algorithm. Motions during imaging appeared as periodic horizontal striations (indicated by the white arrows on left hand side) that increased the noise floor, while lowering the vascular contrast and overall image quality. The image registration algorithm reduced these effects, while improving the overall image quality. Scale bar is 500μm.
4. Discussion
In using image registration to realign the structural data, it was assumed that the motion was non-deformable and had no rotational components. It was further assumed that out-of-plane motion was limited due to our relatively high imaging speed and because there is no available method to account for this type motion. The cross correlation algorithm revealed subpixel and pixel size movements in the lateral and axial direction, respectively, in all adjacent B-scans. This corresponded to a <10-20 micron shift between frames. Our imaging speed of 216fps was sufficient in capturing this motion smoothly and the resultant change in the speckle pattern, allowing the image registration algorithm to improve the image quality. In an application where motion in 3D space is equally likely, the requirement for faster image speed becomes ever more stringent for clinical applications.
SV and related methods have assisted functional magnetic resonance imaging in measuring functional hyperemia and cerebral blood flow in rat models [18,19]. This combination helps to identify pathological changes in stroke, Alzheimer’s, and brain injuries, but traditionally long processing times limit SV to preclinical studies. The ability to image microvasculature in real-time would allow SV to move beyond stroke research and perhaps guide interventional procedures for stroke patients as changes in microvasculature during and prior to treatment highlight progression of the effects of stroke. Another potential application of a high-frame rate SV SS-OCT system includes the intra-operative evaluation of damaged vasculature after spinal cord injury.
In addition, microvasculature in the retina and the choroid have been mapped by SV for the study of retinal diseases, specifically diabetic retinopathy and AMD [20,21]. One treatment for AMD is the use of anti-vascular endothelial growth factor (VEGF) drugs, which reduces VEGF responsible for stimulating growth in new blood vessels [22]. In this case, the ability of real-time SV imaging could be used to help guide intra-vitreal injections of anti-VEGF drugs and subsequently monitor changes in the microvasculature.
Finally, microvasculature imaging is also important for the identification and treatment of various types of cancer. Tumor growth often results in increased blood flow to cancerous regions and thus certain treatment methods focus on the disruption of the tumor microvasculature [23]. Whereas previous imaging of microvasculature only provided before and after information of the treatment, functional imaging with SV has the potential to show changes during treatments such as photodynamic therapy [24].
5. Conclusion
In summary, a real-time high speed SV SS-OCT imaging system using an NVIDIA GPU was demonstrated. An A-scan rate of 108kHz was fully utilized, allowing structural images (512 × 512 pixels) to be acquired, processed, and displayed at 216 fps, and SV images at 56 fps, which demonstrated excellent flow sensitivity capable of distinguishing microcirculation from the non-stabilized bulk tissue in a human fingernail fold. In addition, subpixel image registration algorithm digitally reduced the BTM and significantly improved the SV image quality. Whereas SV has been limited in the past by processing times to preclinical studies, real-time SV opens new potential applications include guiding interventional procedures for stroke, SCI, AMD, and oncology. In these cases, microvascular changes can be monitored without the implementation of gating or post-processing. Our custom-built software has been designed to be versatile, such that it can work for both non-linear and linear swept source laser systems. On-going research includes combining our software with higher resolution and faster OCT systems to achieve real-time 3D microvasculature display that may be packaged with existing interstitial or catheter technology to provide real-time in vivo microvasculature rendering of deeply situated organs.
Acknowledgments
The authors acknowledge funding support from the National Sciences and Engineering Research Council of Canada, Early Research Award Ontario, and Mitacs. In addition, we would like to thank Mr. Muneeb Khalid, President. Alazar Technology Inc., for the continuing technical support.
References and links
- 1.Bouma B. E., Tearney G. J., Yabushita H., Shishkov M., Kauffman C. R., DeJoseph Gauthier D., MacNeill B. D., Houser S. L., Aretz H. T., Halpern E. F., Jang I.-K., “Evaluation of intracoronary stenting by intravascular optical coherence tomography,” Heart 89(3), 317–320 (2003). 10.1136/heart.89.3.317 [DOI] [PMC free article] [PubMed] [Google Scholar]
- 2.Zysk A. M., Nguyen F. T., Oldenburg A. L., Marks D. L., Boppart S. A., “Optical coherence tomography: a review of clinical development from bench to bedside,” J. Biomed. Opt. 12(5), 051403 (2007). 10.1117/1.2793736 [DOI] [PubMed] [Google Scholar]
- 3.Luo W., Nguyen F. T., Zysk A. M., Ralston T. S., Brockenbrough J., Marks D. L., Oldenburg A. L., Boppart S. A., “Optical biopsy of lymph node morphology using optical coherence tomography,” Technol. Cancer Res. Treat. 4(5), 539–548 (2005). [DOI] [PubMed] [Google Scholar]
- 4.Yun S., Tearney G., de Boer J., Iftimia N., Bouma B. E., “High-speed optical frequency-domain imaging,” Opt. Express 11(22), 2953–2963 (2003). 10.1364/OE.11.002953 [DOI] [PMC free article] [PubMed] [Google Scholar]
- 5.Wieser W., Biedermann B. R., Klein T., Eigenwillig C. M., Huber R., “Multi-megahertz OCT: High quality 3D imaging at 20 million A-scans and 4.5 GVoxels per second,” Opt. Express 18(14), 14685–14704 (2010). 10.1364/OE.18.014685 [DOI] [PubMed] [Google Scholar]
- 6.Mariampillai A., Leung M. K. K., Jarvi M., Standish B. A., Lee K. K. C., Wilson B. C., Vitkin A., Yang V. X. D., “Optimized speckle variance OCT imaging of microvasculature,” Opt. Lett. 35(8), 1257–1259 (2010). 10.1364/OL.35.001257 [DOI] [PubMed] [Google Scholar]
- 7.Watanabe Y., Itagaki T., “Real-time display on Fourier domain optical coherence tomography system using a graphics processing unit,” J. Biomed. Opt. 14(6), 060506 (2009). 10.1117/1.3275463 [DOI] [PubMed] [Google Scholar]
- 8.Watanabe Y., “Real time processing of Fourier domain optical coherence tomography with fixed-pattern noise removal by partial median subtraction using a graphics processing unit,” J. Biomed. Opt. 17(5), 050503 (2012). 10.1117/1.JBO.17.5.050503 [DOI] [PubMed] [Google Scholar]
- 9.Zhang K., Kang J. U., “Real-time 4D signal processing and visualization using graphics processing unit on a regular nonlinear-k Fourier-domain OCT system,” Opt. Express 18(11), 11772–11784 (2010). 10.1364/OE.18.011772 [DOI] [PMC free article] [PubMed] [Google Scholar]
- 10.Zhang K., Kang J. U., “Real-time intraoperative 4D full-range FD-OCT based on the dual graphics processing units architecture for microsurgery guidance,” Biomed. Opt. Express 2(4), 764–770 (2011). 10.1364/BOE.2.000764 [DOI] [PMC free article] [PubMed] [Google Scholar]
- 11.Zhang K., Kang J. U., “Graphics processing unit accelerated non-uniform fast Fourier transform for ultrahigh-speed, real-time Fourier-domain OCT,” Opt. Express 18(22), 23472–23487 (2010). 10.1364/OE.18.023472 [DOI] [PMC free article] [PubMed] [Google Scholar]
- 12.Li J., Bloch P., Xu J., Sarunic M. V., Shannon L., “Performance and scalability of Fourier domain optical coherence tomography acceleration using graphics processing units,” Appl. Opt. 50(13), 1832–1838 (2011). 10.1364/AO.50.001832 [DOI] [PubMed] [Google Scholar]
- 13.Oh W.-Y., Vakoc B. J., Shishkov M., Tearney G. J., Bouma B. E., “>400 kHz repetition rate wavelength-swept laser and application to high-speed optical frequency domain imaging,” Opt. Lett. 35(17), 2919–2921 (2010). 10.1364/OL.35.002919 [DOI] [PMC free article] [PubMed] [Google Scholar]
- 14.Mariampillai A., Standish B. A., Moriyama E. H., Khurana M., Munce N. R., Leung M. K., Jiang J., Cable A. E., Wilson B. C., Vitkin I. A., Yang V. X. D., “Speckle variance detection of microvasculature using swept-source optical coherence tomography,” Opt. Lett. 33(13), 1530–1532 (2008). 10.1364/OL.33.001530 [DOI] [PubMed] [Google Scholar]
- 15.NVIDIA, “CUDA C Programming Guide Version 4.0,” May 2011.
- 16.Guizar-Sicairos M., Thurman S. T., Fienup J. R., “Efficient subpixel image registration algorithms,” Opt. Lett. 33(2), 156–158 (2008). 10.1364/OL.33.000156 [DOI] [PubMed] [Google Scholar]
- 17.Cutolo M., Sulli A., Secchi M. E., Paolino S., Pizzorni C., “Nailfold capillaroscopy is useful for the diagnosis and follow-up of autoimmune rheumatic diseases. A future tool for the analysis of microvascular heart involvement?” Rheumatology (Oxford) 45(4Suppl 4), iv43–iv46 (2006). 10.1093/rheumatology/kel310 [DOI] [PubMed] [Google Scholar]
- 18.Srinivasan V. J., Sakadzić S., Gorczynska I., Ruvinskaya S., Wu W., Fujimoto J. G., Boas D. A., “Depth-resolved microscopy of cortical hemodynamics with optical coherence tomography,” Opt. Lett. 34(20), 3086–3088 (2009). 10.1364/OL.34.003086 [DOI] [PMC free article] [PubMed] [Google Scholar]
- 19.Yaseen M. A., Srinivasan V. J., Sakadžić S., Radhakrishnan H., Gorczynska I., Wu W., Fujimoto J. G., Boas D. A., “Microvascular oxygen tension and flow measurements in rodent cerebral cortex during baseline conditions and functional activation,” J. Cereb. Blood Flow Metab. 31(4), 1051–1063 (2011). 10.1038/jcbfm.2010.227 [DOI] [PMC free article] [PubMed] [Google Scholar]
- 20.An L., Wang R. K., “In vivo volumetric imaging of vascular perfusion within human retina and choroids with optical micro-angiography,” Opt. Express 16(15), 11438–11452 (2008). 10.1364/OE.16.011438 [DOI] [PubMed] [Google Scholar]
- 21.Liu X., Zhang K., Huang Y., Kang J. U., “Spectroscopic-speckle variance OCT for microvasculature detection and analysis,” Biomed. Opt. Express 2(11), 2995–3009 (2011). 10.1364/BOE.2.002995 [DOI] [PMC free article] [PubMed] [Google Scholar]
- 22.Neri P., Mariotti C., Arapi I., Bambini E., Giovannini A., “Anti vascular endothelial growth factor sequential therapy for neovascular age-related macular degeneration: is this the new deal?” Curr. Med. Res. Opin. 28(3), 395–400 (2012). 10.1185/03007995.2012.662153 [DOI] [PubMed] [Google Scholar]
- 23.Ibrahim N., Yu Y., Walsh W. R., Yang J.-L., “Molecular targeted therapies for cancer: sorafenib mono-therapy and its combination with other therapies (review),” Oncol. Rep. 27(5), 1303–1311 (2012). [DOI] [PubMed] [Google Scholar]
- 24.Standish B. A., Lee K. K. C., Jin X., Mariampillai A., Munce N. R., Wood M. F. G., Wilson B. C., Vitkin I. A., Yang V. X. D., “Interstitial Doppler optical coherence tomography as a local tumor necrosis predictor in photodynamic therapy of prostatic carcinoma: an in vivo study,” Cancer Res. 68(23), 9987–9995 (2008). 10.1158/0008-5472.CAN-08-1128 [DOI] [PubMed] [Google Scholar]


