

Transcription-associated recombination (TAR) is crucial for stability among repeated units of rDNA. Several histone deacetylases and a chromatin architectural component control the synthesis of ncRNA and rDNA recombination. The only acetylation state of histone H4 at Lys-16 is sufficient to regulate TAR at rDNA.
Abstract
Transcription-associated recombination is an important process involved in several aspects of cell physiology. In the ribosomal DNA (rDNA) of Saccharomyces cerevisiae, RNA polymerase II transcription–dependent recombination has been demonstrated among the repeated units. In this study, we investigate the mechanisms controlling this process at the chromatin level. On the basis of a small biased screening, we found that mutants of histone deacetylases and chromatin architectural proteins alter both the amount of Pol II–dependent noncoding transcripts and recombination products at rDNA in a coordinated manner. Of interest, chromatin immunoprecipitation analyses in these mutants revealed a corresponding variation of the histone H4 acetylation along the rDNA repeat, particularly at Lys-16. Here we provide evidence that a single, rapid, and reversible posttranslational modification—the acetylation of the H4K16 residue—is involved in the coordination of transcription and recombination at rDNA.
INTRODUCTION
In all eukaryotes transcription-associated recombination (TAR) governs fundamental processes such as cell viability, cell identity, and genome stability (Aguilera and Gómez-González, 2008; Gottipati and Helleday, 2009). In Saccharomyces cerevisiae TAR is particularly important at the ribosomal DNA (rDNA) array, which is composed of repeated sequences that can easily undergo genomic rearrangements caused by unequal recombination.
The rDNA is organized into ∼150–200 units repeated in tandem on chromosome XII (Petes, 1979). On each unit, RNA polymerases (Pols) I and III transcribe 35S and 5S ribosomal RNAs, respectively. The Pol I– and Pol III–transcribed sequences are interrupted by nontranscribed spacers (NTSs), which contain cis-regulatory elements for the control of DNA replication (the autonomous replication sequence) and transcription (the 35S and 5S promoters, as well as a putative enhancer; Figure 1; Nomura, 2001).
FIGURE 1:

Schematic map of ribosomal genes in S. cerevisiae. Horizontal black arrows, RNA transcripts. Filled black boxes, 35S and 5S coding units. Gray boxes, E-PRO and C-PRO promoters. White box, putative transcriptional enhancer. ARS, origin of DNA replication. Ellipses, positioned nucleosomes (Vogelauer et al., 1998). Thin horizontal white arrow, strand-specific oligonucleotide used in the RT-PCR reactions. Thick black lines, PCR amplicons produced in ChIP analyses.
Because the ribosomal RNAs are essential to support protein synthesis, the number and sequence identity of their genes are actively maintained by the cells. Homologous recombination ensures this; however, mitotic recombination among the repeated units must be tightly regulated to avoid genome instability (Kobayashi, 2006; Ganley and Kobayashi, 2007).
Kobayashi and Ganley (2005) proposed a model of TAR at rDNA in which RNA Pol II transcription of NTS induces unequal recombination through the dissociation of cohesin complexes from aligned sister chromatids. This process can result in two different outcomes: intrachromatid recombination, which generates extrachromosomal ribosomal circles (ERCs); or interchromatid recombination between misaligned sister chromatids, which gives rise to rDNA copy number variation (Kobayashi and Ganley, 2005). Both these events have been shown to determine aging in yeast (Sinclair and Guarente, 1997; Ganley et al., 2009).
RNA Pol II transcription of rDNA starts from two promoters, called C-PRO and E-PRO, lying at the beginning and at the end of the 35S coding sequence, respectively (Figure 1; Santangelo et al., 1988; Kobayashi and Ganley, 2005; Li et al., 2006). Pol II transcription from the E-PRO and C-PRO promoters generates noncoding RNAs (ncRNAs; Li et al., 2006; Houseley et al., 2007; Vasiljeva et al., 2008). ncRNA expression has been shown to be associated with altered ribosomal recombination in different genetic backgrounds (Kobayashi and Ganley, 2005; Houseley et al., 2007; Vasiljeva et al., 2008).
In a wild-type cell the synthesis of these ncRNAs appears to be transcriptionally repressed. Previous reports showed the existence of Pol II transcriptional repression at rDNA. In 1997 a form of transcriptional silencing was shown for reporter genes, transcribed by Pol II, artificially inserted in the ribosomal locus (Bryk et al., 1997; Smith and Boeke, 1997). A number of genes were shown to control this kind of ribosomal transcriptional silencing (Smith et al., 1999), most of which regulate chromatin structure and dynamics: the core histones and the histone chaperone CAC1 (Bryk et al., 1997; Smith et al., 1999), the histone deacetylases Rpd3p and Sir2p (Bryk et al., 1997; Smith et al., 1999; Straight et al., 1999; Sun and Hampsey, 1999), the chromatin-remodeling complexes Isw1 and Isw2 (Mueller and Bryk, 2007; Mueller et al., 2007), and the histone methyltransferase Set1p (Bryk et al., 2002).
Of interest, mutations in the NAD+-dependent histone deacetylase Sir2p increase both ncRNA transcription and ribosomal recombination (Kaeberlein et al., 1999; Li et al., 2006). The chromatin structure of sir2Δ strains shows hyperacetylation and hyperaccessibility to micrococcal nuclease digestion at rDNA (Fritze et al., 1997; Cioci et al., 2002). These observations suggest that ncRNA transcription and recombination of ribosomal genes may be under chromatin-mediated control. However, the relationship between chromatin modifications and transcription-associated recombination at rDNA has not been clearly characterized.
To gain further understanding on the role of chromatin in homologous recombination and ncRNA transcription in the ribosomal cluster, we investigated these molecular events in mutants of histone deacetylases and chromatin architectural factors.
RESULTS
ERC production is controlled by several chromatin regulators
The involvement of chromatin in the control of both ribosomal ncRNAs transcription and rDNA recombination is particularly evident in the sir2Δ mutant. This strain shows a loss of silencing phenotype with ncRNA accumulation (Bryk et al., 1997; Li et al., 2006). Moreover, its ribosomal repeats are highly unstable, with frequent intrachromatid recombination events generating ERCs (Gottlieb and Esposito 1989; Kaeberlein et al., 1999). The accumulation of ERCs in sir2Δ cells is one of the causes of their shortened lifespan (Kaeberlein et al., 1999). Considering that Sir2p is a histone deacetylase (Imai et al., 2000; Suka et al., 2002) and that the mutant's chromatin is hyperaccessible (Fritze et al., 1997; Cioci et al., 2002), we tried to clarify the role of histone acetylation and chromatin structure in recombination, in terms of ERCs formation, and in ncRNA transcription. To accomplish this task, we performed a biased screening, starting from the measure of ERCs on selected chromatin mutants (Figure 2).
FIGURE 2:

Chromatin regulators control ERC formation. (A) Southern analysis of ERC species. DNA was isolated from the specified yeast strains or after 16 h treatment with 500 μM NAM, and probed with a radiolabeled rDNA sequence. ERCs are indicated by arrows. The differences in the migration of bands corresponding to ERCs are due to different durations of electrophoretic migration. (B) Quantification of ERC amount. Averages and SDs of at least three independent experiments are reported. Two-tailed t test was applied for statistical analysis. Asterisks indicate statistically relevant differences; α = 0.05. The p values are as follows: sir2, p = 0.0419; NAM, p = 0.0086; rpd3, p = 0.0454; hst1, p = 0.1388; hst2, p = 0.6499; hst3, p = 0.0083; hst4, p = 0.1529; nhp6ab, p = 0.0474.
The HST1-4 genes code for NAD+-dependent histone deacetylases, which share a significant sequence identity with the SIR2 gene (Brachmann et al., 1995), giving rise to the S. cerevisiae sirtuin family. We measured ERCs on single mutants of SIR2 and HST1-4 genes and on a panel of other strains as follows. First, we analyzed WT cells treated with 500 μM nicotinamide (NAM), a sirtuin noncompetitive inhibitor that increases rDNA recombination and shortens replicative lifespan (Bitterman et al., 2002). Second, we extended the study to the mutant in a Zn+-dependent histone deacetylase, Rpd3p, unrelated to sirtuins. This enzyme antagonizes Sir2p in the establishment of silenced chromatin at telomeres, HM loci, and rDNA (Smith et al., 1999; Sun and Hampsey, 1999; Zhou et al., 2009; Ehrentraut et al., 2010), and a mutation in the RPD3 gene decreases the level of genomic recombination (Dora et al., 1999). Finally, we investigated the involvement of high-mobility-group Nhp6p proteins, which are chromatin architectural factors (Stillman, 2010). The double mutation of NHP6A and NHP6B genes results in a decreased amount of histones, which determines chromatin hyperaccessibility (Celona et al., 2011) and ERC accumulation, with a consequent shortened lifespan (Giavara et al., 2005).
To measure ERCs, we subjected whole genomic DNA purified from logarithmically growing cultures to electrophoresis and transferred it to a nitrocellulose filter by Southern blotting. The ERC species are detected as fast-migrating bands after hybridization with a radiolabeled probe (arrows in Figure 2A). Quantification of ERCs, obtained by normalizing the ERC level to the loaded genomic amount of each strain, is reported in Figure 2B. The graphs show the ERCs amount for each strain, or treatment, relative to the isogenic WT or untreated sample, indicated as 1. Data presented in this form allow a direct evaluation of fold changes in the different genetic backgrounds.
The sir2Δ strain shows increased ERCs levels, as previously described (Kaeberlein et al., 1999). In addition, NAM treatment of WT cells results in ERC accumulation, demonstrating that sirtuin catalytic activity is crucial to repressing recombination at rDNA. This finding was previously reported by measuring the rate loss of marker genes integrated at rDNA (Bitterman et al., 2002). Here we confirm the data specifically for intrachromatid recombination, which leads to ERC production.
Conversely, we observed almost complete absence of ERCs in cells lacking the histone deacetylase Rpd3p. As far as the HST1-4 sirtuins are concerned, we observed a significant increase in ERC amount in the hst3 mutant, whereas the extent of ERC formation was not affected by the other hst gene deletions. Finally, the nhp6ab double mutation enhances recombination at rDNA, as expected (Giavara et al., 2005).
Taken together, these data indicate that rDNA recombination is suppressed by HST3 and NHP6AB gene activity, besides that of the known SIR2. Moreover, global deacetylation activity on account of Rpd3p seems to be correlated with ERC production.
Altered ERC production corresponds to changes in ncRNA transcription
Previous studies indicated that the synthesis of ncRNAs at rDNA mediated by RNA polymerase II is related to instability of the ribosomal array. The most accepted model suggests that recombination regulation among the repeated units of the ribosomal cluster is achieved through ncRNA transcription (Kobayashi and Ganley, 2005).
To show whether ERC accumulation is stimulated by ncRNA transcription in our mutants, we analyzed the ribosomal ncRNA produced from the bidirectional promoter E-PRO (Figure 3A). In fact, E-PRO activity is directly involved in rDNA recombination, which is abolished when E-PRO is deleted or replaced with a unidirectional promoter (Kobayashi and Ganley, 2005). The NTS1-R ncRNA (Figure 3A) level was measured by reverse transcription-PCR (RT-PCR), using a strand-specific primer. PCR coamplification with an oligo pair for ACT1 was performed in order to normalize the data. Figure 3B reports the ncRNA level for each mutant and condition, expressed as ratio relative to the isogenic WT or untreated sample, respectively.
FIGURE 3:

ERC formation is stimulated by ncRNA transcription. (A) Schematic map of the rDNA unit. Thin horizontal black arrows, ncRNAs produced from E-PRO and C-PRO promoters. Horizontal white arrow, oligo NTS1-R used in the strand-specific RT-PCR. (B) Quantification of the ncRNA expression level. The histograms indicate the averages and SDs from three independent experiments. Two-tailed t-test was applied for statistical analysis. Asterisks indicate statistically relevant differences; α = 0.05. The p values are as follows: sir2, p = 0.0006; NAM, p = 0.002; rpd3, p = 0.0013; hst1, p = 0.0703; hst2, p = 0.1451; hst3, p = 0.0047; hst4, p = 0.125; nhp6ab, p = 0.0454.
SIR2 deletion leads to a twofold increase in the ncRNA expression, as previously reported (Li et al., 2006). In addition, the NAM treatment causes an up-regulation of ncRNA, even though the effect is less marked than in the sir2Δ mutant. The rpd3 mutant strain shows a significant reduction in ncRNA levels, consistent with the demonstrated role of this histone deacetylase in counteracting rDNA transcriptional silencing (Smith et al., 1999; Sun and Hampsey, 1999). The hst3 mutant accumulates ncRNA. On the contrary hst1Δ, hst2Δ, and hst4Δ strains show only slight differences in the production of this ncRNA transcript. Moreover, Pol II transcription of rDNA in the nhp6ab double mutant is threefold higher than its isogenic WT, providing the first evidence of the involvement of the high-mobility-group proteins in the regulation of ncRNA production.
Of interest, we observed strong correspondence between ERC production (Figure 2) and ncRNA expression profiles (Figure 3) in the analyzed chromatin mutants. In fact, mutants that produce more ERCs (sir2, hst3, and nhp6ab) also show elevated levels of ncRNA transcription. On the other hand, in the rpd3 mutant, rDNA recombination is partially suppressed and ncRNA expression significantly decreased.
In the mutants studied, the data are consistent with the model according to which ERC production is stimulated by ncRNA transcription (Kobayashi and Ganley, 2005).
Histone H4 acetylation correlates with ERC and ncRNA production
The foregoing data suggest a strong influence of the chromatin regulators (histone deacetylases and chromatin architectural factors) on the control of rDNA recombination mediated by ncRNA transcription. This last process was shown to be associated with changes in the histone acetylation pattern at rDNA (Cesarini et al., 2010).
To uncover the relationship between histone acetylation and transcription-induced recombination at rDNA, we analyzed the global acetylation level of histone H4 in all our strains. Indeed, the acetylation state of lysines within the N-terminal of this histone is crucial for the silencing control at telomeres, HM loci, and rDNA (Hecht et al., 1995; Braunstein et al., 1996; Imai et al., 2000; Hoppe et al., 2002; Zhou et al., 2009).
We assessed H4 histone acetylation through a chromatin immunoprecipitation (ChIP) approach (Rundlett et al., 1998). Chromatin extracts were immunoprecipitated with antibodies against the C-terminal region of histone H4 or the N-terminal acetylated form (at lysines 5, 8, 12, and 16). The immunoprecipitated DNA was analyzed by PCR using specific primers for six different rDNA regions: the 35S coding sequence (COD), the putative Pol I transcriptional enhancer (ENH), the E-PRO and C-PRO promoters, a region with highly positioned nucleosomes (NUC), and the ARS sequence (map details in Figures 1 and 4A). Considering that SIR2 mutations affect the total occupancy of histone H3 at rDNA (Li et al., 2006) and that the nhp6ab mutant shows a genome-wide reduction of nucleosome particles (Celona et al., 2011), we decided to normalize histone H4 acetylation to the whole H4 amount in all the strains. In addition, in the graphs, data are reported relative to the wild-type level of acetylation (blue line, Figure 4B).
FIGURE 4:
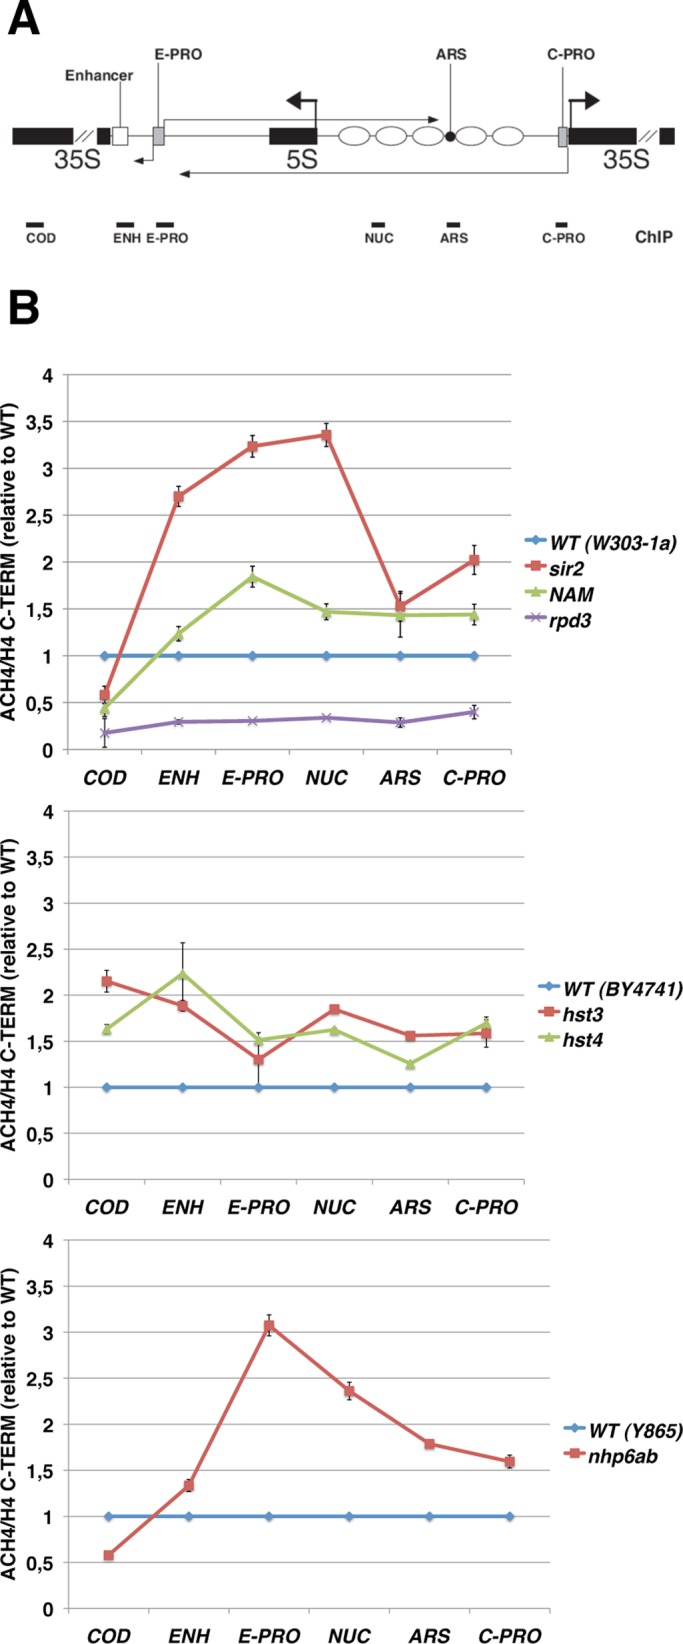
The H4 acetylation profile is altered at the rDNA of histone deacetylases and mutants of high-mobility-group proteins. (A) Graphical representation of an rDNA unit. Horizontal thick black lines indicate the positions of PCR amplicons generated by the ChIP experiments (not to scale). (B) ChIP analysis of the histone H4 acetylation profile at rDNA. Chromatin from the specified strains was immunoprecipitated with antibodies against the C-terminal tail of histone H4 (H4 C-TERM) or against the histone H4 acetylated at lysines 5, 8, 12, and 16 (ACH4). The graphs show the acetylation enrichment, in the indicated rDNA regions, of the mutants relative to isogenic WT strain, reported as 1 (blue line). The lines show the average ratios and SD of technical replicates in a representative experiment out of two performed.
When the sir2Δ strain was compared with the WT, a strong increase in histone H4 acetylation throughout the nontranscribed spacer is observed, confirming previous observations (Bryk et al., 2002; Cioci et al., 2002). Similar results are obtained after inhibition of sirtuin catalytic activity by NAM. However, NAM increases histone acetylation to a lesser extent than does SIR2 deletion.
Unexpectedly, mutation of the histone deacetylase Rpd3p results in a significant decrease in the H4 acetylation level at rDNA. Similar results were reported for rpd3 mutants at telomeres; specifically, this is true for H4K12 in yeast (Ehrentraut et al., 2010) and for several H4 lysine residues in Drosophila (Burgio et al., 2011). Our observation represents the first evidence of hypoacetylation at rDNA of rpd3 mutants.
Then we analyzed the H4 acetylation level in all hst1-4 mutants. We found that hst3 and hst4 strains show, on average, a 1.5-fold increase in H4 acetylation at all the analyzed regions (Figure 4), even though the deacetylation activity of these proteins has been reported only for histone H3 lysine 56 (Xu et al., 2007; Yang et al., 2008). For hst1 and hst2 mutants we could not detect any significant variation relative to the isogenic WT strain (unpublished data).
An increase of histone H4 acetylation in the NTS is also evident for mutant strains lacking the NHP6A and NHP6B genes, suggesting a misregulation in the balance of acetylation/deacetylation in mutants of the high-mobility-group proteins.
To verify whether the alteration in histone acetylation involves other silenced regions, we extended the ChIP analysis to the telomere of the right arm of chromosome VI (Supplemental Figure S1B). We found changes in the acetylation patterns for sir2Δ, rpd3Δ, and NAM-treated cells, similar to what happens at rDNA. Conversely, in hst3 and nhp6ab mutants, no alteration in the level of histone H4 acetylation is observed at telomeres, indicating that their effect on H4 acetylation is restricted to the ribosomal locus (Supplemental Figure S1B).
Strikingly, the data reported in Figures 2–4 show a clear association between ERC production, ncRNA transcription, and histone H4 acetylation among the strains analyzed. In fact, mutants with alterations in ERC and ncRNA levels also show a corresponding change in the histone H4 acetylation. However, the analyses performed so far do not allow us to discriminate which lysine residues account for the observed differences, because of the multiple recognition specificity (lysines 5, 8, 12, and 16) of the antibody used in the ChIP assay.
H4K16 acetylation overlaps with H4 global acetylation in chromatin mutants
We then decided to measure the acetylation level of the H4K16 residue in all mutants for the following reasons: 1) H4K16 acetylation has been found to be associated with Pol II transcription in euchromatic regions in all eukaryotes (Millar et al., 2006); 2) its deacetylation is crucial for transcriptional silencing at all three silent loci in yeast (Hecht et al., 1995; Braunstein et al., 1996; Hoppe et al., 2002); and 3) H4K16 is the main deacetylation target of Sir2p, the silencing mediator (Imai et al., 2000). Considering the changes in ncRNA transcription in the mutants studied, it is conceivable that acetylation of this residue plays a role in the alterations of the silencing process at rDNA.
When ChIP extracts were immunoprecipitated with antibodies against the acetylated form of H4K16 (H4K16-ac), the overall result, obtained after normalization to the total amount of histone H4, was similar to that shown for the globally acetylated form of H4 (Figure 5; also see ACH4 reported in Figure 4).
FIGURE 5:
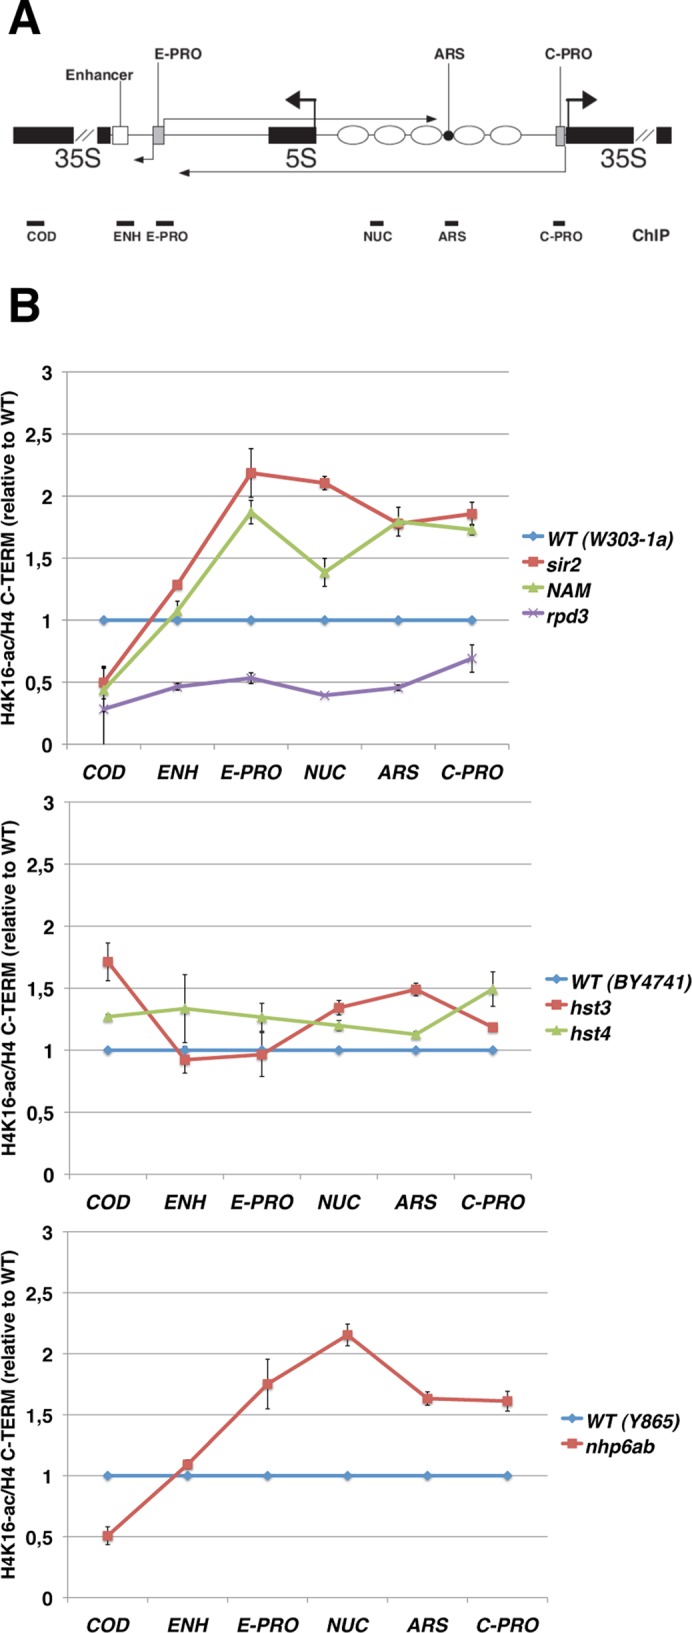
The alterations in H4 Lys-16 acetylation correlate with the observed changes in global H4 acetylation. (A) Schematic map of the rDNA repeat. The fragments amplified in the ChIP analyses are shown. (B) ChIP analysis of the histone H4 Lys-16 acetylation at rDNA. As in Figure 4B, except that the antibodies used were against the C-terminal tail of histone H4 (H4 C-TERM) or against H4 acetylated at Lys-16 (H4K16-ac).
By comparing the acetylation profiles of the sir2 mutant, obtained with αH4K16-ac and αACH4 antibodies, we observed that H4K16 acetylation increases to a lesser extent. Possibly this is due to the fact that H4K16 is not the only residue whose acetylation increases in the sir2 mutant (Braunstein et al., 1996). The NAM treatment appeared to inhibit with different efficiency H4K16-ac and ACH4. In fact, NAM-treated cells show the same H4K16 acetylation extent as the sir2∆ strain, whereas this is not evident for the global H4 acetylation.
According to the previous results (Figure 4), the rpd3 mutant shows a sharp decrease in the H4K16 acetylation in all the rDNA regions studied. Acetylation of the hst3 and hst4 mutants seems to be slightly affected, whereas the effect of nhp6 mutation is, again, higher. Moreover, Hst3p, Hst4p, and Nhp6p seem to influence H4K16 acetylation specifically at rDNA, as confirmed by the fact that the acetylation extent of a subtelomeric region of the telomere VI is not altered in the mutant strains (Supplemental Figure S1C).
Because Hst3p and Hst4p deacetylases are known to act on H3K56 and Rpd3p is specific for H4K12 (among other lysines), we evaluated the acetylation extent of these residues (Supplemental Figure S2). We found a slight decrease in H4K12-ac and a small increase in H3K56-ac at the rDNA of rpd3 and hst3 mutants, respectively. Conversely, no significant changes were observed when the analysis was extended to the telomeres of these strains (Supplemental Figure S2).
Taken together, the data highlight a clear selective H4K16 acetylation accumulation (Figure 5) at the ribosomal locus in those mutants where both ncRNA and ERC amounts are increased (sir2, nhp6ab, and, partially, hst3). Correspondingly, in the rpd3 mutant, hypoacetylation of H4K16 seems to be related to a decrease in both ERC and ncRNA production (Figures 2, 3, and 5).
H4K16 acetylation controls ERC accumulation and ncRNA transcription
To unambiguously attribute a role to H4K16 acetylation as a key regulator of recombination and Pol II transcription at rDNA, we used yeast strains bearing substitutions of H4K16 to arginine (H4K16R) or glutamine (H4K16Q). These two modifications mimic the unacetylated or acetylated state of the residue, respectively. H4K16R and H4K16Q mutations were previously shown to alter silencing in yeast (Hecht et al., 1995; Meijsing and Ehrenhofer-Murray, 2001; Hoppe et al., 2002).
In Figure 6 we report results on DNA recombination, measured as ERC accumulation (Figure 6A), and Pol II transcription, measured as ncRNA production (Figure 6B). H4K16Q, H4K16R, and their isogenic WT strains were grown to the exponential phase and ERC species analyzed as described in Figure 2. The H4K16Q strain shows a twofold increase in ERC content relative to the isogenic WT. In contrast, the H4K16R mutation maintains the amount of ERC at the level of WT (Figure 6A).
FIGURE 6:

Deacetylation of H4K16 is required for the suppression of ERC formation and ncRNA transcription. (A) Substitution of histone H4 Lys-16 with glutamine increases ERC production. Quantification of ERC amount produced by yeast strains bearing substitutions of H4K16 to glutamine, H4K16Q (left), or to arginine, H4K16R (right). ERC species were quantified and normalized as described in Figure 2 (n > 3; ±SD). Two-tailed t test was applied for statistical analysis. Asterisk indicates the statistically relevant difference, α = 0.05, between WT (PKY501) and H4K16Q (p = 0.0204) strains. (B) The H4K16Q mutant up-regulates ncRNA transcription at rDNA. Measure of the E-PRO–derived ncRNA expression level of H4K16Q (left), H4K16R (right), and the corresponding isogenic WT as in Figure 3 (n = 3; ±SD). Asterisk indicates the statistically relevant difference, α = 0.05, between WT (PKY501) and H4K16Q (p = 0.0264) strains.
We then measured the ncRNA expression level, derived from the E-PRO promoter, as in Figure 3. Figure 6B shows how, even in this case, H4K16Q mutation causes loss of silencing at rDNA, with an increased steady-state level of ncRNA, whereas the H4K16R strain seems to produce ncRNA at a similar rate as the WT.
Overall these data indicate that the replacement of the positively charged lysine residue 16 with a neutral one is sufficient to induce a coordinated deregulation of both ncRNA transcription and recombination, thereby suggesting a pivotal role of H4K16 acetylation for the control of TAR at rDNA.
The nhp6ab mutation affects SIR2 expression
The results reported here show that H4 Lys-16 acetylation is sufficient to control TAR at rDNA, because in H4K16Q mutants both processes are affected. In addition, in sir2, rpd3, hst3, and nhp6ab mutant strains a clear relationship between the acetylation state of H4K16 and recombination regulation by ncRNA is observed.
A direct interpretation of the mechanism underlying these phenotypes is possible only for the sir2Δ strain, since only Sir2p deacetylates H4K16 both in vitro and in vivo. A possible explanation for the observed variations in H4K16 acetylation in the other mutants could be defective recruitment of Sir2p at the ribosomal array.
We tested this hypothesis by measuring Sir2p binding at rDNA by ChIP analysis. Chromatin extracts of rpd3, hst3, and nhp6ab mutants were immunoprecipitated with αSir2 antibodies, and DNA was amplified in two regions, ENH and C-PRO, previously shown to be specifically bound by Sir2p (Huang and Moazed, 2003). We found that the Sir2p enrichment at rDNA of the nhp6ab mutant drops relative to the isogenic WT (Figure 7A). Conversely, rpd3 and hst3 mutants did not show significant changes in the level of Sir2p recruitment (Supplemental Figure S3). The reduction observed in the nhp6ab strain involves both regions to a very similar extent.
FIGURE 7:

The nhp6ab mutant has reduced SIR2 expression. (A) The nhp6ab double mutant leads to the loss of Sir2p from the rDNA locus. WT and nhp6ab strains were subjected to ChIP analysis with antibodies against Sir2p. The recovered DNA was amplified in two regions known to bind Sir2p—the enhancer (ENH) and the C-PRO promoter. (B) Sir2 mRNA expression is reduced in nhp6ab cells. The graph reports the Sir2 mRNA levels of nhp6ab and WT strains measured by RT-PCR (n = 3; ±SD). (C) The nhp6ab mutant cells have a decreased Sir2 protein level. Protein extracts from three independent cell cultures of WT (left) or nhp6ab (right) cells were analyzed by Western blot with anti-Sir2 and anti–α-tubulin antibodies.
We hypothesized that the proportional decline of Sir2p binding at C-PRO and ENH could reflect a general reduction in Sir2p availability in nhp6ab mutants. To verify this hypothesis, we measured SIR2 mRNA expression and protein level by RT-PCR and Western blot (Figure 7). Compared to the WT, the mutant shows a twofold reduction of SIR2 mRNA levels (Figure 7B), and the Sir2 protein amount is even more reduced (Figure 7C).
To verify whether the effects of nhp6ab mutation are limited to the ribosomal locus, we also measured the Sir2p recruitment at telomere VI R. We found only a slight decrease in Sir2p binding at the telomere (Supplemental Figure S4A). Indeed, telomeric silencing of nhp6ab is unaffected, indicating that the observed decrease is not influential (Supplemental Figure S4B).
SIR2 overexpression restores most of the WT phenotypes in the nhp6ab mutant
The increase in ncRNA transcription, ERC accumulation, and H4 hyperacetylation in the nhp6ab mutant may all be explained by the observed decrease in the SIR2 gene product (Figure 7). If this were the case, the ectopic expression of the SIR2 gene should restore rDNA silencing, the control of recombination, and the WT level of acetylation in the nhp6ab strain.
Thus we transformed nhp6ab and WT cells with the pAR44 plasmid, in which SIR2 is under the control of the GAL10 promoter (Holmes et al., 1997). These transformants were compared with cells transformed with an empty vector for ncRNA production (Figure 8A), H4 histone acetylation (Figure 8, B and C), and ERC formation (Figure 8D). All the strains were grown in galactose to induce SIR2 expression.
FIGURE 8:

SIR2 overexpression restores the WT level of ncRNA transcription and H4 acetylation in the nhp6ab mutant. (A) SIR2 overexpression in the nhp6ab mutant restores the levels of ncRNA transcription. WT and nhp6ab cells were transformed with the pAR44 plasmid (+) or with the empty vector (–). Quantification of ncRNA expression was performed as described in Figure 3 (n ≥ 4; ±SD). Two-tailed t test was applied for statistical analysis. Asterisks indicate the statistically relevant differences between nhp6ab cells with or without SIR2 overexpression (α = 0.01; p = 0.0015) or between WT cells with or without SIR2 overexpression (α = 0.01; p = 0.009). (B) SIR2 overexpression rescues the altered histone H4 acetylation of the nhp6ab mutant. Cells overexpressing (+) or not (–) SIR2, were grown in galactose and processed for ChIP analysis with antibodies against the C-terminal tail of histone H4 or against the acetylated histone H4 (ACH4). Quantification details and positions of PCR fragments are as in Figure 4. (C) The increased H4K16 acetylation of nhp6ab drops to the WT level after SIR2 overexpression. As in B, except that the antibodies were anti–acetyl histone H4-Lys-16 (H4K16-ac) and anti–H4 C-terminal tail (H4 C-TERM). (D) SIR2 overexpression does not reduce the ERC levels in the nhp6ab strain. DNA from cells containing the PAR44 plasmid (+) or the empty vector (–) was extracted and processed for ERC analysis as described in Figure 2 (n = 3; ±SD).
In this case, the ncRNA expression value of WT cells transformed with the empty plasmid was used as normalizer and is reported as 1 in the graph in Figure 8A. We observed a significant reduction of ncRNA expression for the nhp6ab mutant overexpressing SIR2 when compared with the same strain without the ectopic expression of SIR2. WT cells transformed, as control, with pAR44 also show a significant reduction of ncRNA relative to the corresponding WT strain without SIR2 overexpression. A parallel analysis was performed on cells grown in the repressive glucose-containing medium. However, because of the leakiness of the GAL10 promoter (Lange et al. 2000), a conspicuous SIR2 expression was detected, and the restoration of ncRNA silencing in nhp6ab mutant was observed (unpublished data).
The phenotype rescue analysis was extended to the global H4 acetylation levels (ACH4) in the different rDNA regions of the same strains studied earlier (Figure 8B). The measure of H4 acetylation was performed by ChIP, as reported in Figure 4. When WT cells containing pAR44 are compared with WT cells transformed with the empty plasmid, a similar acetylation profile is observed in most of the regions analyzed. Conversely, a sharp decrease of H4 acetylation is evident in the nhp6ab mutant that overexpresses SIR2 relative to nhp6ab cells without SIR2 ectopic expression. Indeed, SIR2 overexpression makes the H4 acetylation levels almost identical in WT and nhp6ab cells.
We further analyzed the specific acetylation of histone H4 at the Lys-16 residue (H4K16-ac). The acetylation profiles (Figure 8C) are comparable to those observed with αACH4 antibodies. This further demonstrates that the H4K16 acetylation overlaps with H4 global acetylation at the rDNA locus.
The ncRNA expression and the H4 acetylation levels obtained with cultures using glucose as carbon source (Figures 3–5) show similar profiles, but different absolute values, compared with those observed when cells are grown in galactose (Figure 8). Given that Sir2p is a NAD+-dependent enzyme, and given its pivotal role in these processes, changes due to the metabolic alterations are conceivable.
The same strains were also analyzed for ERC production (Figure 8D). However, for this phenotype, SIR2 overexpression did not restore the WT level of recombination.
DISCUSSION
Chromatin factors control TAR at rDNA
The rDNA is one of the few repeated regions in the genome of the yeast S. cerevisiae. Because of its repetitive nature, rDNA may undergo unequal recombination among the units. This latter event is normally suppressed by the yeast cell to avoid ERC production and, in general, genomic instability at the ribosomal array. Despite its potentially detrimental role, a basal level of recombination is required (Ide et al., 2010). rDNA mitotic recombination is ensured, at least in part, by the Pol II transcription of ncRNAs, through a transcription-associated recombination mechanism (Kobayashi and Ganley, 2005).
Pol II transcriptional silencing at rDNA is regulated by multiple pathways and is possibly controlled by the nucleation of a specialized chromatin structure, since it requires histone hypoacetylation (Bryk et al., 1997; Smith et al., 1999; Li et al., 2006), histone methylation (Bryk et al., 2002; Li et al., 2006), and chromatin-remodeling enzymes (Mueller and Bryk, 2007; Mueller et al., 2007). The chromatin structure was also found to affect rDNA recombination efficiency (Kaeberlein et al., 1999; Giavara et al., 2005).
Despite the fact that several studies indicated chromatin involvement in both ncRNA transcription and ERC formation at rDNA, direct evidence connecting the two processes through chromatin structure is lacking.
We developed a small, biased screening to find chromatin factors involved in both ERC formation and ncRNA transcription. In brief, we found that the histone deacetylase Hst3p and the chromatin architectural components Nhp6p are able to inhibit both processes in vivo, whereas the histone deacetylase Rpd3p acts in the opposite way (Figures 2 and 3).
Hst3p and Hst4p regulate transcriptional silencing. Indeed, they are required for efficient H3K56 deacetylation at telomeres and HM loci, where they suppress the expression of both integrated reporter genes and endogenous transcripts (Maas et al., 2006; Xu et al., 2007; Yang et al., 2008). However, only the double mutant hst3/hst4 leads to these phenotypes, probably because Hst3p and Hst4p perform H3K56 deacetylation during different phases of the cell cycle (Maas et al., 2006). Consistently, we found no variation in the content of acetylated H3K56 at telomere VI and observed only a slight H3K56 hyperacetylation at the rDNA of the single mutant hst3 (Supplemental Figure S2). The experiments reported here show how the hst3 mutant is characterized by hyperrecombination of the ribosomal cluster with ncRNA accumulation in a cell cycle–independent manner, even when individually mutated. Previously reported data (Tsuchiya et al., 2006) indicate that, among the hst mutants, hst3 is characterized by a strong lifespan reduction. The ERC-proficient phenotype that we found for the hst3 mutant is in complete agreement with the role of rDNA recombination in replicative aging.
In absence of Rpd3p, ribosomal silencing is enhanced for integrated reporter genes (Smith et al., 1999; Sun and Hampsey, 1999). Moreover, this deacetylase seems to be important for global genomic recombination regulation. Here we show that these two phenotypes are intimately linked at rDNA and controlled by Rpd3p in vivo. Indeed, the RPD3 deletion suppresses ncRNA production and causes a strong reduction of ERCs. Of interest, despite its deacetylase activity, the loss of Rpd3p function gives rise to phenotypes opposite to those observed in sir2 mutants at telomeres, HM, and ribosomal loci.
S. cerevisiae Nhp6Ap and Nhp6Bp are chromatin architectural factors that bind to the minor groove of double-stranded DNA in a non–sequence-specific manner (Allain et al., 1999) and thereby influence chromatin structures (Masse et al., 2002; Celona et al., 2011). Previous work showed that the nhp6ab double mutant leads to increased genome instability, ERC accumulation, and strong reduction of replicative lifespan (Giavara et al., 2005). The mechanism by which Nhp6p contributes to reduce genome instability was associated with the control of histone content (Celona et al., 2011).
With regard to the ribosomal locus, the nhp6ab mutant loses Pol II silencing, with a strong production of ncRNA. We suggest that transcription-associated recombination may be one of the mechanisms by which NHP6AB genes control ERC formation at rDNA. However, ERC levels are not reduced by SIR2 overexpression in nhp6ab mutants (Figure 8D). This suggests that the chromatin alterations in this strain are sufficient to trigger recombination at rDNA despite a reduction in the level of ncRNA.
Altered histone H4 acetylation is associated with variations of both Pol II transcription and recombination
Despite the different ways by which the studied genes act on chromatin, we observed that some of the mutants show alterations in histone H4 acetylation pattern at rDNA. These modifications are associated with transcriptional and recombinational defects (Figures 2–4). In particular, the H4K16 acetylation level strongly correlates with ncRNA transcription and ERC formation (Figure 5). In fact, mutants that produce more ERCs and ncRNA (sir2, hst3, and nhp6ab) also show increased levels of acetylation in many regions of rDNA.
We provide the first evidence that the two proteins Hst3p and Hst4p modulate H4K16 acetylation (Figure 5). In fact, they were previously demonstrated to act on H3K56 (Maas et al., 2006; Xu et al., 2007; Yang et al., 2008). However, our experiments do not discriminate the direct effect on H4K16 from that mediated by histone modification cross-talk. In any case the effect of Hst3p-mediated H4K16 deacetylation seems to be specific to the ribosomal cluster. In fact, the hst3 mutation has no effect on H4K16 acetylation at the telomere, either when individually mutated (Supplemental Figure S1) or in combination with the hst4 mutation (Yang et al., 2008).
The altered histone acetylation observed in the nhp6ab mutant can be explained only by an indirect mechanism. In fact, no histone modification activity has been attributed to Nhp6p proteins. We interpreted this phenotype to be associated with the decreased Sir2p binding at rDNA due to a clear reduction of Sir2 expression (Figure 7). We demonstrated this hypothesis by overexpressing SIR2 in the nhp6ab mutant, thereby rescuing the wild-type levels of H4 acetylation and ncRNA transcription (Figure 8). Sir2p redistribution in the nhp6ab mutant does not involve all the silent loci to the same extent. In fact, although at rDNA a sharp decrease of Sir2p binding is evident, at the telomeres only a slight reduction is observed. This difference in Sir2p binding is functionally verified by the measure of silencing and histone acetylation, which are affected at rDNA but not at telomeres.
In contrast, the rpd3 mutation, which suppresses recombination and Pol II transcription, shows hypoacetylated chromatin all along the ribosomal repeat. This observation is counterintuitive, since the loss of a deacetylase should cause an increase in acetylation. Actually, Rpd3p was found to show a similar behavior also at the telomere. At this locus Rpd3p is necessary for heterochromatin boundary formation, inhibiting the SIR complex spreading along subtelomeric genes (Zhou et al., 2009; Ehrentraut et al., 2010). Moreover, rpd3 mutants show H4 hypoacetylation, particularly at Lys-16, also in the Drosophila telomeres (Burgio et al., 2011). It was hypothesized that Rpd3p interacts with chromatin at boundary regions, where its activity on H4K12 and H4K5 would create a chromatin environment able to block Sir2p-dependent H4K16 deacetylation (Zhou et al., 2009; Ehrentraut et al., 2010). It is conceivable that a similar mechanism occurs at the ribosomal locus, in which we observe strong H4K16 deacetylation in the absence of Rpd3p.
H4K16 acetylation regulates ncRNA transcription and ERC formation at rDNA
The observations reported here indicate that H4 acetylation, particularly at Lys-16, is related to the events of recombination and Pol II transcription, thereby suggesting the existence of epigenetic control in the coordination of these two basic DNA transactions within the ribosomal genes of S. cerevisiae. In this study we demonstrated the existence of such epigenetic control.
In fact, the substitution of Lys-16 with differently charged residues results in distinct outcomes. The H4K16Q substitution, mimicking the acetylated state of lysine, leads to a strong misregulation of ERC formation rate and Pol II transcription. Conversely, substitution with the nonacetylatable arginine, H4K16R, does not affect ncRNA transcription or recombination at rDNA (Figure 6). It is unlikely that the observed variations are due to a different amount of Sir2p, since Dang et al. (2009) demonstrated that H4K16Q and H4K16R mutants show a similar amount of Sir2p bound to the ribosomal cluster. This raises the possibility that the chromatin environment, and specifically histone acetylation, more than the recruitment of silencing factors is required to regulate recombination and Pol II transcription at rDNA. The dominant role of histone acetylation at H4K16 in the establishment of yeast silent chromatin was recently highlighted (Oppikofer et al., 2011).
The coordinated regulation of transcription and recombination that we found in this study is not observed in all the conditions affecting one of the two processes. For example, mutants in the histone methyltransferase Set1 show increased ncRNA transcription (Li et al., 2006) without altering the rDNA recombination rate (Bryk et al., 2002). On the other hand, yeast cells grown under calorie restriction conditions suppress recombination without changes in ncRNA synthesis (Smith et al., 2009). We identified new factors that coordinate the transcription and recombination controls at the ribosomal array. The fact that they all affect histone acetylation suggests that this posttranscriptional modification is the key to the coordination.
Considering that rDNA repetitions require sequence homogeneity maintenance, the use of recombination could have been selected by evolution as a strategy to maintain this homeostasis. However, it is necessary to finely tune its control to prevent genome instability. The use of a rapid and reversible posttranscriptional modification such as the histone acetylation of a single, locus-specific residue makes the control of recombinational events easier than acting directly on ubiquitous recombinational enzymes.
According to several observations, the transcriptional activity of RNA polymerase II within the nucleolus of S. cerevisiae enhances recombination levels among the ribosomal repeats (Oakes et al., 1999; Kobayashi and Ganley, 2005; Houseley et al., 2007; Vasiljeva et al., 2008). Transcription-associated recombination events are widespread in the genome and play important roles also in complex systems, such as the immunoglobulin class switch recombination in mammals (Nambu et al., 2003). The coupling between transcription and recombination can be due to the chromatin-remodeling activity that drives the transcriptional event. Indeed, H4K16 acetylation is a recognized marker of transcriptionally active chromatin (Millar et al., 2006). Furthermore, this modification inhibits the formation of the 30-nm fiber (Shogren-Knaak et al., 2006), likely leading to a structural environment that favors strand exchange during recombination. Because the increase in histone acetylation improves both transcription and recombination, it represents a possible prerequisite for their coordination.
MATERIALS AND METHODS
Yeast strains, plasmids, and oligo sequences
Yeast strains and plasmid used in this study are listed in Supplemental Table S1, and oligo sequences are listed in Supplemental Table S2.
Culture media and conditions
Yeast was grown and manipulated according to standard protocols (Sherman et al., 1983). Nicotinamide (Sigma-Aldrich, St. Louis, MO) treatment was performed at the final concentration of 500 μM for 16 h.
ERC analysis
Yeast cells grown to exponential phase (OD600 0.5/ml) were lysed with lysis buffer (1% SDS, 100 mM NaCl, 10 mM Tris pH 8.0, 1 mM EDTA) and glass beads (Sigma-Aldrich) by vigorous shaking. The DNA was then purified by three phenol–chloroform–isoamylic alcohol (24:24:1 [vol/vol/vol]) extractions and ethanol precipitation. Proteinase K (0.2 μg/μl) and RNase A (0.15 μg/μl) treatments were also performed. A 5-μg amount of the recovered DNA was run in 0.8% agarose gel electrophoresis (1.75 V/cm) and transferred onto a nylon membrane (GE Healthcare, Piscataway, NJ). Hybridization was performed with an rDNA-specific probe annealing from −100 to −2400 base pairs upstream of the RNA polymerase I transcription start site. Image acquisition was performed using the Typhoon 9410 Variable Mode Imager (GE Healthcare). The band intensities corresponding to ERCs were measured with ImageJ 1.42q (National Institutes of Health, Bethesda, MD) and normalized to the bulk genomic DNA (loading control). ERC values were then divided by the calculated WT level (shown as 1 in the graphs). Means and error bars refer to at least three independent ratios: (mutant or treatment)/(wild type). Student's t test was applied for statistical analysis; α = 0.05.
RT-PCR
RNA from logarithmically growing cultures was isolated as previously described (Verdone et al., 1996). A 1.5-μg amount of DNase I–treated RNA was subjected to cDNA synthesis, starting from 0.1 μM strand-specific primers NTS1-Rf and ACT1-F (for ncRNA measurement) or 2.5 μM oligo(dT) (for evaluation of the SIR2, YFR057W, and IRC7 mRNA expression levels) through incubation with 30 U of SuperScript III Reverse Transcriptase (Invitrogen, Grand Island, NY) for 30 min at 55°C.
A 1-μl amount of the resulting cDNAs was amplified by PCR coamplification using the NTS1-Rr and ACT1-R reverse primers for ncRNA analysis and the following primers pairs for SIR2, YFR057W, and IRC7 expression analysis: ACT1-F/ACT1-R; SIR2-F/SIR2-R; YFR057W-F/YFR057W-R; and IRC7-F/IRC7-R.
PCR was performed under the following conditions: 95°C for 30 s, 55°C for 30 s, and 68°C for 1 min, with 17 cycles for ACT1 and 24 cycles for ncRNA, SIR2, YFR057W, and IRC7. Taq polymerase was from Eppendorf (Hamburg, Germany). [α-32P]dATP (Amersham, GE Healthcare) was added to the reaction mixture (0.04 μCi/μl). Template titration for each sample was performed to evaluate the linear range of amplification. The amplified fragments were separated on a 6% acrylamide gel. Quantification was performed using ImageJ 1.42q. ncRNA, SIR2, YFR057W, or IRC7 band intensity was normalized to ACT1. For ncRNA data, average (with standard deviations) refers to at least three independent ratios: (mutant or treatment)/(wild type). Student's t test was applied for statistical analysis; α = 0.05.
The average and the SD of three technical replicates in a representative experiment out of two performed are reported for SIR2, YFR057W, and IRC7.
Chromatin immunoprecipitation
A 300-ml amount of culture was grown to exponential phase, cross-linked with 1% formaldehyde at room temperature for 15 min, and then incubated with 330 mM glycine for 10 min. Cells were then processed for ChIP as described (Huang and Moazed, 2003)
A 350-μg amount of chromatin extract was incubated with 2.5 μg of antibodies against Sir2p (Santa Cruz Biotechnology, Santa Cruz, CA) or 2.5 μl of antibodies against histone H3 or H4 C-terminal tail, anti–acetyl H4, anti–acetyl H4 Lys-16, anti–acetyl H4 Lys-12, or anti–acetyl H3 Lys-56 (Millipore, Billerica, MA). Chromatin–antibody complexes were isolated with protein A–Sepharose beads (Amersham, GE Healthcare) for 1.5 h at 4°C. The recovered DNA was resuspended in 200 μl for genomic (input) sample and in 50 μl for immunoprecipitated (IP) and beads only (BO) samples. Different DNA amounts were used as template for PCR in order to obtain comparable autoradiographic signals (1 μl of a 1:20 dilution for input, and 1 μl for IP and BO. PCR was performed under the following conditions: 95°C for 30 s, 55°C for 30 s, and 68°C for 1 min, with 25 cycles for ACT1 and TEL VI and 18 cycles for rDNA sequences. [α-32P]dATP was added to the reaction mixture (0.04 μCi/μl). For each immunoprecipitation three PCR reactions were performed.
The amplified fragments were separated on a 6% acrylamide gels. Quantification was performed using ImageJ 1.42q. Each set of experiments was repeated at least twice. Quantifications were performed as described in Huang and Moazed (2003). Briefly, in Figure 7 and in Supplemental Figure S3 the Sir2 fold enrichment values were calculated as follows: [rDNA(IP)/ACT1(IP)]/[rDNA(input)/ACT1(input)].
In Figures 4, 5, and 8 and Supplemental Figures S1 and S2 the acetylation profiles were further corrected for the total amount of the histone H4 or H3. In this case the relative fold enrichment is defined as the ratio (acetylated histone)/(total histone) for values from the following calculation: [rDNA(IP)/ACT1(IP)]/[rDNA(input)/ACT1(input)]. The isogenic WT strain value was then normalized to 1, obtaining the acetylation enrichment shown for the different mutants or conditions. The graphs show the mean and SD calculated from three technical replicates in a representative experiment out of two performed.
Western blot
Yeast cells were grown to the exponential phase and lysed with NP40 buffer (0.2% NP40, 200 mM NaCl, 50 mM Tris pH 7.5, 1 mM PMSF, and protease inhibitors) and glass beads by vigorous shaking for 1 h at 4°C. An 80-μg amount of protein extract was separated by a 7% SDS-polyacrylamide gel. The membranes were incubated overnight at 4°C with rabbit-derived anti-Sir2 antibody (Santa Cruz Biotechnology) or rat-derived anti–α tubulin antibody (Santa Cruz Biotechnology). Secondary antibodies were anti–rabbit immunoglobulin G (IgG)–horseradish peroxidase (HRP; Jackson ImmunoResearch, West Grove, PA) or anti–rat IgG-HRP (Santa Cruz Biotechnology). Detection was performed using SuperSignal West Pico Chemiluminescent Substrate (Thermo Scientific, Waltham, MA).
Supplementary Material
Acknowledgments
We are grateful to Chiara De Luca and Laura Cedrone for helpful discussions, and we thank Sabrina Venditti and Micaela Caserta for critical reading of the manuscript. We also thank M. Nomura, M. Grunstein, M. E. Bianchi, and A. E. Ehrenhofer-Murray for yeast strains. This work was partially supported by the Istituto Pasteur-Fondazione Cenci Bolognetti Università di Roma La Sapienza and by the Epigenomics Flagship Project EpiGen, the Italian Ministry of Education and Research, National Research Council. E.C. is a recipient of a Teresa Ariaudo Fellowship from the Istituto Pasteur-Fondazione Cenci Bolognetti.
Abbreviations used:
- NAM
nicotinamide
- ncRNA
noncoding RNA
- NTS
nontranscribed spacer
- rDNA
ribosomal DNA
- TAR
transcription-associated recombination
Footnotes
This article was published online ahead of print in MBoC in Press (http://www.molbiolcell.org/cgi/doi/10.1091/mbc.E12-02-0095) on May 23, 2012.
REFERENCES
- Aguilera A, Gómez-González B. Genome instability: a mechanistic view of its causes and consequences. Nat Rev Genet. 2008;9:204–217. doi: 10.1038/nrg2268. [DOI] [PubMed] [Google Scholar]
- Allain FH, Yen YM, Masse JE, Schultze P, Dieckmann T, Johnson RC, Feigon J. Solution structure of the HMG protein NHP6A and its interaction with DNA reveals the structural determinants for non-sequence-specific binding. EMBO J. 1999;18:2563–2579. doi: 10.1093/emboj/18.9.2563. [DOI] [PMC free article] [PubMed] [Google Scholar]
- Bitterman KJ, Anderson RM, Cohen HY, Latorre-Esteves M, Sinclair DA. Inhibition of silencing and accelerated aging by nicotinamide, a putative negative regulator of yeast sir2 and human SIRT1. J Biol Chem. 2002;277:45099–45107. doi: 10.1074/jbc.M205670200. [DOI] [PubMed] [Google Scholar]
- Brachmann CB, Sherman JM, Devine SE, Cameron EE, Pillus L, Boeke JD. The SIR2 gene family, conserved from bacteria to humans, functions in silencing, cell cycle progression, and chromosome stability. Genes Dev. 1995;9:2888–2902. doi: 10.1101/gad.9.23.2888. [DOI] [PubMed] [Google Scholar]
- Braunstein M, Sobel RE, Allis CD, Turner BM, Broach JR. Efficient transcriptional silencing in Saccharomyces cerevisiae requires a heterochromatin histone acetylation pattern. Mol Cell Biol. 1996;16:4349–4356. doi: 10.1128/mcb.16.8.4349. [DOI] [PMC free article] [PubMed] [Google Scholar]
- Bryk M, Banerjee M, Murphy M, Knudsen KE, Garfinkel DJ, Curcio MJ. Transcriptional silencing of Ty1 elements in the RDN1 locus of yeast. Genes Dev. 1997;11:255–269. doi: 10.1101/gad.11.2.255. [DOI] [PubMed] [Google Scholar]
- Bryk M, Briggs SD, Strahl BD, Curcio MJ, Allis CD, Winston F. Evidence that Set1, a factor required for methylation of histone H3, regulates rDNA silencing in S. cerevisiae by a Sir2-independent mechanism. Curr Biol. 2002;12:165–170. doi: 10.1016/s0960-9822(01)00652-2. [DOI] [PubMed] [Google Scholar]
- Burgio G, Cipressa F, Ingrassia AM, Cenci G, Corona DF. The histone deacetylase Rpd3 regulates the heterochromatin structure of Drosophila telomeres. J Cell Sci. 2011;124:2041–2048. doi: 10.1242/jcs.078261. [DOI] [PubMed] [Google Scholar]
- Celona B, et al. Substantial histone reduction modulates genomewide nucleosomal occupancy and global transcriptional output. PLoS Biol. 2011;9:e1001086. doi: 10.1371/journal.pbio.1001086. [DOI] [PMC free article] [PubMed] [Google Scholar]
- Cesarini E, Mariotti FR, Cioci F, Camilloni G. RNA polymerase I transcription silences noncoding RNAs at the ribosomal DNA locus in Saccharomyces cerevisiae. Eukaryot Cell. 2010;9:325–335. doi: 10.1128/EC.00280-09. [DOI] [PMC free article] [PubMed] [Google Scholar]
- Cioci F, Vogelauer M, Camilloni G. Acetylation and accessibility of rDNA chromatin in Saccharomyces cerevisiae in (Delta)top1 and (Delta)sir2 mutants. J Mol Biol. 2002;322:41–52. doi: 10.1016/s0022-2836(02)00749-0. [DOI] [PubMed] [Google Scholar]
- Dang W, Steffen KK, Perry R, Dorsey JA, Johnson FB, Shilatifard A, Kaeberlein M, Kennedy BK, Berger SL. Histone H4 lysine 16 acetylation regulates cellular lifespan. Nature. 2009;459:802–807. doi: 10.1038/nature08085. [DOI] [PMC free article] [PubMed] [Google Scholar]
- Dora EG, Rudin N, Martell JR, Esposito MS, Ramírez RM. RPD3 (REC3) mutations affect mitotic recombination in Saccharomyces cerevisiae. Curr Genet. 1999;35:68–76. doi: 10.1007/s002940050434. [DOI] [PubMed] [Google Scholar]
- Ehrentraut S, Weber JM, Dybowski JN, Hoffmann D, Ehrenhofer-Murray AE. Rpd3-dependent boundary formation at telomeres by removal of Sir2 substrate. Proc Natl Acad Sci USA. 2010;107:5522–5527. doi: 10.1073/pnas.0909169107. [DOI] [PMC free article] [PubMed] [Google Scholar]
- Fritze CE, Verschueren K, Strich R, Esposito RE. Direct evidence for SIR2 modulation of chromatin structure in yeast rDNA. EMBO J. 1997;16:6495–6509. doi: 10.1093/emboj/16.21.6495. [DOI] [PMC free article] [PubMed] [Google Scholar]
- Ganley ARD, Kobayashi T. Highly efficient concerted evolution in the ribosomal DNA repeats: total rDNA repeat variation revealed by whole-genome shotgun sequence data. Genome Res. 2007;17:184–191. doi: 10.1101/gr.5457707. [DOI] [PMC free article] [PubMed] [Google Scholar]
- Ganley AR, Ide S, Saka K, Kobayashi T. The effect of replication initiation on gene amplification in the rDNA and its relationship to aging. Mol Cell. 2009;35:683–693. doi: 10.1016/j.molcel.2009.07.012. [DOI] [PubMed] [Google Scholar]
- Giavara S, Kosmidou E, Hande MP, Bianchi ME, Morgan A, d'Adda di Fagagna F, Jackson SP. Yeast Nhp6A/B and mammalian Hmgb1 facilitate the maintenance of genome stability. Curr Biol. 2005;15:68–72. doi: 10.1016/j.cub.2004.12.065. [DOI] [PubMed] [Google Scholar]
- Gottipati P, Helleday T. Transcription-associated recombination in eukaryotes: link between transcription, replication and recombination. Mutagenesis. 2009;24:203–210. doi: 10.1093/mutage/gen072. [DOI] [PubMed] [Google Scholar]
- Gottlieb S, Esposito RE. A new role for a yeast transcriptional silencer gene, SIR2, in regulation of recombination in ribosomal DNA. Cell. 1989;56:771–776. doi: 10.1016/0092-8674(89)90681-8. [DOI] [PubMed] [Google Scholar]
- Hecht A, Laroche T, Strahl-Bolsinger S, Gasser SM, Grunstein M. Histone H3 and H4 N-termini interact with SIR3 and SIR4 proteins: a molecular model for the formation of heterochromatin in yeast. Cell. 1995;80:583–592. doi: 10.1016/0092-8674(95)90512-x. [DOI] [PubMed] [Google Scholar]
- Holmes SG, Rose AB, Steuerle K, Saez E, Sayegh S, Lee YM, Broach JR. Hyperactivation of the silencing proteins, Sir2p and Sir3p, causes chromosome loss. Genetics. 1997;145:605–614. doi: 10.1093/genetics/145.3.605. [DOI] [PMC free article] [PubMed] [Google Scholar]
- Hoppe GJ, Tanny JC, Rudner AD, Gerber SA, Danaie S, Gygi SP, Moazed D. Steps in assembly of silent chromatin in yeast: Sir3-independent binding of a Sir2/Sir4 complex to silencers and role for Sir2-dependent deacetylation. Mol Cell Biol. 2002;22:4167–4180. doi: 10.1128/MCB.22.12.4167-4180.2002. [DOI] [PMC free article] [PubMed] [Google Scholar]
- Houseley J, Kotovic K, El Hage A, Tollervey D. Trf4 targets ncRNAs from telomeric and rDNA spacer regions and functions in rDNA copy number control. EMBO J. 2007;26:4996–5006. doi: 10.1038/sj.emboj.7601921. [DOI] [PMC free article] [PubMed] [Google Scholar]
- Huang J, Moazed D. Association of the RENT complex with nontranscribed and coding regions of rDNA and a regional requirement for the replication fork block protein Fob1 in rDNA silencing. Genes Dev. 2003;17:2162–2176. doi: 10.1101/gad.1108403. [DOI] [PMC free article] [PubMed] [Google Scholar]
- Ide S, Miyazaki T, Maki H, Kobayashi T. Abundance of ribosomal RNA gene copies maintains genome integrity. Science. 2010;327:693–696. doi: 10.1126/science.1179044. [DOI] [PubMed] [Google Scholar]
- Imai S, Armstrong CM, Kaeberlein M, Guarente L. Transcriptional silencing and longevity protein Sir2 is an NAD- dependent histone deacetylase. Nature. 2000;403:795–800. doi: 10.1038/35001622. [DOI] [PubMed] [Google Scholar]
- Kaeberlein M, McVey M, Guarente L. The SIR2/3/4 complex and SIR2 alone promote longevity in Saccharomyces cerevisiae by two different mechanisms. Genes Dev. 1999;13:2570–2580. doi: 10.1101/gad.13.19.2570. [DOI] [PMC free article] [PubMed] [Google Scholar]
- Kobayashi T. Strategies to maintain the stability of the ribosomal RNA gene repeats. Genes Genet Syst. 2006;81:155–161. doi: 10.1266/ggs.81.155. [DOI] [PubMed] [Google Scholar]
- Kobayashi T, Ganley ARD. Recombination regulation by transcription-induced cohesin dissociation in rDNA repeats. Science. 2005;309:1581–1584. doi: 10.1126/science.1116102. [DOI] [PubMed] [Google Scholar]
- Lange H, Kaut A, Kispal G, Lill R. A mitochondrial ferredoxin is essential for biogenesis of cellular iron-sulfur proteins. Proc Natl Acad Sci USA. 2000;97:1050–1055. doi: 10.1073/pnas.97.3.1050. [DOI] [PMC free article] [PubMed] [Google Scholar]
- Li C, Mueller JE, Bryk M. Sir2 represses endogenous polymerase II transcription units in the ribosomal DNA nontranscribed spacer. Mol Biol Cell. 2006;17:3848–3859. doi: 10.1091/mbc.E06-03-0205. [DOI] [PMC free article] [PubMed] [Google Scholar]
- Maas NL, Miller KM, De Fazio LG, Toczyski DP. Cell cycle and checkpoint regulation of histone H3 K56 acetylation by Hst3 and Hst4. Mol Cell. 2006;23:109–119. doi: 10.1016/j.molcel.2006.06.006. [DOI] [PubMed] [Google Scholar]
- Masse JE, Wong B, Yen YM, Allain FH, Johnson RC, Feigon J. The S. cerevisiae architectural HMGB protein NHP6A complexed with DNA: DNA and protein conformational changes upon binding. J Mol Biol. 2002;323:263–284. doi: 10.1016/s0022-2836(02)00938-5. [DOI] [PubMed] [Google Scholar]
- Meijsing SH, Ehrenhofer-Murray AE. The silencing complex SAS-I links histone acetylation to the assembly of repressed chromatin by CAF-I and Asf1 in Saccharomyces cerevisiae. Genes Dev. 2001;15:3169–3182. doi: 10.1101/gad.929001. [DOI] [PMC free article] [PubMed] [Google Scholar]
- Millar CB, Kurdistani SK, Grunstein M. Acetylation of yeast histone H4 lysine 16: a switch for protein interactions in heterochromatin and euchromatin. Cold Spring Harb Symp Quant Biol. 2006;69:193–200. doi: 10.1101/sqb.2004.69.193. [DOI] [PubMed] [Google Scholar]
- Mueller JE, Bryk M. Isw1 acts independently of the Isw1a and Isw1b complexes in regulating transcriptional silencing at the ribosomal DNA locus in Saccharomyces cerevisiae. J Mol Biol. 2007;371:1–10. doi: 10.1016/j.jmb.2007.04.089. [DOI] [PMC free article] [PubMed] [Google Scholar]
- Mueller JE, Li C, Bryk M. Isw2 regulates gene silencing at the ribosomal DNA locus in Saccharomyces cerevisiae. Biochem Biophys Res Commun. 2007;361:1017–1021. doi: 10.1016/j.bbrc.2007.07.140. [DOI] [PMC free article] [PubMed] [Google Scholar]
- Nambu Y, Sugai M, Gonda H, Lee CG, Katakai T, Agata Y, Yokota Y, Shimizu A. Transcription-coupled events associating with immunoglobulin switch region chromatin. Science. 2003;302:2137–2140. doi: 10.1126/science.1092481. [DOI] [PubMed] [Google Scholar]
- Nomura M. Ribosomal RNA genes, RNA polymerases, nucleolar structures, and synthesis of rRNA in the yeast Saccharomyces cerevisiae. Cold Spring Harb Symp Quant Biol. 2001;66:555–565. doi: 10.1101/sqb.2001.66.555. [DOI] [PubMed] [Google Scholar]
- Oakes M, Siddiqi I, Vu L, Aris J, Nomura M. Transcription factor UAF, expansion and contraction of ribosomal DNA (rDNA) repeats, and RNA polymerase switch in transcription of yeast rDNA. Mol Cell Biol. 1999;19:8559–8569. doi: 10.1128/mcb.19.12.8559. [DOI] [PMC free article] [PubMed] [Google Scholar]
- Oppikofer M, Kueng S, Martino F, Soeroes S, Hancock SM, Chin JW, Fischle W, Gasser SM. A dual role of H4K16 acetylation in the establishment of yeast silent chromatin. EMBO J. 2011;30:2610–2621. doi: 10.1038/emboj.2011.170. [DOI] [PMC free article] [PubMed] [Google Scholar]
- Petes TD. Yeast ribosomal DNA genes are located on chromosome XII. Proc Natl Acad Sci USA. 1979;76:410–414. doi: 10.1073/pnas.76.1.410. [DOI] [PMC free article] [PubMed] [Google Scholar]
- Rundlett SE, Carmen AA, Suka N, Turner BM, Grunstein M. Transcriptional repression by UME6 involves deacetylation of lysine 5 of histone H4 by RPD3. Nature. 1998;392:831–835. doi: 10.1038/33952. [DOI] [PubMed] [Google Scholar]
- Santangelo GM, Tornow J, McLaughlin CS, Moldave K. Properties of promoters cloned randomly from the Saccharomyces cerevisiae genome. Mol Cell Biol. 1988;8:4217–4224. doi: 10.1128/mcb.8.10.4217. [DOI] [PMC free article] [PubMed] [Google Scholar]
- Sherman F, Fink GR, Lawrence C. Methods in Yeast Genetics. Cold Spring Harbor, NY: Cold Spring Harbor Laboratory Press; 1983. [Google Scholar]
- Shogren-Knaak M, Ishii H, Sun JM, Pazin MJ, Davie JR, Peterson CL. Histone H4-K16 acetylation controls chromatin structure and protein interactions. Science. 2006;311:844–847. doi: 10.1126/science.1124000. [DOI] [PubMed] [Google Scholar]
- Sinclair DA, Guarente L. Extrachromosomal rDNA circles—a cause of aging in yeast. Cell. 1997;91:1033–1042. doi: 10.1016/s0092-8674(00)80493-6. [DOI] [PubMed] [Google Scholar]
- Smith JS, Boeke JD. An unusual form of transcriptional silencing in yeast ribosomal DNA. Genes Dev. 1997;11:241–254. doi: 10.1101/gad.11.2.241. [DOI] [PubMed] [Google Scholar]
- Smith JS, Caputo E, Boeke JD. A genetic screen for ribosomal DNA silencing defects identifies multiple DNA replication and chromatin-modulating factors. Mol Cell Biol. 1999;19:3184–3197. doi: 10.1128/mcb.19.4.3184. [DOI] [PMC free article] [PubMed] [Google Scholar]
- Smith DL, Jr, Li C, Matecic M, Maqani N, Bryk M, Smith JS. Calorie restriction effects on silencing and recombination at the yeast rDNA. Aging Cell. 2009;8:633–642. doi: 10.1111/j.1474-9726.2009.00516.x. [DOI] [PMC free article] [PubMed] [Google Scholar]
- Stillman DJ. Nhp6: a small but powerful effector of chromatin structure in Saccharomyces cerevisiae. Biochim Biophys Acta. 2010;1799:175–180. doi: 10.1016/j.bbagrm.2009.11.010. [DOI] [PMC free article] [PubMed] [Google Scholar]
- Straight AF, Shou W, Dowd GJ, Turck CW, Deshaies RJ, Johnson AD, Moazed D. Net1, a Sir2-associated nucleolar protein required for rDNA silencing and nucleolar integrity. Cell. 1999;97:245–256. doi: 10.1016/s0092-8674(00)80734-5. [DOI] [PubMed] [Google Scholar]
- Suka N, Luo K, Grunstein M. Sir2p and Sas2p opposingly regulate acetylation of yeast histone H4 lysine16 and spreading of heterochromatin. Nat Genet. 2002;32:378–383. doi: 10.1038/ng1017. [DOI] [PubMed] [Google Scholar]
- Sun ZW, Hampsey M. A general requirement for the Sin3-Rpd3 histone deacetylase complex in regulating silencing in Saccharomyces cerevisiae. Genetics. 1999;152:921–932. doi: 10.1093/genetics/152.3.921. [DOI] [PMC free article] [PubMed] [Google Scholar]
- Tsuchiya M, Dang N, Kerr EO, Hu D, Steffen KK, Oakes JA, Kennedy BK, Kaeberlein M. Sirtuin-independent effects of nicotinamide on lifespan extension from calorie restriction in yeast. Aging Cell. 2006;5:505–514. doi: 10.1111/j.1474-9726.2006.00240.x. [DOI] [PubMed] [Google Scholar]
- Vasiljeva L, Kim M, Terzi N, Soares LM, Buratowski S. Transcription termination and RNA degradation contribute to silencing of RNA polymerase II transcription within heterochromatin. Mol Cell. 2008;29:313–323. doi: 10.1016/j.molcel.2008.01.011. [DOI] [PubMed] [Google Scholar]
- Verdone L, Camilloni G, Di Mauro E, Caserta M. Chromatin remodeling during Saccharomyces cerevisiae ADH2 gene activation. Mol Cell Biol. 1996;16:1978–1988. doi: 10.1128/mcb.16.5.1978. [DOI] [PMC free article] [PubMed] [Google Scholar]
- Vogelauer M, Cioci F, Camilloni G. DNA protein interactions at the Saccharomyces cerevisiae 35S rRNA promoter and its surrounding region. J Mol Biol. 1998;275:197–209. doi: 10.1006/jmbi.1997.1451. [DOI] [PubMed] [Google Scholar]
- Xu F, Zhang Q, Zhang K, Xie W, Grunstein M. Sir2 deacetylates histone H3 lysine 56 to regulate telomeric heterochromatin structure in yeast. Mol Cell. 2007;27:890–900. doi: 10.1016/j.molcel.2007.07.021. [DOI] [PMC free article] [PubMed] [Google Scholar]
- Yang B, Miller A, Kirchmaier AL. HST3/HST4-dependent deacetylation of lysine 56 of histone H3 in silent chromatin. Mol Biol Cell. 2008;19:4993–5005. doi: 10.1091/mbc.E08-05-0524. [DOI] [PMC free article] [PubMed] [Google Scholar]
- Zhou J, Zhou BO, Lenzmeier BA, Zhou JQ. Histone deacetylase Rpd3 antagonizes Sir2-dependent silent chromatin propagation. Nucleic Acids Res. 2009;37:3699–3713. doi: 10.1093/nar/gkp233. [DOI] [PMC free article] [PubMed] [Google Scholar]
Associated Data
This section collects any data citations, data availability statements, or supplementary materials included in this article.