

Abstract
A combined experimental, individual-differences, and thought-sampling study tested the predictions of executive attention (e.g., Engle & Kane, 2004) and coordinative binding (e.g., Oberauer, Süß, Wilhelm, & Sander, 2007) theories of working memory capacity (WMC). We assessed 288 subjects’ WMC and their performance and mind-wandering rates during a sustained-attention task; subjects completed either a go/no-go version requiring executive control over habit, or a vigilance version that did not. We further combined the data with those from McVay and Kane (2009) to: (1) gauge the contributions of WMC and attentional lapses to the worst-performance rule and the tail, or τ parameter, of response time (RT) distributions; (2) assess which parameters from a quantitative evidence-accumulation RT model were predicted by WMC and mind-wandering reports, and (3) consider intra-subject RT patterns – particularly, speeding – as potential objective markers of mind wandering. We found that WMC predicted action and thought control in only some conditions, that attentional lapses (indicated by TUT reports and drift-rate variability in evidence accumulation) contributed to τ, performance accuracy, and WMC’s association with them, and that mind-wandering experiences were not predicted by trial-to-trial RT changes, and so they cannot always be inferred from objective performance measures.
Keywords: working memory, executive control, mind wandering, individual differences, reaction time
People tend to make mistakes when they think too much (e.g., Beilock & Carr, 2001) or too little (e.g., Reason, 1990) about ongoing, routine activities. The present study explores whether executive control over thought content – and over mind wandering, in particular – contributes to individual differences in working memory capacity (WMC) and their cognitive and behavioral consequences. Attentional theories of WMC argue that domain-general, executive-control capabilities contribute to performance on both WMC and higher-order cognitive tasks, as well as to their shared variance (e.g., Braver, Gray, & Burgess, 2007; Hasher, Lustig, & Zacks, 2007; Hasher & Zacks, 1988; Kane, Conway, Hambrick, & Engle, 2007; Unsworth & Engle, 2007; Unsworth & Spillers, 2010). Some evidence for these views comes from studies showing that WMC measures predict not only complex cognitive skills, such as reasoning and reading (e.g., Daneman & Merikle, 1996; Kane, Hambrick, & Conway, 2005; Oberauer, Schulze, Wilhelm, & Süß, 2005), but also more simple attention functions, such as restraining habitual but contextually inappropriate responses (e.g., Hutchison, 2011; Kane & Engle, 2003; Long & Prat, 2002; Unsworth, Schrock, & Engle, 2004), or constraining conscious focus to target stimuli amid distractors (e.g., Colzato, Spapé, Pannebakker, & Hommel, 2007; Conway, Cowan, & Bunting, 2001; Fukuda & Vogel, 2009; Heitz & Engle, 2007; Poole & Kane, 2009; but see Colom, Abad, Quiroga, Shih, & Flores-Mendoza, 2008; Keye, Wilhelm, Oberauer & van Ravenzwaaij, 2009).
Our view of executive control, like others’ (e.g., De Jong, 2001; Braver et al., 2007; Cohen & Servan-Schreiber, 1992; Jacoby, Kelley, & McElree, 1999; Roberts & Pennington, 1996), is that self-regulation of thought and behavior is sometimes accomplished proactively, in advance of stimuli or contexts that provoke distraction, conflict, or other challenges. We have proposed that proactive control is accomplished by the active maintenance of goal representations (Engle & Kane, 2004; Kane, Conway et al., 2007): If goals are not kept accessible, then strong distractors or habits may inappropriately capture ongoing cognition and performance, resulting in “goal neglect” errors (Duncan, 1995) and action slips.1 We also argue that goal maintenance, which varies with WMC, is fragile and can be disrupted by salient external stimuli or by task-unrelated thoughts (“TUTs”) that are mentally or environmentally cued (McVay & Kane, 2009; 2010; in press). By this view, individual differences in the ability to maintain on-task thoughts may contribute to WMC’s effects on attention-task performance. The on-line assessment of TUTs, then, provides a potentially powerful method to test our executive attention theory against those that do not hold attention control to be a significant source of WMC variation or its covariation with other capabilities (e.g., Colom et al., 2008; Mogle, Lovett, Stawski, & Sliwinski, 2008; Oberauer, Süß, Wilhelm, & Sander, 2007).
WMC, Goal Neglect, and Executive Control
Tasks requiring subjects to occasionally withhold prepotent responses in favor of novel ones provided initial evidence that WMC predicted goal neglect. In the antisaccade task, for example, subjects with higher WMC scores better resist the lure of a flashing visual cue in order to orient their attention away from the cue and towards the target that always appears in the opposite direction. On these antisaccade trials, higher WMC is associated with greater target-identification accuracy and fewer erroneous, “juked,” saccades toward the cues (Kane, Bleckley, Conway, & Engle, 2001; Unsworth et al., 2004). Higher WMC subjects thus seem to keep goal representations more accessible than do lower WMC subjects, allowing those goals to better guide behavior in the moment.
In subsequent work with the Stroop task, we manipulated the extent to which the task context reinforced the color-naming goal. Our idea was that WMC should predict goal neglect especially in situations that put a premium on proactively maintaining goal access (Kane & Engle, 2003; see also Marcovitch, Boseovski, Knapp, & Kane, 2010). We therefore presented mostly congruent trials (75 – 80% of trials), in which words were presented in their matching colors (e.g., “RED” in red), along with explicit instructions to continue ignoring the words even if they often matched their color. This high-congruent context thus allowed subjects who failed to maintain the color-naming goal to nonetheless respond accurately on most trials based on a word-reading habit. Indeed, lower WMC subjects more often slipped into word reading than did higher WMC subjects, leading them to commit significantly more errors on infrequent incongruent trials (and to respond especially quickly on congruent trials, also suggestive of word reading). We found no such accuracy differences between WMC groups in low congruency contexts, where most trials presented color-word conflict, thus reinforcing the ignore-the-word goal. We thus argued that, in the absence of strong external support, subjects with lower WMC will more often lose access to task goals and commit habit-based errors than will higher-WMC subjects.
Kane and Engle (2003) further suggested that, even though high-congruency contexts yielded significant WMC differences in accuracy, evidence for goal neglect might also arise in subjects’ longest reaction times (RTs; see also DeJong, 2001). That is, occasional long RTs might reflect momentary, incomplete failures of goal maintenance that are corrected just in time (perhaps in response to conflict-detection mechanisms; e.g., Botvinick, Braver, Barch, Carter, & Cohen, 2001). These arguments paralleled those previously made in the intelligence literature regarding individual differences in long RTs (i.e., the “worst performance rule”; Larson & Alderton, 1990). The worst performance rule describes the fact that the longest RTs that people sometimes commit in choice-RT tasks are more strongly correlated with their cognitive ability (e.g., fluid intelligence) than are the shortest RTs that they are able to commit. That is, when individual subjects’ RTs are ranked from shortest to longest and averaged into quantile bins, RT-intelligence correlations increase steadily with increasing RT quantiles (for a review, see Coyle, 2003). According to many researchers, fluctuations in WM maintenance (Larson & Alderton, 1990; Larson & Saccuzo, 1989) or in attention to the task (Jensen, 1992) explain the worst performance rule (but see Ratcliff, Schmiedek, & McKoon, 2008). Momentary lapses in task focus result in especially long RTs to affected trials, and people with lower intelligence suffer more of these lapses. This explanation is, of course, consistent with the executive-attention theory of WMC, according to which high-WMC subjects have better goal-maintenance capabilities and therefore commit fewer long RTs due to lapses of attention than do low-WMC subjects.
Unworth, Redick, Lakey, and Young (2010) tested whether the worst performance rule applied to WMC by examining vigilance-task RTs by ranked bins, as is typical in such studies. They also quantified worst performance by considering the tail of the positively skewed RT distribution. Ex-Gaussian models represent individual subjects’ RT distributions as a convolution of a Gaussian distribution and an exponential distribution; such models have three parameters, the mean and standard deviation of the Gaussian component, mu (μ) and sigma (σ), and the mean of the exponential, tail component, tau (τ). By the worst performance rule, Unsworth et al. expected WMC to predict the tail, or τ, more strongly than the leading edge, or μ, of the RT distribution. Indeed, τ is sensitive to experimental manipulations of, and age-related differences in, executive control (e.g., DeJong, Berendsen, & Cools, 1999; Tse et al. 2010; West, 2001); variation in the τ parameter may therefore reflect, at least in part, periodic lapses of attention to task goals. Unsworth et al. used latent-variable analyses to derive a WMC factor from multiple tasks and to test its relation to vigilance-task RT quintiles and ex-Gaussian parameters. WMC correlated more strongly with longer than with shorter RT quintiles and more strongly with τ than with μ. Unsworth et al. thus concluded that WMC-related variation in “worst performance,” or long RTs, reflected variation in susceptibility to attentional lapses or TUTs, consistent with executive attention theory (e.g., Kane, Conway et al., 2007; Unsworth & Spillers, 2010).
An Alternative “Binding” View of WMC and Long RTs
Yet other interpretations are possible. For example, the coordinative binding theory attributes individual differences in WMC, and WMC’s relation to intellectual ability, to a limited capacity for temporary, simultaneous bindings of distinct mental representations into coherent cognitive structures (e.g., Oberauer, 2005, 2009; Oberauer et al., 2007). Oberauer and colleagues argue that the evidence for a strong association between WMC and executive control is not yet compelling, noting that individual differences in WMC variation only weakly predict task-set-switching costs, which arguably mark deficiencies in executive control (Oberauer et al., 2007; but for an alternative view, see Kane, Conway et al., 2007). Moreover, coordinative binding theory explains the empirical associations between WMC and response-conflict tasks, such as antisaccade and Stroop, via the demands on stimulus-response (S-R) binding, rather than on executive control (Oberauer, 2009; Wilhelm & Oberauer, 2006). In such “attention” tasks, the critical trials require highly incompatible S-R mappings (e.g., if a flash appears to the right, look left; if RED appears in blue, say “blue”). According to Oberauer, lower WMC subjects’ difficulties here result from deficiencies in temporarily binding the task-relevant stimuli onto arbitrary response rules and maintaining those novel bindings throughout the task. Thus, binding deficits – and not control failures – lead to problems in response selection and performance.
Based on this binding view, Schmiedek, Oberauer, Wilhelm, Süβ, and Wittman (2007) also presented an alternate account of the worst performance rule, whereby lapses of attention do not contribute to the relation between long RTs and cognitive ability (e.g., WMC). Rather, WMC-related differences in establishing and maintaining S-R bindings lead to differences in the “efficiency of information transmission between stimuli and responses” (p. 425), and generally poor efficiency produces occasionally long RTs (see also Martínez & Colom, 2009). Schmiedek et al. used a version of Ratcliff’s diffusion model to assess “information-processing efficiency” (drift rate of the evidence-accumulation process; e.g., Ratcliff & Rouder, 1998; Ratcliff & Smith, 2004) and then examined the association between the efficiency/drift parameter and τ. In brief, the diffusion model is a random-walk, evidence-accumulation model that quantitatively accounts for choice-task accuracy and RT data (including RT distributions), typically via seven or eight main parameters of interest that correspond to between- and within-subject processing variables2; it thus models both group- and individual-level data.
Schmiedek et al. (2007) derived μ, σ, and τ latent factors from the ex-Gaussian parameter estimates across eight choice-RT tasks and used structural equation modeling to test relations of these factors to a WMC factor based on six tasks. Only the τ factor predicted unique variance in WMC (β = −.90). For diffusion modeling, however, given the limited number of trials per RT task, Schmiedek et al. used a reduced, “EZdiffusion” model that estimates only three parameters (Wagenmakers, van der Maas, & Grasman, 2007): (1) the response criterion, or initial distance between the start point and decision boundaries; (2) the nondecision parameter, or time spent on non-decision processes (e.g., stimulus encoding, response execution), and; (3) the drift rate, or mean rate at which evidence accumulates towards a boundary (for Schmiedek et al., drift rate reflected the general quality of the information processing). The authors proposed that τ is driven primarily by drift rate, and that drift rate accounts for the WMC-τ correlation. Indeed, Schmiedek et al. found that the WMC-τ association was of similar magnitude to the WMC-drift rate association. Moreover, a subsequent simulation study took the EZdiffusion parameter values derived from the RT data, simulated new RTs based on only those parameters, and successfully reproduced the original WMC-τ correlation. It appears, then, that only three parameters were necessary to explain WMC-related variation in RT, none of which corresponded closely to attentional lapses. The evidence thus suggested that WMC may predict long RTs in simple tasks without appealing to any influences of attentional lapses or mind-wandering (TUT) experiences.
Schmiedek et al. (2007) acknowledged that they could not rule out some (potentially minor) contribution of attentional lapses to individual differences in τ, worst performance, and WMC variation therein. They also argued, however, that additional positive evidence for such an attentional contribution was needed because their EZdiffusion modeling results, which required no attentional-lapse parameter, provided a more parsimonious account. The main goal of the present study was to test for just that positive evidence for attentional lapses influencing long RTs and WMC’s association with them.
Our logic was that attentional lapses can be measured, albeit imperfectly, via thought probes that ask subjects to report whether their immediately preceding thoughts were on- or off-task (for a review, see Smallwood & Schooler, 2006). By probing for TUTs, we could test whether variation in off-task thinking was at all associated with WMC, τ, or both, and whether subjects’ mind-wandering rates might account for some of the shared variance between WMC and τ. If individual differences in τ reflect, in part, diffusion-model drift rate (or something like general processing efficiency), but not the effects of attentional lapses (Schmiedek et al., 2007), then τ estimates should be uncorrelated with subjects’ mind-wandering rates. If, however, TUT rate correlated with τ and, furthermore, if TUT rate mediated the association between WMC and τ, then this would provide novel evidence for the attention-lapse explanation of the worst performance rule and of WMC’s prediction of long RTs.
As well, the Schmiedek et al. (2007) inferential argument against attentional lapses was based on a reduced diffusion model that lacked a parameter corresponding to lapses. We suggest, along with Schmiedek et al., that attentional lapses might be captured by the diffusion model’s parameter η, or across-trial variation in drift rate. That is, subjects who more often flow between on- and off-task thought during a task should show more variation across trials in information accumulation, or drift rate. Because the EZdiffusion model has no drift-rate variability parameter, absorbing any effects of drift variability into drift rate (Wagenmakers et al., 2007), the Schmidek et al. argument from parsimony is weaker than it otherwise might be. Here, then, we modeled our subjects’ RT data using a quantitative evidence-accumulation model of choice that included parameters for both drift rate and its variability (the linear-ballistic accumulator model [LBA]; Brown & Heathcote, 2008), and tested whether individual differences in either parameter captured any WMC or TUT effects on RT task performance.
It is worth noting, however, that we do not claim that the τ parameter from ex-Gaussian models can be identified with any particular, singular cognitive process or ability, such as vulnerability to attentional lapses. As Matzke and Wagenmakers (2009) established, researchers have identified a remarkable breadth of experimental manipulations that seem, within the confines of any one investigation, to selectively affect τ. Theorists thus have proposed a variety of different cognitive processes that supposedly characterize, or give rise to, τ. Indeed, Matzke and Wagenmakers further demonstrated, via simulations and empirical work, that τ is sensitive to at least two different diffusion-model parameters, corresponding to the theoretical processes of evidence accumulation and criterion setting. Viewed collectively, then, the choice-RT literature indicates that τ (or “worst performance”) is not caused by a single process or mechanism. This really should not be surprising, given that slow responses must mean different things across different tasks that make unique cognitive demands, across different subjects who vary in abilities and motivations, and across varied contexts that afford a wealth of strategic approaches to tasks. Our purpose in this study is thus to test (contra Schmiedek et al., 2007) whether individual differences in vulnerability to attentional lapses play any contributing role – not the only role – in producing normal variation in τ, or very long RTs, within a particular long-duration, executive-control task that appears to elicit significant mind wandering (McVay & Kane, 2009).
WMC, Mind Wandering, and Task Performance
In line with executive-attention theory (e.g., Engle & Kane, 2004; Kane, Conway et al., 2007), WMC variation predicts the propensity for mind wandering during cognitively demanding tasks and activities in daily life (Alloway, Gathercole, Kirkwood, & Elliott, 2009; Gathercole et al., 2008; Kane, Brown et. al., 2007). But does this WMC-related variability in TUTs contribute to empirical associations between WMC and task performance, including long RTs? As a preliminary test of executive-attention versus coordinative-binding theories, McVay and Kane (2009) administered WMC tasks and a go/no-go task (the “SART;” Robertson, Manly, Andrade, Baddeley, & Yiend, 1997) that featured periodic thought probes to assess subjects’ thoughts (as on- versus off-task) in the moments before critical no-go trials. Binding theory claims no link between WMC and attentional lapses, nor a contribution for mind wandering to WMC-related variation in executive-task performance. In fact, McVay and Kane found that subjects generally made more errors on trials on which they reported off-task versus on-task thoughts, and individual differences in TUT rate predicted overall SART performance and WMC. Furthermore, in regression analyses, TUT rate partially mediated the relation between WMC and SART performance. All of these correlational results suggest a role for thought control in executive control more broadly, and they support executive attention theory more specifically. McVay and Kane argued that it was not clear how limitations in capacity for temporary bindings (Oberauer et al., 2007) could account for a greater incidence of mind wandering in low versus high WMC individuals or, most critically, for these TUT rates contributing to WMC correlations with task performance.
At the same time, the McVay and Kane (2009) regression results indicated that TUT rate only partially mediated WMC’s effects on performance. That is, WMC accounted for significant SART variance beyond that shared with mind wandering, and so attentional lapses could not fully explain WMC variation or covariation. We thus argued, based on the dual-component executive attention theory (Engle & Kane, 2004; Kane, Conway et al., 2007; see also Braver et al., 2007), that the additional, TUT-independent variance was attributable to the more reactive, competition-resolution component of executive control, rather than the more proactive, goal-maintenance component. The SART’s frequent go trials and rare no-go trials build up a habitual tendency to respond rather than withhold responding. This creates additional interference on the no-go trials such that, even when the goal of the task is proactively maintained, subjects still experience in-the-moment response conflict and sometimes produce incorrect responses. Thus, the SART, like the Stroop task (Kane & Engle, 2003), may be sensitive to WMC variation due to the premium it puts on both goal maintenance and competition resolution. According to McVay and Kane, then, individual differences in competition resolution explain the WMC-related variance in SART performance that is unrelated to TUT rate:
We therefore suggest that WMC’s TUT-independent prediction of SART performance is largely due to its relation to competition resolution. If so, two predictions follow: (a) A SART that induces weaker prepotencies to overcome should correlate less strongly with WMC (due to a minimization of competition-resolution variance) and (b) SART variance that is predicted by WMC should be more fully mediated by TUT rate, as subjects must maintain goal activation that is not externally reinforced (McVay & Kane, 2009, p. 203).
Thus, a primary goal of the current study was to assess mind wandering and its consequences in a version of the SART that made less demand on competition-resolution processes. Here we administered two versions of the SART in a between-subjects design: The standard SART, with infrequent no-go targets, and a vigilance SART, with infrequent “go” targets. The vigilance SART, then, like classic vigilance tasks (see Davies & Parasuraman, 1982), required subjects to withhold responses to most trials and wait to respond overtly to rare targets. By simply reversing the proportions of go and no/go trials, we removed the habit-inducing “go” response from the task and made it primarily dependent on goal maintenance, rather than competition resolution. We predicted, therefore, that without additional demands for competition resolution, TUT variation (and attendant disruptions to goal maintenance) would fully mediate the association between WMC and vigilance-SART performance. Note also that current instantiations of binding theory (e.g., Oberauer et al., 2007) similarly predicts WMC to correlate with standard SART performance beyond any influence of TUT rate, due to WMC-related variation in S-R binding. However, the S-R rules for the standard and vigilance SART were identical (press a key to animal names only) and so binding theory would seem to predict similar WMC associations to performance of both SART versions, and little influence of TUT rate in either.3
Objective Markers of Mind Wandering in RTs?
Mind wandering, as the subjective experience that accompanies attentional lapses, is typically measured subjectively: Subjects describe or classify their immediately preceding thoughts or experiences at periodic probes that briefly interrupt the ongoing primary task (Smallwood & Schooler, 2006). Despite their introspective nature, subjects’ immediate thought reports appear to be reasonably valid. Such validity is not unexpected, given that these verbal reports describe contents of experiences rather than interpretations or explanations of those experiences (Nisbett & Wilson, 1977; Wilson, 2002). Across multiple laboratories, probed TUT reports vary consistently with: 1) experimental treatments and task demands (e.g., Antrobus, Singer, & Greenberg, 1966; Forster & Lavie, 2009; Giambra, 1989, 1995; Grodsky & Giambra, 1990–91; McKiernan D’Angelo, Kaufman, & Binder, 2006; Stuyven & Van der Goten, 1995; Teasdale et al., 1995; Teasdale, Proctor, Lloyd, & Baddeley, 1993); 2) practice and time on task (e.g., Antrobus, Coleman, & Singer, 1967; Antrobus et al., 1966; McVay & Kane, 2009; Perry & Laurie, 2001; Smallwood et al., 2004; Smallwood, Obonsawin, & Reid, 2002–2003, Smallwood, Riby, Heim, & Davies, 2006; Teasdale et al., 1995); 3) subjective and objective measures of task performance (McVay & Kane, 2009; McVay, Kane, & Kwapil, 2009; Schooler, Reichle, & Halpern, 2005; Smallwood, McSpadden, & Schooler, 2008; Smallwood, McSpadden, Luus, & Schooler, 2008); 4) neuroimaging signatures (e.g., Christoff, Gordon, Smallwood, Smith, & Schooler, 2009; Mason et al., 2007; McGuire, Paulesu, Frackowiak, & Frith, 1996; McKiernan et al., 2006; Smallwood, Beach, Schooler, & Handy, 2008), and; 5) individual-differences variables (e.g., Giambra 1989, 1993; Kane, Brown et al., 2007; McVay & Kane, 2009; Shaw & Giambra, 1993; Smallwood, Obansawin, Baracaia et al., 2002–03; Smallwood, O’Conner, Sudbery, & Obansawin, 2007). Nonetheless, inherent subjectivity of thought reports has led investigators to seek objective behavioral markers of attentional lapses and TUT experiences.
Some authors have suggested that neglect-type performance errors may serve as objective measures of TUTs, at least in some task contexts (Cheyne, Solman, Carriere, & Smilek, 2009; Smallwood, Beach et al., 2008; Smallwood, Fitzgerald, Miles, & Phillips, 2009; Smallwood, McSpadden, Luus et al., 2008; but see Smallwood et al., 2006). Empirical evidence indicates, however, that TUTs and errors are not always interchangeable. Although they may elicit somewhat similar eventrelated potentials (Smallwood, Beach et al., 2008), goal-neglect errors and TUT reports can vary independently. Smallwood, McSpadden, Luus et al. (2008) found that faster stimulus presentation rates reduced TUTs but not errors. As well, McVay and Kane (2009) found that errors increased when subjects reported mind wandering versus on-task thinking, but mean error rate during TUTs did not approach 100% (it was 68%); moreover, the error rate during reports of on-task thinking was a sizeable 34%. Theoretically, of course, SART errors may arise not only from goal-neglect, but also from insufficient resolution of response competition, from momentary speed-accuracy shifts, or from myriad other sources (see also Helton et al., 2005; Helton, Weil, Middlemiss, & Sawers, 2010). Errors and mind wandering, therefore, are not likely to be isomorphic in all contexts, and so they should not be treated as interchangeable without independent evidence.
Might transient changes in RTs provide a more consistent objective signal of lapses? Robertson et al. (1997) observed a speed-up of RTs in the trials immediately preceding a target-trial error in the SART. Although they suggested that these shorter RTs predict errors because they reflect “mindless responding,” Robertson et al. did not assess TUTs via thought reports. McVay and Kane (2009) similarly found that shorter RTs preceded both errors (versus accurately withheld target responses) and TUTs (versus on-task thought reports; see also Smallwood et al., 2004; Smallwood, McSpadden, Luus et al., 2008). However, as yet another indication of the divergence between objective and subjective measures of attentional lapses, the magnitude of the RT difference on trials preceding errors versus accurate responses (M = 73 ms) was much greater that preceding TUTs versus on-task thoughts (M = 11 ms), suggesting that there can be more to these short pre-error RTs than just mind wandering. Indeed, Jackson and Balota (2011) have also found that older and younger adults differ dramatically in self-reported TUT rates during the SART (with older adults reporting much less mind-wandering), and yet both younger and older adults speed up similarly in the trials that occur just before no-go errors. Thus, in the same way that errors may have multiple causes, an RT speed-up in the SART may reflect not only TUTs, but also (or instead) a build-up of motor habit or a speed-accuracy tradeoff.
Smallwood, McSpadden, Luus et al. (2008) undertook a more sophisticated investigation of SART RT sequences, searching for consistent time-series patterns and testing whether any predicted imminent errors or TUTs. Their SART manipulated presentation rate and block length, and each block terminated in either a thought probe or no-go target. Using principal components analysis (PCA) on RTs from the 12 non-targets that preceded block endings, Smallwood, McSpadden, Luus et al. extracted three components onto which all RT sequences loaded. 4 The components represented, in order of variance accounted for: 1) general RT, or the extent to which each run of 12 was faster or slower than average; 2) linear RT change (slowing or speeding) just prior to the probe or target that terminated the block; and, 3) quadratic RT change (from slower to faster to slower, or vice versa), just prior to probe or target. In fact, the outcomes of interest were modestly predicted by some of these components. Component 2 had significantly higher scores on trials preceding an error as compared to a baseline (i.e., all blocks terminating in thought probes). The runs preceding on-task thought reports, in contrast, had lower component 2 scores than baseline (i.e., all blocks terminating in a target). Finally, blocks ending in “zone-out” reports (i.e., TUTs without one’s prior awareness; Schooler, 2002) had lower component 1 scores than did those ending in on-task reports.
Smallwood, McSpadden, Luus et al. (2008) claimed that the discernable RT patterns prior to on-versus off-task thought reports may objectively mark TUTs. Unfortunately, in the key analyses of components 1 and 2, the differences in component scores involved a potentially contaminated baseline. That is, the baseline to which they compared component 2 scores for on-task thought reports included both correct and error trials, which had elevated component 2 scores in an analysis comparing errors to “baselines” that included both on- and off-task thought reports; this circularity would need to be broken in order to unambiguously interpret their findings. As well, Smallwood, McSpadden, Luus et al. intended to measure within-person, in-the-moment RT patterns that predicted performance and thoughts, but they failed to standardize RTs within subjects, and so between-subject differences in RTs may have had undue influence on the principal components (see, e.g., Klinger & Cox, 1987–88). That is, rather than indicating that TUTs are more likely to occur on occasions in which a subject speeds up before a probe, their findings may have indicated that TUTs are more likely to occur for subjects who tend to speed up. Thus, as a secondary goal of this study, we attempted to replicate the RT patterns from Smallwood, McSpadden, Luus et al. (2008) with a stronger analytic approach.
Summary of Experimental Aims
In a single, large-N study we examined the executive attention (Engle & Kane, 2004; Kane, Conway et al. 2007) and coordinative binding (Oberauer et al., 2007; Wilhelm & Oberauer, 2006) theories of WMC in two ways. In both, we relied on probed thought reports to measure attentional lapses as TUT experiences. First, we tested the extent to which individual differences in TUT rate mediated the WMC-SART association, when SART performance relied heavily on both goal-maintenance and competition-resolution processes (in the standard, go/no-go SART) versus when it relied little on competition resolution (in the vigilance SART). Executive attention theory predicted that TUT rate would partially mediate the WMC-performance relation when both goal maintenance and competition resolution were needed (replicating McVay & Kane, 2009), but that TUT rate would more fully mediate the WMC relation when only goal maintenance was needed. Second, we asked whether, by measuring attentional lapses via thought probes and modeling SART RTs with an evidence-accumulation model that assessed drift-rate variability, we would find evidence that the worst performance rule in RTs was at all influenced by attentional lapses, as claimed by executive attention theory (see Unsworth et al., 2010). The coordinative binding theory, in contrast, claims that worst performance, and WMC’s association with it, reflects general information-processing efficiency (indicted by drift rate) resulting from S-R binding effectiveness rather than attention lapses (Schmeidek et al., 2007). Finally, we used RTs as a predictor rather than an outcome of interest by investigating whether latency time-series data, particularly series preceding subjects’ performance errors or TUT reports, might provide converging, objective evidence for attentional lapses. Here we specifically tested whether the Smallwood, McSpadden, Luus et al. (2008) findings, which appear so promising in this regard, would replicate in a substantially larger dataset and with an improved analytic approach.
Methods
Subjects
Two-hundred eighty-eight undergraduates (aged 18 – 35) at the University of North Carolina at Greensboro (UNCG) participated in two sessions, one testing WMC and one for the SART. We dropped data from four subjects who didn’t follow SART instructions (two each in the Standard and Vigilance tasks). Due to experimenter error, three subjects did not complete WMC testing (one from the Standard and two from the Vigilance groups); we included their SART data for all non-WMC-related analyses.
General Procedure
We tested subjects in groups of 1 – 6. They completed the WMC and SART sessions within the same semester (M = 24 days between sessions, SD = 26, range = 1 – 95). During the first, WMC screening session, subjects completed the operation span (OSPAN), symmetry span (SSPAN), and reading span (RSPAN) tasks, in that order. During the second session, subjects completed the SART.
WMC Screening
In 90 min sessions, subjects completed three automated complex-span tasks: OSPAN, RSPAN, and SSPAN. The tasks required subjects to maintain access to memory items while completing an unrelated processing task; the processing task had an individualized response-latency deadline (M + 2.5 SDs), calculated during 15 processing-task-only practice items (Unsworth, Heitz, Schrock, & Engle, 2005; Unsworth, Redick, Heitz, Broadway, & Engle, 2009). Each trial of the processing task was followed, 200 ms later, by a memory item. In OSPAN, subjects verified compound equations while remembering letters (from a pool of 12), each presented for 250 ms following every equation. For example, following a screen with, “(2*2) + 1 = 5,” the subject would click a response (TRUE or FALSE) with a computer mouse and then see the to-be-remembered letter, “F,” onscreen. RSPAN similarly required subjects to remember letters, but while verifying the meaningfulness of sentences (e.g., “I like to run in the sky.”). In SSPAN, subjects verified vertical symmetry of black-and-white matrix patterns while remembering the locations of red squares on a 4 × 4 grid. Each red square was presented for 650 ms after the symmetry problem.
The WMC tasks presented each set length (3 – 7 in OSPAN and RSPAN; 2 – 5 in SSPAN) three times, randomly ordered for each subject. At the end of each set, subjects recalled the memory items in serial order. For OSPAN and RSPAN, subjects used a mouse to click on that set’s letters in order, presented among the full pool of 12 letters. For SSPAN, subjects used a mouse to click the previously occupied squares in order, within an empty 4 × 4 grid.
The span score for each task was the sum of items recalled in serial position (of 75 in OSPAN and RSPAN and 42 in SSPAN; Conway, et al., 2005). We converted span scores to z scores (based on the Ms and SDs from our UNCG database of over 2,000 undergraduates) and averaged them into a WMC composite. Scores correlated r = .64 (RSPAN × OSPAN), r = .52 (OSPAN × SSPAN), and r = .47 (SSPAN × RSPAN). The WMC variable was normally distributed (skew = −0.67; kurtosis = 0.14)
SART Session
Materials and Design
The design was a 2 × 2 mixed-model factorial, with SART type (“Standard” vs. “Vigilance”) manipulated between subjects and Trial type (Target, Non-target) within. In the Standard SART (N = 142), subjects responded to frequent non-target words and withheld responses to infrequent (11%) target words; thus, as is standard for the SART, it was a go/no-go task that elicited a “go” prepotency. In the Vigilance SART (N = 142), in contrast, subjects responded only to the infrequent (11%) targets; it was therefore a prototypical vigilance task without any “go” prepotency. For both SARTs, the words were from two different categories (foods and animals; e.g., animals as targets and foods as non-targets). Stimuli appeared in black against a white background, in 18 pt Courier-New font, via CRT or LCD monitors.
Procedure
The SART was the same as the semantic version used by McVay and Kane (2009), aside from the instructions. Subjects in the Standard SART (replicating McVay & Kane) pressed the space bar as quickly as possible when frequent non-target words appeared onscreen; they withheld responses to rare targets. Subjects in the Vigilance SART, in contrast, did the reverse and withheld responses to frequent non-target words and quickly pressed the space bar only when infrequent targets appeared.
Subjects completed 1810 trials with each stimulus centered for 250 ms, followed by a 950 ms mask of 12 capitalized Xs, the length of the longest stimulus. The first 10 (unanalyzed) buffer trials presented non-targets. The remaining trials comprised eight blocks, each presenting 225 trials consisting of 45 words repeating five times in a different random order. Within each set of 45, five targets appeared in random order among 40 non-targets (11% of trials). Thought probes followed 60% of targets within each block. After the first four blocks, subjects took a 30 s break.
Thought-probe screens presented the question: “What were you just thinking about?” and seven response options. We instructed subjects to report what they were thinking in the moment before the probe appeared, and our instructions elaborated on these choices: 1) task: thinking about the stimulus words or appropriate response; 2) task performance: thoughts evaluating one’s own performance; 3) everyday stuff: thinking about recent or impending life events or tasks; 4) current state of being: thinking about states such as hunger or sleepiness; 5) personal worries: thinking about life concerns, troubles, or fears; 6) daydreams: having fantasies disconnected from reality; 7) other: only for thoughts not fitting other categories. During the task, thought probes presented the response names (i.e., the italicized names above) and subjects pressed the corresponding number to indicate thought content.
Results
We report non-directional null-hypothesis significance tests (with alpha set to .05) and partial eta-squared (ηp2) as an effect-size estimate.
SART Performance
Accuracy
Mean accuracy rates for rare target trials were .42 in the Standard SART (“no-go” trials) and .85 in the Vigilance SART (“go” trials). For each subject, we calculated a signal-detection sensitivity score using the formula for logistic distributions (Snodgrass & Corwin, 1988): dL = ln{[H(1 – FA)]/[(1 – H)FA]}, and a CL score, representing bias, using: CL = 0.5[ln{[(1 – FA)(1 – H)]/[(H)(FA)]}], where ln = natural log, H = hit proportion, and FA = false-alarm proportion. We adjusted individual hit or false-alarm rates of 0 and 1 by .01. Negative CL scores reflect a “go” bias. Table 1 presents dL and CL scores by SART and task block (quarters), where it appears that performance was better overall in the Vigilance SART and that both dL and CL decreased over time only in the Standard SART.
Table 1.
Descriptive statistics for performance by task block for Standard SART (N = 142) and Vigilance SART (N = 142).
| SART | Dependent Variable | Block 1 | Block 2 | Block 3 | Block 4 |
|---|---|---|---|---|---|
| Standard | |||||
| dL | 3.58 (1.81) | 3.48 (2.09) | 3.11 (2.07) | 2.68 (1.98) | |
| CL | −2.12 (0.74) | −2.13 (0.74) | −1.93 (0.73) | −1.88 (0.75) | |
| M RT | 464.69 (97.16) | 463.65 (107.63) | 447.70 (108.52) | 436.64 (102.43) | |
| Intra-subject RT SD | 138.02 (42.52) | 152.53 (56.08) | 163.40 (66.44) | 181.14 (74.81) | |
| Vigilance | |||||
| dL | 6.80 (1.53) | 6.82 (1.71) | 6.89 (1.89) | 6.72 (2.07) | |
| CL | 1.20 (0.64) | 1.25 (0.65) | 1.23 (0.72) | 1.19 (0.76) | |
| M RT | 649.26 (63.65) | 677.36 (67.83) | 668.06 (74.03) | 677.94 (81.36) | |
| Intra-subject RT SD | 121.16 (27.78) | 129.90 (35.59) | 124.25 (40.88) | 132.45 (44.84) |
Note: SART = Sustained Attention to Response Task; dL = signal-detection sensitivity measure on SART; CL = response-bias measure on SART; M RT = mean reaction time to non-target trials in SART; Intra-subject RT SD = intraindividual standard deviation for non-target reaction times in SART.
A 2 (SART Type) × 4 (Block) mixed-model ANOVA on dL confirmed a main effect of block, F(3, 828) = 13.02, MSE = 14.03, ηp2 = .05, and SART type, F(1, 276) = 2517.47, MSE = 3494.82 ηp2 = .90, modified by an interaction, F(3, 828) = 9.19, MSE = 9.89, ηp2 = .03. Sensitivity was higher in Vigilance than in Standard SART, and performance dropped significantly in the Standard, F(3, 423) = 28.52, MSE = 22.74, ηp2 = .17, but not the Vigilance task, F(3, 423) < 1. A 2 (SART Type) × 4 (Block) mixed-model ANOVA on CL indicated a main effect of block, F(3, 828) = 4.08, MSE = 0.96, ηp2 = .02, and SART type, F(1, 276) = 2185.73, MSE = 2854.80, ηp2 = .89, modified by an interaction, F(3, 828) = 5.82, MSE = 1.36, ηp2 = .02, indicating a “go” bias in Standard SART that decreased over blocks, F(3, 405) = 11.43, MSE = 2.19, ηp2 = .08 and a stable “no-go” bias in Vigilance SART, F(3, 423) < 1.
RT
The requirements of the two different SART versions produced different RT data for analysis: In Standard SART, subjects responded to frequent non-target trials whereas, in Vigilance SART, subjects responded only to the infrequent target trials. Thus, RTs were based on a maximum of 1600 trials per Standard SART subject, but only 200 trials per Vigilance subject. RT data from the two SARTs are, therefore, not directly comparable and we report them separately.
Standard SART
Table 1 presents the mean RT and mean intra-individual RT variability (standard deviation) on accurate non-target (“go”) trials across blocks. A repeated measures ANOVA on M RT indicated that subjects responded more quickly as the task progressed, F(3, 423) = 13.03, MSE = 25812.22, ηp2 = .09. Subjects’ reaction times to non-target “go” trials also became more variable with time on task, F(3, 423) = 45.27, MSE = 46930.73, ηp2 = .24 .
Standard SART RTs to non-targets are shorter preceding target errors than preceding accurate no-go responses (Cheyne, et al., 2009; McVay & Kane, 2009; Robertson et al., 1997; Smallwood et al., 2004) and shorter preceding TUTs than on-task reports (McVay & Kane, 2009). As in McVay and Kane (2009), we collapsed RTs over the four non-target trials preceding a target and, as expected, they were shorter (M = 418) preceding errors than preceding correct “no-go” responses (M = 502; t(141) = 23.81). TUT reports were also preceded by faster RTs (M = 442) than were on-task thought reports (M = 462; t(141) = 4.21). Replicating McVay and Kane (2009), the RT decrease preceding errors was considerably larger than that preceding TUT reports, suggesting that SART errors and TUT reports were not isomorphic.
Vigilance SART
Table 1 presents the means and intra-individual variability of RTs on accurate target (“go”) trials across quarters. A repeated measures ANOVA on M RT indicated that, in contrast to the Standard SART, subjects in the Vigilance SART responded more slowly as the task progressed, F(3, 423) = 16.64, MSE = 25450.09, ηp2 = .11. Subjects’ RTs to rare “go” target trials also became more variable with time on task, F(3, 423) = 5.37, MSE = 3775.90, ηp2 = .04.
Thought Reports
In the Standard SART, subjects reported task-related and task-unrelated thoughts (TUTs) on an average of 22.1% and 52.5% of the probes, respectively. We defined TUTs as thoughts about current state (M = 22.4%), daydreams (10.4%), everyday stuff (8.6%), worries (4.9%), and other (6.4%). In the Vigilance SART, subjects reported task-related and task-unrelated thoughts on 29.8% and 52.8% of the probes, respectively: current state (M = 24.8%), daydreams (9.9%), everyday stuff (7.9%), worries (5.4%), and other (4.9%). The remaining probe responses represented self-evaluative thoughts, or “task-related interference” (TRI; Smallwood et al., 2006); because TRI represents a hybrid between task-related and task-unrelated thinking, that is, they are about one’s task performance but not about the task, itself, we will later address it separately.
Figure 1 shows that TUT rates increased, and on-task thought decreased, over blocks in both SARTs. For TUTs, a 2 (SART Type) × 4 (Block) mixed ANOVA indicated an increase over blocks, F(3, 846) = 251.24, MSE = 5.09, ηp2 = .47, that didn’t differ between SART types, F(3, 846) = 1.83, ηp2 = .01, p = .14. In a parallel analysis, on-task thought rates decreased over blocks, F(3, 846) = 90.73, MSE = 1.43, ηp2 = .24, and were lower for Standard than for Vigilance subjects, F(1, 282) = 10.54, MSE = 1.67, ηp2 = .04; block and SART type did not interact, F(3, 846) = 1.81, ηp2 = .01, p = .14.
Figure 1.
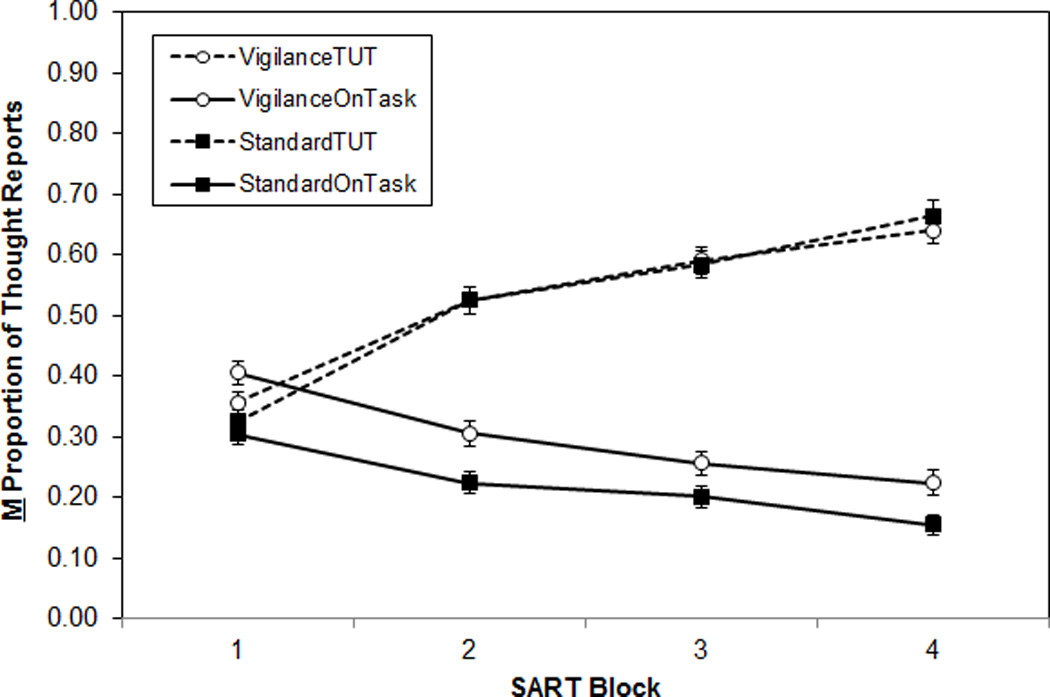
Mean proportion of thought reports, by SART type (Standard, Vigilance), by thought category (On-task, TUT), across task blocks (N = 284). Error bars represent standard errors. Note: TUT = task-unrelated thought; OnTask = on-task thought.
Performance by Thought Report
In both SARTs, in-the-moment target accuracy was predicted by thought content (see Figure 2). A 2 (Thought report) × 2 (SART Type) × 4 (Block) repeated-measures ANOVA indicated more accurate responding preceding on- versus off-task thought reports, F(3, 161) = 217.65, ME = 14.21, ηp2 = .58, and in the Vigilance SART versus the Standard SART, F(1, 161) = 160.82, MSE = 35.94, ηp2 = .50; these main effects were modified by a thought report × SART-type interaction, F(1, 161) = 32.93, MSE = 2.15, ηp2 = .17 (no block effects or interactions were significant; Fs < 2.00 and ps > .10). Although target accuracy was significantly higher for trials preceding on-task thought reports versus TUTs for both Standard and Vigilance SARTs (ts > 8.80), this thought-content effect on errors was significantly larger for the Standard SART.
Figure 2.
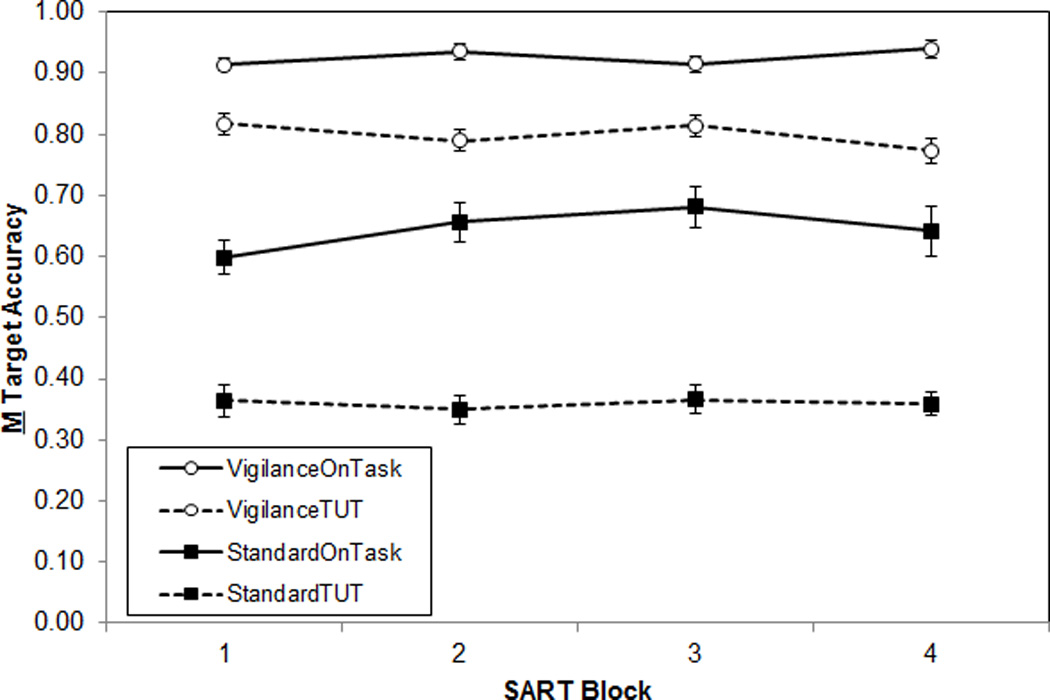
Mean accuracy on target trials, by SART type (Standard, Vigilance), by thought category (On-task, TUT), across task blocks (N = 284). Error bars represent standard errors. Note: TUT = task-unrelated thought; OnTask = on-task thought.
At the level of intra-task individual differences, subjects’ TUT rate in Standard SART significantly predicted dL (r = −.30), mean non-target RT (r = −.17), and non-target RT variability (r = .25), but not CL (r = −.01); in Vigilance SART, TUT rate also predicted dL (r = −.31), but not mean target RT (r = −.01), target RT variability (r = .05), or CL (r = .03). TUT-dL correlations increased significantly from block 1 to 2 in both the Standard SART (rs = −.08, −.34, −.32, −.35 for blocks 1 – 4, respectively) and Vigilance SART (rs = −.06, −.36, −.31, −.25), as indicated by Williams’s t-test (Steiger, 1980).
Inter-task Individual Differences
WMC scores (z-score composites) did not differ between SART groups (Standard SART M = 0.14, SD = 0.88, and Vigilance M = 0.13, SD = 0.85; t < 1). Tables 2A (Standard SART) and 2B (Vigilance SART) present reliability and correlation coefficients for the critical variables. As expected (and replicating McVay & Kane, 2009), WMC variation predicted performance and thought in Standard SART, correlating modestly but significantly with dL, within-subject RT variability, and TUT rate. In contrast, in Vigilance SART, WMC variation did not predict performance or TUT rate, despite higher TUT rates predicting worse performance (dL and RT variability), as noted above.
Table 2.
| A. Correlations among WMC, mind wandering, and performance measures in the Standard SART. | |||||
|---|---|---|---|---|---|
| WMC | TUT | dL | M RT | RT SD | |
| WMC | .791 | ||||
| TUT | −.175* | .908 | |||
| dL | .318** | −.304** | .941 | ||
| M RT | .039 | −.167* | .605** | .947 | |
| RT SD | −.366** | .254** | −.632** | −.129 | .913 |
| B. Correlations among WMC, mind wandering, and performance measures in the Vigilance SART. | |||||
|---|---|---|---|---|---|
| WMC | TUT | dL | M RT | RT SD | |
| WMC | .769 | ||||
| TUT | −.069 | .897 | |||
| dL | .114 | −.314** | .851 | ||
| M RT | .049 | .114 | −.245** | .905 | |
| RT SD | .025 | .302** | −.656** | .567** | .805 |
p < .01
p < .05
Note: N = 142 (N = 140 for WMC correlations). Values on the diagonal reflect Cronbach’s alpha for each measure as a reliability estimate; alphas were calculated over task blocks for SART measures and across the three separate span measures for WMC. SART = Sustained Attention to Response Task; WMC = working memory capacity; TUT = proportion self-reported task-unrelated thoughts; dL = signal-detection sensitivity measure on SART; RT SD = intraindividual standard deviation for non-target reaction times in SART; RT mean = mean reaction time to non-target trials in SART.
p < .01
p < .05
Note: N = 142 (N = 140 for WMC correlations). Values on the diagonal reflect Cronbach’s alpha for each measure as a reliability estimate; alphas were calculated over task blocks for SART measures and across the three separate span measures for WMC. SART = Sustained Attention to Response Task; WMC = working memory capacity; TUT = proportion self-reported task-unrelated thoughts; dL = signal-detection sensitivity measure on SART; RT SD = intraindividual standard deviation for non-target “go” target reaction times in SART; M RT= mean reaction time to target trials in SART.
Table 3 presents the results from hierarchical-regression analyses predicting Standard SART accuracy (dL) with WMC and TUT rate (we did not run parallel analyses on Vigilance SART because WMC did not predict performance). Replicating McVay and Kane (2009), WMC and TUT rate each accounted for shared and unique dL variance. WMC accounted for 10.1% of the dL variance, of which 2.9% (almost one-third) was shared with TUT rate and 7.2% was unique; TUTs predicted 6.4% of the SART dL variance independently of WMC (total R2 = .165). Table 4 presents hierarchical-regression analyses for Standard SART RT variability, where WMC accounted for 13.4% of the variance, of which 2.7% (about one-fifth) was shared with TUT rate and 10.7% was unique; TUT rate accounted for 3.7% of the variance beyond WMC (total R2 = .171).
Table 3.
Summary of Hierarchical Regression Analyses Using Signal-Detection Sensitivity Estimate (dL) in Standard SART. N =141.
| Variable | B | SE | Beta | t | R2 |
|---|---|---|---|---|---|
| Predictors: WMC, TUT | |||||
| Step 1: WMC | .703 | .178 | .318 | 3.953* | .101 |
| Step 2: WMC, TUT | −2.124 | .654 | −.257 | −3.250* | .165 |
| Predictors: TUT, WMC | |||||
| Step 1: TUT | −2.519 | .668 | −.304 | −3.769* | .093 |
| Step 2: TUT, WMC | .604 | .175 | .273 | 3.455* | .165 |
p < .05
Note: SART = Sustained Attention To Response Task; WMC = working memory capacity; TUT = proportion self-reported task-unrelated thoughts.
Table 4.
Hierarchical Regression Analyses on Standard SART Intraindividual Reaction Time Variation. N =141.
| Variable | B | SE | Beta | t | R2 |
|---|---|---|---|---|---|
| Predictors: WMC, TUT | |||||
| Step 1: WMC | −23.030 | 4.970 | −.366 | −4.634* | .134 |
| Step 2: WMC, TUT | 45.848 | 18.547 | .195 | 2.472* | .171 |
| Predictors: TUT, WMC | |||||
| Step 1: TUT | 59.516 | 19.330 | .253 | 3.079* | .064 |
| Step 2: TUT, WMC | −20.887 | 4.958 | −.332 | −4.213* | .171 |
p < .05
Note: SART = Sustained Attention to Response Task; WMC = working memory capacity; TUT = proportion self-reported task-unrelated thoughts.
Task-Related Interference (TRI)
Subjects’ thoughts about their own performance (TRI) comprised 25.4% of responses in the Standard SART (M proportions = .37, .25, .21, and .18 over blocks) and 17.4% of responses in the Vigilance SART (Ms = .24, .17, .15, and .14 over blocks). A 2 (SART Type) × 4 (Block) mixed ANOVA indicated that TRI rates decreased across blocks, F(3, 846) = 89.13, MSE = 1.14, ηp2 = .24, and that they were higher in the Standard than Vigilance SART, F(1, 282) = 17.16, MSE = 1.82, ηp2 = .06; these main effects were also modified by an interaction, F(3, 846) = 7.99, MSE = 0.10, ηp2 = .03; although TRI decreased over blocks in both conditions, the block × SART type interaction was significant from block 1 to block 2, indicating a steeper decrease in TRI reports in the Standard than in the Vigilance SART, F(1, 282) = 7.015, MSE = 0.18, ηp2 = .02.
Like TUTs, instances of TRI tended to predict in-the-moment errors in both tasks. Target accuracy rates were lower following TRI than following on-task thoughts in the Standard SART (Ms = .38 vs. .62 for TRI vs. on-task, t(134) = 10.54) and the Vigilance SART (Ms = .86 and .93 for TRI vs. on-task, t(136) = 5.10). Regarding individual differences, however, TRI behaved differently than TUTs: TRI rate did not significantly predict dL, mean RT, or RT variability in either SART (rs = .02, −.06, −.04 for Standard; .15, .08, −.11 for Vigilance). Moreover, WMC did not predict TRI rate in either the Standard or Vigilance SART (rs = −.04 and −.05, respectively).5
Discussion
The Vigilance version of the SART yielded better performance than the Standard SART, but the same rate of mind wandering. In both versions, TUTs increased with time on task and predicted (if not affected) performance on target trials. However, in the moment, TUTs seemed more detrimental to performance in the Standard than the Vigilance SART. In support of executive attention theory (Engle & Kane, 2004), WMC predicted TUTs in the Standard SART. Moreover, TUTs and WMC each accounted for shared and unique variance in SART performance, highlighting the role of goal maintenance as one component of attention control that varies with WMC. In the Vigilance SART, in contrast, WMC did not predict TUTs or performance. Although we did not predict this null effect, it is consistent with previous findings where WMC only predicted mind wandering or performance selectively, during demanding tasks that require a particular form of executive control (Kane, Brown et al., 2007; Poole & Kane 2009; see General Discussion for a more thorough treatment). We designed the Vigilance SART to reduce the need for competition resolution and, thereby, the variance predicted uniquely by WMC, beyond that shared with TUT rate. Instead, we have identified a task where TUTs significantly affect performance but WMC does not predict either thought or performance.
Lapses of Attention and RT Distributions
Here we evaluate the relation between WMC and subjects’ longest RTs using both the ranking and binning method (for a review, see Coyle, 2003) and individualized ex-Gaussian distributions (Schmiedek et al., 2007; Unsworth et al., 2010). Furthermore, we use TUTs, the subjective experience accompanying attention lapses, as an initial means to test whether the worst performance rule is best explained without referring to attention lapses, the conclusion drawn by Schmiedek et al. (2007) on the basis of RT modeling and parsimony. That is, they were able to account for WMC-related individual differences in long RTs using a quantitative model that had no parameter reflecting attentional lapses.
The SART is unique among tasks used to investigate the worst performance rule, however, in that attentional lapses are hypothesized to produce occasional very fast responses in addition to occasional very slow responses. That is, unlike the choice-RT tasks that researchers typically examine (including Schmiedek et al., 2007), the frequency of non-target trials in the SART builds a habitual “go” response. This prepotency of the “go” response makes the shortest RTs interesting as well, as excessively short RTs may reflect responses emitted before stimulus analysis is complete, as a result of habitual, mindless responding (Cheyne et al., 2009). We therefore expected subjects’ shortest RTs, as well as their longest RTs, to be related to their mind-wandering rates.
Methods
Subjects
We combined data from McVay and Kane (2009; N = 244) and from the Standard SART in the present experiment (N = 142) for a total of 386 subjects.
SART Versions
The SART from McVay and Kane (2009) was the same as the present Standard SART, with one exception. In McVay and Kane, subjects completed a perceptual, perceptual-semantic, or semantic version (the latter was identical to the present Standard task). The perceptual and perceptual-semantic SARTs instructed subjects to respond to lowercase words and withhold responses to infrequent uppercase words; in the perceptual-semantic SART, letter case also predicted perfectly the semantic category (e.g., all uppercase words were animal names and lowercase words were food names). McVay and Kane reported no differences in TUT rate or performance (dL) between the three SART types and so we here combined data from all SART versions.
Analyses
For each subject, we fit an ex-Gaussian function using quantile maximum likelihood estimation (QMLE; Brown & Heathcote, 2003) to non-target RTs. Due to program limitations, RTs from only 1199 trials from each subject can be entered. The SART has the potential for 1600 non-target RTs and so we trimmed the dataset for analysis. We first trimmed ambiguous RTs, those which may have been late responses from a previous trial or anticipations to the current trial (RT < 150ms). We then fit the distributions twice, once using 1199 randomly selected trials for each subject and once using all 1200 trials from the second, third, and fourth SART blocks (recall that these blocks yielded much higher TUT rates than did block 1, as well as significantly higher correlations between TUT rate and performance).
Results and Discussion
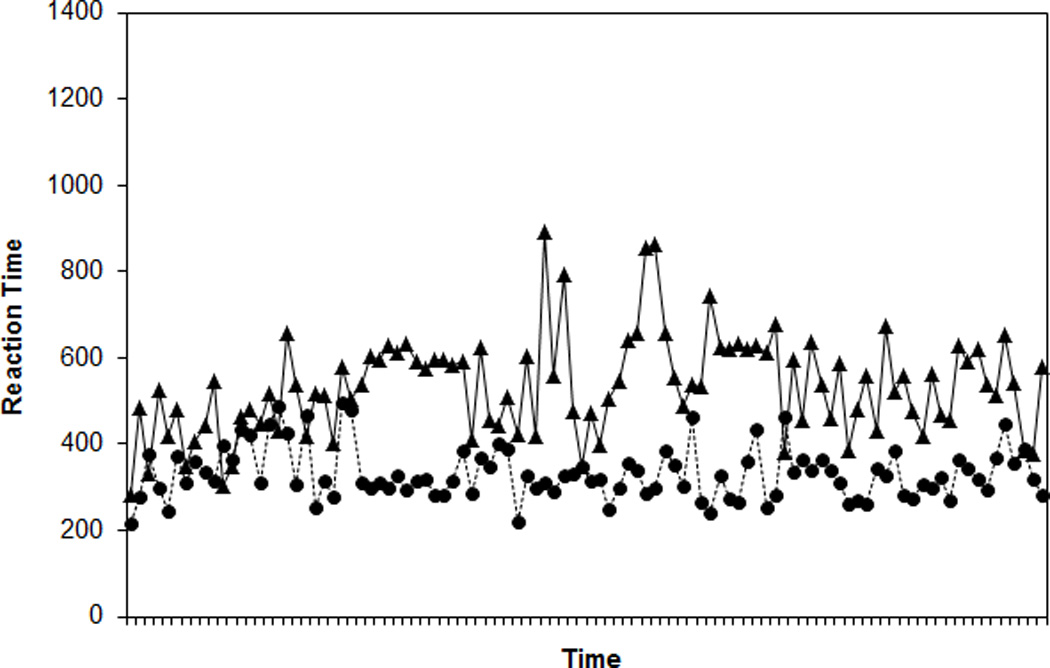
For a visual representation of WMC differences in RT variability (see also Unsworth et al., 2010), Figures 3A and 3B present 100 randomly selected RTs for two randomly selected higher WMC subjects (composite z-scores = 1.53 and 1.50) and two randomly selected lower WMC subjects (z-scores = −2.15; −2.24). Figure 4 presents ranked RTs from the same subjects. The Low WMC subjects show much greater RT variability from trial to trial and a greater range of RTs within the task.
Figure 3.
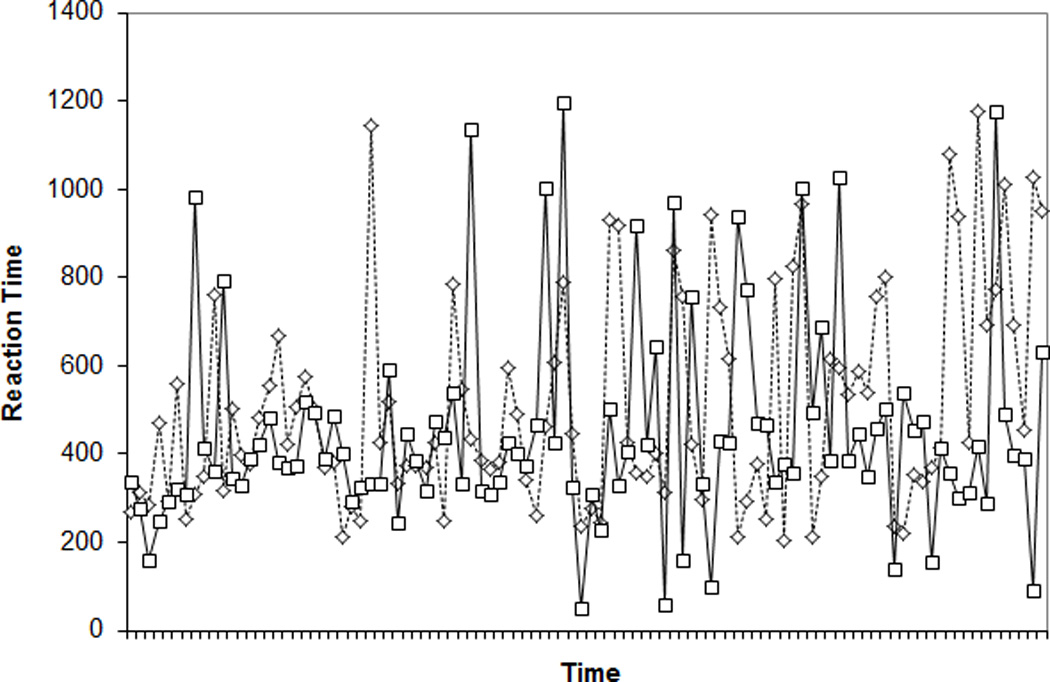
Response times (RTs) for 100 randomly selected trials for two randomly selected higher working memory capacity (WMC) subjects (Panel A) and two randomly selected lower WMC subjects (Panel B) from the Standard SART.
Figure 4.
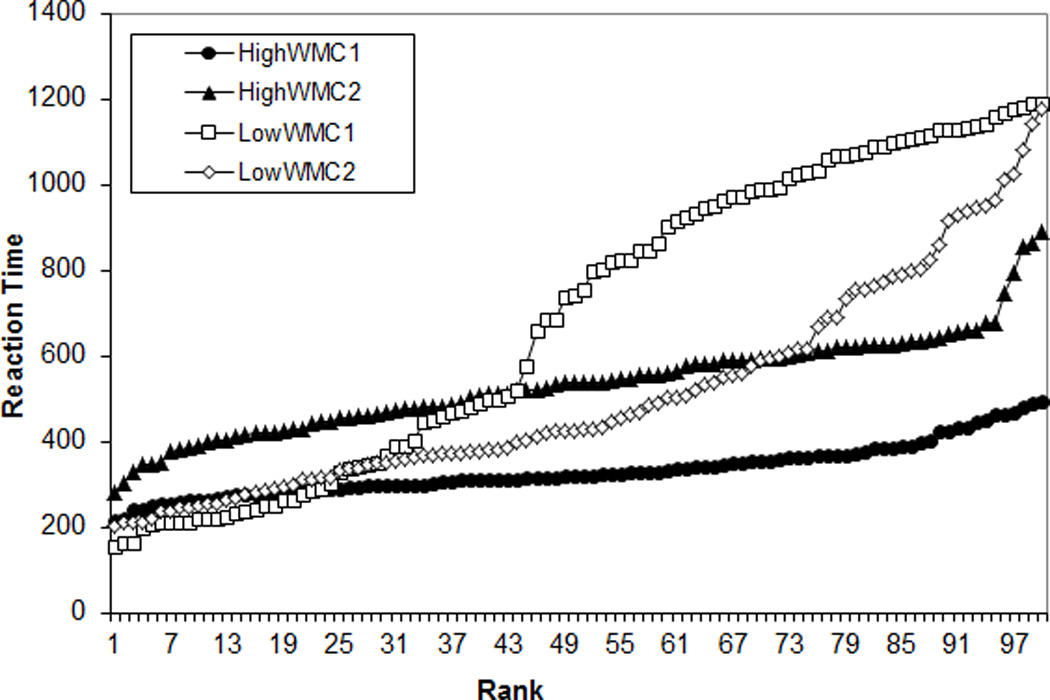
Ranked reaction times (RTs) for 100 randomly selected trials for two randomly selected higher working memory capacity (WMC) subjects and randomly selected lower WMC subjects from the Standard SART; HiWMC = higher WMC subject; LoWMC = lower WMC subject.
Descriptive statistics, for the ranked RTs by quintile, and the ex-Gaussian parameter estimates, are shown in Table 5. The theoretically critical τ parameter did not differ when estimated from 1199 random cases (M = 117) or from trial blocks 2 – 4 of the Standard SART (M = 117; t(384) < 1), so we will simply report the analyses on RT data from blocks 2 – 4, which is a preferable strategy because TUTs and performance measures were all drawn from the same set of trials.
Table 5.
Descriptive statistics for RT quintiles and ex-Gaussian parameters for Standard SART (N = 386; including subjects from McVay & Kane, 2009).
| DV | M | SD |
|---|---|---|
| Quintile 1 | 264.05 | 90.66 |
| Quintile 2 | 353.86 | 98.78 |
| Quintile 3 | 421.07 | 114.42 |
| Quintile 4 | 502.55 | 134.63 |
| Quintile 5 | 684.91 | 159.75 |
| μ | 325.52 | 130.97 |
| σ | 81.87 | 57.49 |
| τ | 118.78 | 74.38 |
Note: SART = Sustained Attention to Response Task ; DV = dependent variable ; quintiles 1–5 are from the ranked non-target RTs from the 2nd, 3rd, and 4th block of the SART; μ= mean of the Gaussian component; σ = standard deviation of the Gaussian component; τ = mean and standard deviation of the exponential component.
Table 6 shows the correlations between the RT quintiles and WMC, TUT rates, and SART accuracy (dL). WMC correlated negatively with the longest RTs and positively with the shortest, indicating that higher WMC subjects had more consistent and moderate RTs (i.e., their fastest RTs, in Q1, are relatively long and their slowest RTs, in Q5, are relatively short) than did lower WMC subjects. TUT rate showed the inverse (but logically consistent) pattern to WMC, with positive correlations with the slowest quintile and negative correlations with the fastest. Like people with lower WMC, people with higher TUT rates responded more variably, with their shortest times being shorter and longest times being longer than those of people with lower TUT rates. Regarding SART accuracy, the gradual change from positive to negative correlations across RT quintiles indicates there was an optimal, intermediate response speed for accurate performance on the SART: Subjects with the shortest RTs performed poorly, but so did those with the longest.
Table 6.
Correlations of WMC, TUT rate, sensitivity (dL) with quintile RTs and RT distribution parameters in the Standard SART (N = 386).
| DV | WMC | TUT | dL |
|---|---|---|---|
| Quintile 1 | .203** | −.260** | .758** |
| Quintile 2 | .135** | −.238** | .694** |
| Quintile 3 | .024 | −.170** | .523** |
| Quintile 4 | −.091 | −.030 | .309** |
| Quintile 5 | −.253** | .220** | −.175** |
| μ | .055 | −.183** | .432** |
| σ | −.044 | −.065 | .012 |
| τ | −.175** | .304** | −.420** |
p < .01
p < .05
Note: SART = Sustained Attention to Response Task; DV = Dependent variable; quintiles 1–5 are from the ranked non-target RTs from the 2nd, 3rd, and 4th block of the SART; μ= mean of the Gaussian component of the ex-Gaussian distribution; σ= standard deviation of the Gaussian component; τ= mean and standard deviation of the exponential component; WMC = working memory capacity; TUT = proportion of task-unrelated thought during the SART; dL = SART signal-detection sensitivity measure.
The relations among WMC, TUT, standard SART performance, and the ex-Gaussian RT parameter estimates (Table 6) tell a similar story to the longest RTs from the quintile analyses. As predicted, WMC and TUT rate predicted the τ parameter, indicating that subjects with lower WMC or higher TUT rates had more positively skewed RT distributions, reflecting their more frequent slowed responses. In slight contrast, dL correlated positively with μ and negatively with τ, indicating that slow-but-steady RTs yielded the most accurate performance in the SART. Of note, the correlations among our individual measures of primary interest, WMC, TUT rate, and τ, were not very large, and they were considerably weaker than those among the latent variables reported by Schmiedek et al. (2007).
For a better parallel to their analysis, then, we used our multiple WMC indices and multiple blocks of the SART task to derive latent variables for WMC, TUT, and τ. Figure 5A depicts a confirmatory factor analysis on these three constructs (using blocks 2 – 4 of the SART to derive TUT rate and τ latent variables), and the model fit the data well [χ2(24) = 41.91, χ2/df = 1.75, CFI = .99, RMSEA = .044, SRMR = .028]. Here, WMC and TUT rate each correlated substantially with τ, and the magnitude of the WMC and TUT correlations with τ were more similar here than in the univariate analyses reported in Table 6.
Figure 5.
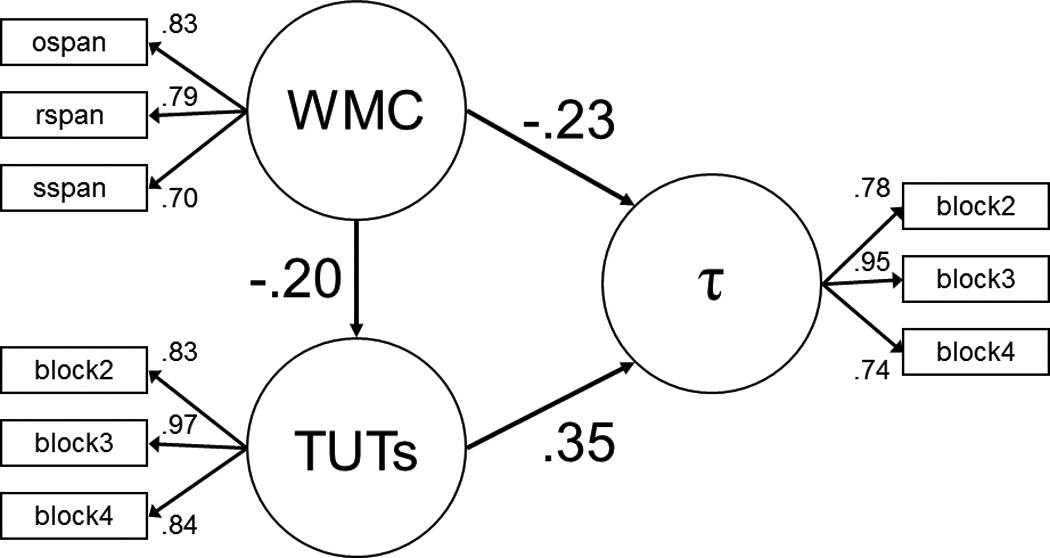
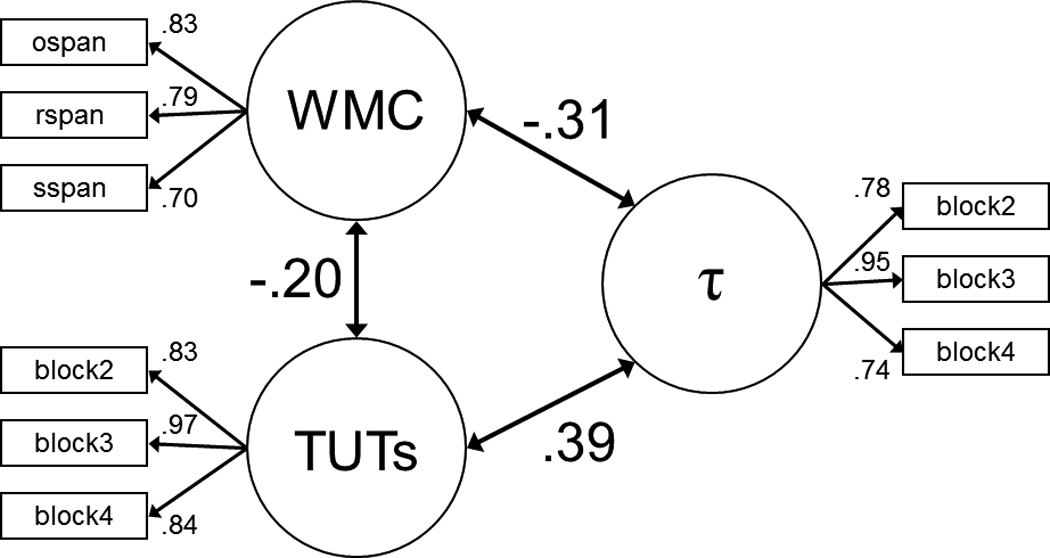
Latent variable analyses testing the relations among working memory capacity, TUT rate (measured across SART blocks 2 – 4), and the RT parameter τ (measured across SART blocks 2 – 4). Circles represent latent variables and square boxes represent observed variables. Panel A: Confirmatory factor analysis; double-headed arrows connecting latent variables (circles) to each other represent the correlations between the constructs, and numbers appearing next to each single-headed arrow represent the loadings for each manifest variable (box) onto the latent variable. Panel B: Structural equation model with TUT rate as a partial mediator of the WMC-τ association; single-headed arrows connecting latent variables with each other are analogous to semipartial correlations between these constructs. All depicted path coefficients are statistically significant. Note: WMC = working memory capacity; TUTs = task-unrelated thought rate.
Regression analyses and a structural equation model indicated that WMC and TUT rate accounted for both shared and unique variance in the RT indices. Table 7 presents the coefficients for a hierarchical-regression analysis predicting the slowest RT quintile, the fastest quintile, and the τ parameter with WMC and TUT rate. WMC explained significant variance in the slowest RT quintile (R2 = .06), here with one-third of that variance shared with TUT rate. WMC accounted for significant variance in the fastest RT quintile as well (R2 = .04), here with almost half of that variance shared with TUT rate. Finally, the significant but modest relation between WMC and τ (R2 = .03) was substantially mediated by TUT rate, with over half of the WMC-related variance explained by mind-wandering; TUT rate additionally predicted considerable variance independently of WMC (total R2 = .11).
Table 7.
Summary of Hierarchical Regression Analyses, Predicting the τ Parameter and Slowest RT Quintile in the Standard SART. N = 386.
| Criterion and Predictor Variables | B | SE | Beta | t | R2 |
|---|---|---|---|---|---|
| τ parameter | |||||
| Predictors: WMC, TUT | |||||
| Step 1: WMC | −14.091 | 4.056 | −.175 | −3.474* | .031 |
| Step 2: WMC, TUT | 92.958 | 16.061 | .286 | 5.788* | .109 |
| Predictors: TUT, WMC | |||||
| Step 1: TUT | 100.699 | 15.817 | .310 | 6.366* | .096 |
| Step 2: TUT, WMC | −9.394 | 3.977 | −.117 | −2.362* | .109 |
| Slowest RT Quintile | |||||
| Predictors: WMC, TUT | |||||
| Step 1: WMC | −41.630 | 8.558 | −.242 | −4.864* | .058 |
| Step 2: WMC, TUT | 139.554 | 34.619 | .201 | 4.031* | .097 |
| Predictors: TUT, WMC | |||||
| Step 1: TUT | 168.050 | 34.563 | .242 | 4.862* | .058 |
| Step 2: TUT, WMC | −34.579 | 8.572 | −.201 | −4.034* | .097 |
| Fastest RT Quintile | |||||
| Predictors: WMC, TUT | |||||
| Step 1: WMC | 18.963 | 4.964 | .192 | 3.820* | .037 |
| Step 2: WMC, TUT | −93.907 | 19.930 | −.236 | −4.712* | .090 |
| Predictors: TUT, WMC | |||||
| Step 1: TUT | −105.624 | 19.697 | −.265 | −5.362* | .070 |
| Step 2: TUT, WMC | 14.218 | 4.935 | .144 | 2.881* | .090 |
p < .05
Note: SART = Sustained Attention to Response Task; WMC = working memory capacity; TUT = proportion self-reported task-unrelated thoughts.
As a conceptual replication of our regression analyses, here using latent-variable methods, Figure 5B presents a structural equation model that tested not only for the independent, direct effects of WMC and TUT rate on τ, but also for the indirect, mediated effect of WMC on τ, through TUT rate. This partial-mediation model had identical fit statistics to our previous confirmatory factor analysis (from Figure 5A), here with WMC and TUT rate together accounting for 21% of the variance in τ. Of central importance, the WMC × TUT indirect effect was −.07, p < .01, indicating that some of WMC’s prediction of τ was mediated by TUT rate (note that the full mediation model, in which WMC had no direct effect on τ, did not fit the data as well as the partial mediation model, as indicated by a significant χ2 test, χ2difference(1) = 16.35).
In summary, and consistent with the worst performance rule, subjects’ WMC scores were negatively related to their longest RTs, calculated using both RT quintiles and individualized ex-Gaussian RT distributions. Mind wandering was positively related to long RTs, suggesting that these RTs might reflect, in part, lapses of attention experienced as off-task thoughts. Furthermore, TUT rate partially mediated the relationship between WMC and subjects’ longest RTs. This analysis counters the claim of Schmiedek et al. (2007) that lapses of attention to the ongoing task do not contribute to the τ parameter estimates from individuals’ ex-Gaussian distributions. By actually measuring TUT experiences, we find a contribution of attentional lapses to the association between WMC and τ.
Lapses of Attention and Decision-Diffusion Modeling of RT
Of course, the Schmiedek et al. (2007) approach to the question of WMC’s association with long RTs had many methodological strengths, not the least of which was using a rigorous, quantitative model of RTs, the EZDiffusion model (Wagenmakers et al., 2007), which allowed them to test an attention-allapse theory of the worst performance rule without relying on subjective reports. As we argued above, however, their use of a reduced diffusion model – which had no parameter to reflect attentional lapses – weakened their argument from parsimony (i.e., from a null effect). Here, then, we use a more complete evidence-accumulation model, which includes a parameter for within-subject drift rate variability, to more directly test whether WMC predicts RT variability in part because it predicts lapses and TUTs.
Recent advances have simplified the execution of quantitative RT modeling (e.g., Vandekerckhove & Tuerlinkcx, 2007; Vandekerckhove, Tuerlinkcx, & Lee, 2009; Voss & Voss, 2007; Wagenmakers et al., 2007). Here, we took advantage of a Microsoft Excel application (Donkin, Averell, Brown, & Heathcote, 2009), to implement the Linear Ballistic Accumulator model (LBA; Brown & Heathcote, 2008). The LBA mathematically simplifies the drift process by eliminating within-trial stochasticity from the Ratcliff model (evidence accumulation is thus “ballistic”). Moreover, in contrast to the EZDiffusion model used by Schmiedek et al. (2007), the LBA takes as input the full distribution of subjects’ correct and incorrect RTs, it yields a similar complement of parameters from choice-RT data to the Ratcliff model (including drift rate and drift-rate variability), it successfully accounts for a similar breadth of choice-RT-task phenomena as the Ratcliff’s model (Brown & Heathcote, 2009), and it yields similar parameter values to those from Ratcliff’s model when they are both applied to the same data (Donkin, Brown, Heathcote, & Wagenmakers, 2011).
Quantitative evidence-accumulation models are typically applied to tasks requiring choice between two overt responses, such as word versus non-word in lexical decision, rather than to go/no-go tasks (like the SART) with only one overt response. Recent work, however, suggests that two-choice and go/no-go versions of the same task (whether lexical decision, numerosity discrimination, or recognition memory) can best be modeled by assuming an implicit decision boundary for no-go “responses” and by fixing drift rate and drift-rate variability to be equal across both two-choice and go/no-go task types, while allowing response bias, response criterion, and nondecision parameters to vary between task types (Gomez, Ratcliff, & Perea, 2007). Because two-choice and go/no-go tasks appear to engage identical evidence-accumulation processes, we felt justified in applying a quantitative evidence-accumulation model to our SART data, especially given that our central predictions hinged on the drift and drift-variability parameters.
Methods
Subjects and SART Versions
We used the same dataset here as we did for the RT quantile and ex-Gaussian analyses above.
Analyses
For each subject, we fit all correct and error RTs for SART blocks 2 – 4 (screened as they had been for the RT quantile and ex-Gaussian analyses) using the Donkin et al. (2009) Excel program. Our final dataset included 374 subjects, each of whom had at least 750 RTs to model, and whose RTs could be reliably fit by Excel’s Solver function (for some subjects, the function would settle on a local maximum rather than a global, optimal maximum; here, seeding the model with different starting parameter values yielded vastly different resulting parameter estimates, indicating invalid solutions). The LBA analyses produced estimates of the following parameters for each subject: drift rate (v1, in the Donkin et al. LBA Excel program; corresponding to the diffusion model’s υ), drift-rate variability (s; corresponding to the diffusion model’s ηand nondecision processes (t0; corresponding to Ter); we estimated response criterion, or cautiousness (in the diffusion model, a), by combining the a and b parameters from the LBA EXCEL program (b – [a/2]; see Donkin et al., 2011).
Results and Discussion
Mean values for the LBA parameters in this sample were .847 (SD = .210) for drift rate, .204 (SD = .118) for drift-rate variability, 76.33 (SD = 77.47) for nondecision time, and 302.03 (SD = 154.82) for response criterion. As is sometimes the case (e.g., Ratcliff & Tuerlinckx, 2002; but see Ratcliff, Thapar, & McKoon, 2010), correlations among these parameters were statistically significant, ranging from r = .114 (drift rate × nondecision time) to r = .635 (drift rate × response criterion); drift rate correlated with drift variability at r = .411, indicating substantial shared variance (including some likely statistical dependency from the data-fitting process), but not redundancy. Table 8 presents the correlations between these LBA parameters and our other variables of primary interest: WMC, TUT rate, and SART τ. Of importance, and consistent with the notion that no behavioral measure is a process-pure reflection of any one underlying mechanism, both performance and thought measures from the SART (TUTs and τ), correlated with multiple LBA parameters: τ with drift variability, nondecision time, and response criterion, and TUT rate with drift variability, nondecision time, and drift rate. However, as predicted, TUTs were most strongly correlated with drift-rate variability (higher TUT rate = greater drift-rate variability). WMC also correlated more strongly (in a negative direction) with drift-rate variability than with any other LBA parameter, and only its correlation with drift variability was statistically significant.
Table 8.
Correlations of WMC, TUT rate, and ex-Gaussian τ estimate with cognitive-process parameters derived from the linear ballistic accumulator (LBA) decision-diffusion model (N = 374).
| LBA Parameter | WMC | TUT | τ |
|---|---|---|---|
| Drift Rate | .016 | .116* | .089 |
| Drift Variability | −.132* | .279** | .460** |
| Nondecision time | −.093 | .158** | .250** |
| Response criterion | .054 | −.055 | −.121* |
p < .01
p < .05
Note: SART = Sustained Attention to Response Task; WMC = working memory capacity; TUT = proportion of task-unrelated thought during the SART; τ= mean and standard deviation of the exponential component of the ex-Gaussian distribution from the SART.
Hierarchical regression analyses, presented in Table 9, tested whether drift rate or drift rate variability would partially mediate the associations between WMC and TUT rate, and between WMC and τ. We had predicted that drift rate variability would be at least as strong a mediator as would drift rate and, indeed, given the near-zero correlation between WMC and drift rate (r = .016) it was unlikely that drift rate would be a stronger mediator than would drift variability. As shown in Table 9, regarding TUT rate, the 3.6% of TUT variance predicted by WMC was essentially independent of drift rate, but nearly 40% of it was shared with drift rate variability. Likewise, for τ, the 2.5% of τ variance predicted by WMC was independent of drift rate, but approximately 60% of it was shared with drift rate variability. In short, WMC predicts TUTs and τ in large part via its shared variance with drift rate variability.
Table 9.
Summary of Hierarchical Regression Analyses, Predicting TUT rates and the ex-Gaussian τ Parameter in the Standard SART. N = 374.
| Criterion and Predictor Variables | B | SE | Beta | t | R2 |
|---|---|---|---|---|---|
| TUT rate | |||||
| Predictors: WMC, Drift Rate | |||||
| Step 1: WMC | −.047 | .013 | −.189 | −3.695* | .036 |
| Step 2: WMC, Drift Rate | .128 | .055 | .119 | 2.339* | .050 |
| Predictors: Drift Rate, WMC | |||||
| Step 1: Drift Rate | .125 | .056 | .116 | 2.241* | .013 |
| Step 2: Drift Rate, WMC | −.047 | .013 | −.191 | −3.754* | .050 |
| Predictors: WMC, Drift Variability | |||||
| Step 1: WMC | −.047 | .013 | −.189 | −3.695* | .036 |
| Step 2: WMC, Drift Variability | .498 | .096 | .258 | 5.187* | .101 |
| Predictors: Drift Variability, WMC | |||||
| Step 1: Drift Variability | .538 | .096 | .279 | 5.583* | .078 |
| Step 2: Drift Variability, WMC | −.038 | .012 | −.154 | −3.102* | .101 |
| τ Parameter | |||||
| Predictors: WMC, Drift Rate | |||||
| Step 1: WMC | −12.123 | 3.903 | −.159 | −3.106* | .025 |
| Step 2: WMC, Drift Rate | 31.144 | 16.972 | .094 | 1.835 | .034 |
| Predictors: Drift Rate, WMC | |||||
| Step 1: Drift Rate | 30.299 | 17.172 | .091 | 1.764 | .008 |
| Step 2: Drift Rate, WMC | −12.236 | 3.891 | −.161 | −3.145* | .034 |
| Predictors: WMC, Drift Variability | |||||
| Step 1: WMC | −12.123 | 3.903 | −.159 | −3.106* | .025 |
| Step 2: WMC, Drift Variability | 265.081 | 27.565 | .446 | 9.617* | .221 |
| Predictors: Drift Variability, WMC | |||||
| Step 1: Drift Variability | 272.982 | 27.458 | .459 | 9.942* | .211 |
| Step 2: Drift Variability, WMC | −7.634 | 3.526 | −.100 | −2.165* | .221 |
p < .05
Note: SART = Sustained Attention to Response Task; WMC = working memory capacity; TUT = proportion self-reported task-unrelated thought
As a further test of whether attentional lapses might contribute to the correlation between WMC and τ, we again supplemented our regression analyses with a latent variable analysis. Figure 6 presents a structural equation model that tested for mediation of the WMC-τ association by two variables that reflect, to some degree, attentional lapses: subjects’ overall TUT rate (based on subjective self-report) and their drift-rate variability parameter estimate (based on the quantitative LBA model); the model provided a just-adequate fit to the data [χ2(16) = 51.78, χ2/df = 3.24, CFI = .97, RMSEA = .076, SRMR = .028] . The WMC factor was modeled as the variance common to the three complex span tasks, and τ factor was modeled as the variance common to τ estimates from SART blocks 2 – 4. We did not model an “attentional lapse” factor based on the shared variance between TUT rate and drift variability because, even though they correlated significantly, it is inadvisable to model latent factors with fewer than three observed measures (Kline, 2005; moreover, drift variability, but not TUT rate, was derived from the same RT data as the τ dependent variable). Our model did allow TUT rate and drift variability to correlate, however. As indicated in Figure 6, TUT rate and drift-rate variability both acted as partial mediators of the WMC-τ association, with the full complement of predictor variables accounting for 58% of the variance in τ. Specifically, the WMC × TUT rate indirect path was −.04, p < .01, and the WMC × drift variability indirect path was −.10, p < .01. Some of WMC’s prediction of τ, then, resulted from its influence on the experience of attentional lapses. Note, though, that this mediation was only partial, as the model in Figure 6 fit the data significantly better than one that eliminated the direct path from WMC to τ, χ2difference(1) = 18.71.
Figure 6.
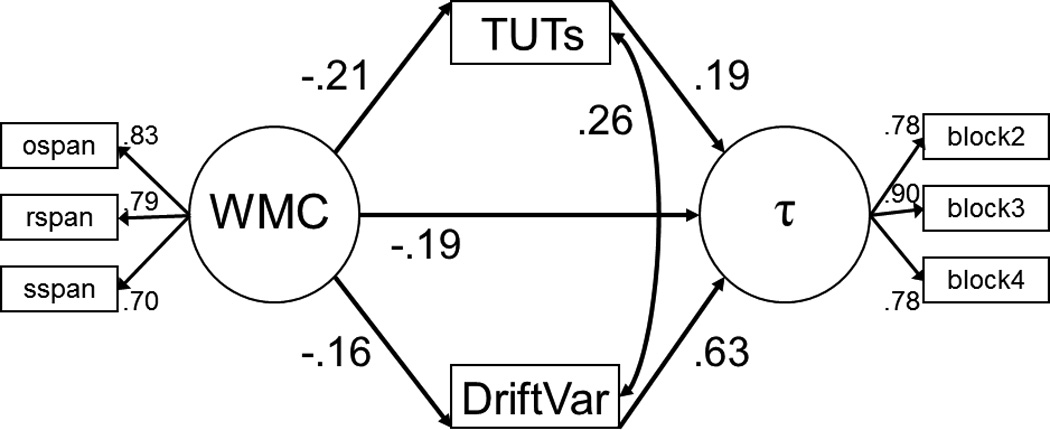
Structural equation model testing for mediation of the WMC-tau association by two indices of attentional lapses: TUT rate and DriftVar. Circles represent latent variables and square boxes represent observed variables. All depicted path coefficients are statistically significant. Note: WMC = working memory capacity; TUTs = task-unrelated thought rate; DriftVar = drift rate variability parameter from the linear ballistic accumulator (LBA) model; Block 2 – Block 4 = SART block 2 – block 4.
In summary, our primary conclusions from quantitative RT modeling (using the Brown-Heathcote LBA model) of a long-duration go/no-go task is that individual differences in τ are correlated more strongly with drift-rate variability than with drift rate (or with other LBA parameters). That is, as predicted from an attentional-lapse framework, the extent to which subjects show more skewing of their RT distribution (indicative of occasional, especially slow responses) seems to be driven to some significant degree by the extent to which subjects also show increased trial-to-trial variability in the rate at which they accumulate response-relevant information from imperative stimuli. We suggest, along with Schmiedek et al. (2007), that one potential source of drift-rate variability is the experience of occasional attentional lapses. Of course, such lapses may not be the only source of intra-subject variation in drift rate, but their contribution is supported by our TUT findings, as well. That is, TUT rate correlated more strongly with drift-rate variability than with any other LBA parameter (including drift rate), indicating that people who had the most variable drift rates also experienced the most mind-wandering episodes during the SART. Moreover, the modest association between WMC and τ was substantially – and similarly – mediated by both drift-rate variability and TUT rate. In contrast to Schmiedek et al. (2007), then, we find evidence that attentional lapses make some contribution to τ, to the worst-performance rule, and to WMC-related variation in worst performance.
Principal Components Analyses of RT Series
Using the combined Standard SART data from the current experiment and McVay and Kane (2009), we conducted a principal components analysis (PCA) to identify intra-individual patterns of RT change. Our goal, like that of Smallwood, McSpadden, Luus et al. (2008), was to seek RT patterns that signaled, in advance, the imminent commission of no-go errors, the experience of TUTs, or both. Recall that Smallwood, McSpadden, Luus et al. found that RT patterns identified through this PCA method predicted both SART errors and TUTs: a change from slow to quick responding in the trials leading up to a target or probe predicted errors, a change from quick to slow responding predicted on-task thoughts, and generally fast responding across the entire series predicted TUTs occurring without awareness. Here we attempted to replicate their findings while improving upon their methods. Specifically, we standardized RTs within subjects (with a z-score transformation), used 20 trials prior to targets and probes, and compared errors to correct target trials and TUTs to on-task thoughts, rather than to potentially contaminated baselines (as in Smallwood, McSpadden, Luus et al.). We also used hierarchical linear modeling (HLM; Raudenbush & Bryk, 2002) to evaluate differences in the RT patterns leading up to error or TUT trials. The data have a hierarchical structure in which runs of nontarget trials (Level-1 data) are nested within subjects (Level-2 data) and are therefore best evaluated with a multilevel approach such as HLM.
Methods
Smallwood, McSpadden, Luus et al. (2008) conducted PCA on their SART RT data from runs of 12 trials that preceded each target stimulus or thought probe. Our PCA analyses assessed the 20 non-target trials preceding every target trial, using the combined dataset from McVay and Kane (2009; N = 244) and the present Standard SART sample (N = 142). The PCA treated each set of 20 trials leading up to a target trial as one data series, so the Ns we report below represent the number of series, not subjects. Prior to analysis, we excluded non-target error trials and we standardized RTs for each subject (against that subject’s M RT for the experiment, thus expressing each RT as a z-score) to eliminate between-subject RT differences that might mask or distort within-subject RT changes, as they may have in the Smallwood, McSpadden, Luus et al. data (where RTs were not standardized). Targets were randomly presented in the SART and so many targets had fewer than 20 trials between their appearances; these were not included. PCA analyzes only series without missing values, resulting here in 3733 series of 20 trials before the appearance of a target.
Results and Discussion
Our first PCA (without rotation) yielded 4 components with eigenvalues greater than 1, accounting for 65.1% of the total variance; inspection of the scree plot, however, suggested that 3 components might be more appropriate and also consistent with the PCA solution from Smallwood, McSpadden, Luus et al. (2008). We therefore re-conducted the analysis to yield three unrotated components, which together accounted for 59.8% of the variance, and which are presented in Table 8 (where “n-back” refers to distance from the target trial, from “20-back” to “1-back”, with “1-back” representing the non-target trial immediately preceding the target).
Component 1 represents a general RT component, characterized by uniformly positive loadings across all n-back trials, and thus indicating that different runs of 20 trials deviated, as a whole, from a subject’s average RT (with some runs generally faster than average and others generally slower than average). Component 2 is characterized by inverse loadings for the beginning and end of the series (i.e., strong positive loadings among trials further back in the series and strong negative loadings among trials closer to the target), reflecting trial runs that were characterized by linear change (a speed-up or slow-down) preceding the target event. Component 3 reflects series with a quadratic pattern of RTs across n-back trials (i.e., RTs getting relatively long and then short as the target approached, or vice versa).
The PCA yielded a score on each of the three components for each of the 3733 RT series. This component score represented the extent to which each RT series matched the pattern expressed by the loadings presented in Table 8. For component 1, RT series with positive scores were slower than the subject’s average and series with negative scores were faster than average. For component 2, positive scores reflected a speed-up as the target approached, and negative scores reflected a slow-down; scores of larger absolute magnitude indicated a steeper slope. For component 3, RT series with positive scores started off slower, got faster, and then got slower as the target approached, and series with negative scores started off faster, got slower, and then got faster; again, larger absolute-magnitude scores represented steeper changes over pre-target trials.
We then used HLM to examine the PCA component scores as predictors of TUTs and target accuracy. Both TUTs and target accuracy were dichotomous variables (on-task vs. TUT; error vs. correct), so we used a Bernoulli distribution to evaluate the effects. We first tested whether any of these RT patterns predicted no-go errors. Figure 7 shows that the mean scores for all three components differed as a function of whether the RT series resulted in a commission error or an accurate no-go response to the target. The mean score of component 1 was significantly higher for accurate trials than for error trials, b = .786, SE =.045, t(3729) =17.453, p < .001, suggesting that subjects’ relatively slower series were followed by better performance and their faster series were followed by poorer performance. The mean score for component 2 was significantly higher for error trials than for accurate target trials, b =−.393, SE =.040, t(3729)= −9.780, p < .001: When subjects sped up more across trials before a target, they were more likely to make a commission error, whereas if they slowed down, they were more likely to correctly withhold their response. Errors trials also had significantly lower scores on component 3 than did accurate trials, b = .254, SE =.040, t(3729) = 6.326, p < .001, indicating that when subjects reacted faster at the beginning and end of the series, as opposed to the middle, they were more likely to commit an error on the subsequent target (again indicative that a speed-up just before a target predicted a commission error).
Figure 7.
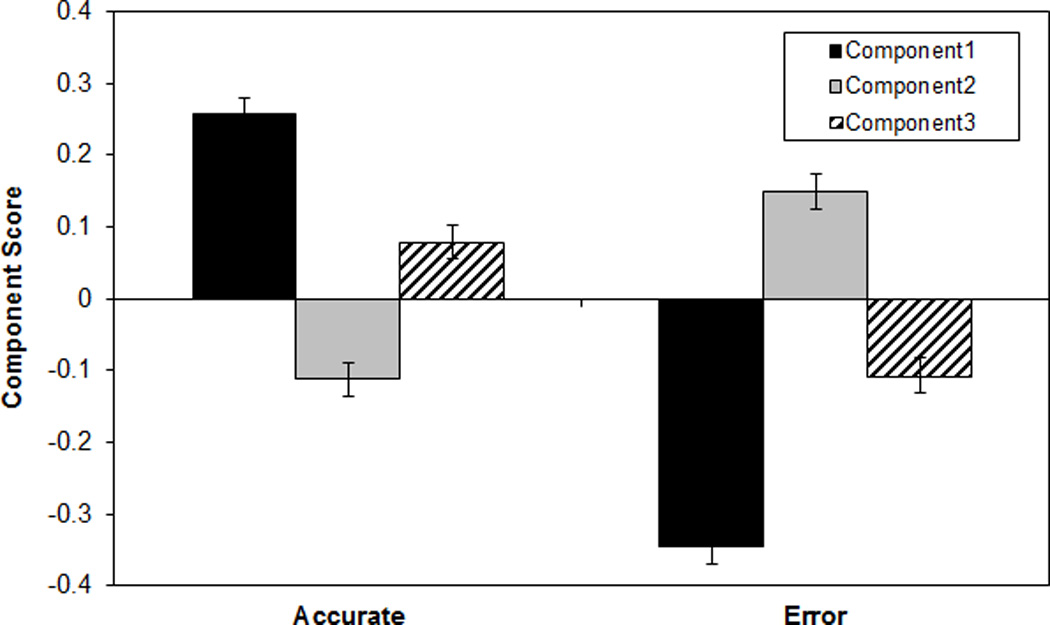
Component scores, by target accuracy, calculated using three-component principal-components analysis on accurate non-target reaction time (RT) sequences in the Standard SART (Nseries = 3427). Error bars represent standard errors.
We next tested whether any of the RT patterns predicted thought content. Analyses of thought type were based on fewer series (N = 2927) because not all target trials were followed by thought probes. Here, only the general RT component predicted TUTs (see Figure 8). The mean score for component 1 was significantly higher for reports of on-task thinking than for TUTs, b =.161, SE =.060, t(2723) =−4.26, p < .001, indicating that series with generally longer RTs than a subject’s average predicted on-task thoughts. Neither component 2 scores, b = −.187, SE =.040, t(2723) =1.303, p = .193, nor component 3 scores, b = .007, SE =.038, t(2723) < 1, p = .853, predicted TUTs.
Figure 8.
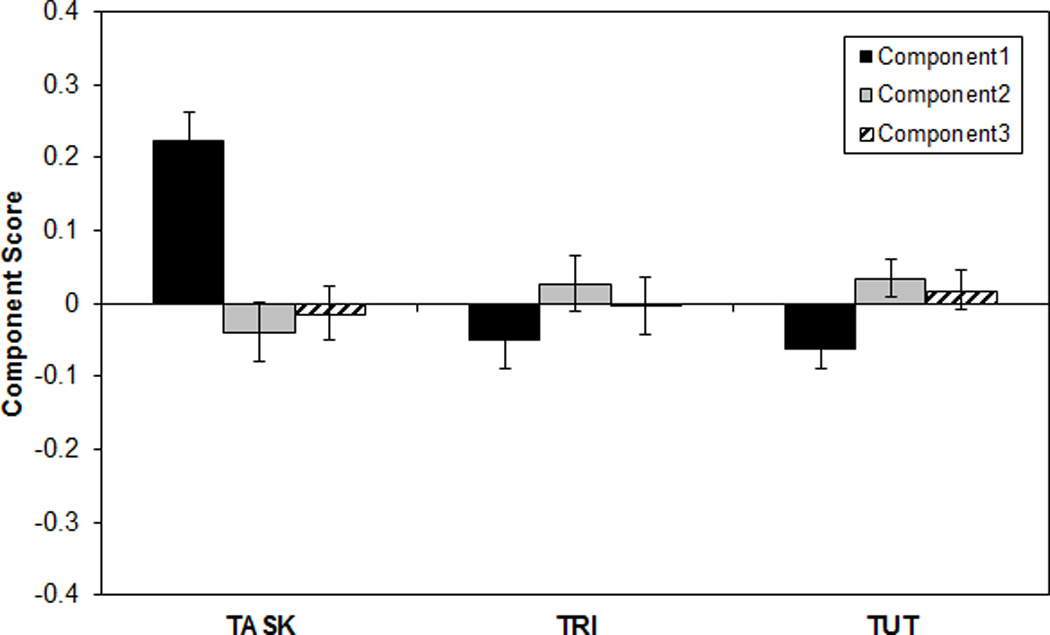
Component scores, by thought report, calculated using three-component principal-components analysis on accurate non-target reaction time (RT) sequences in the Standard SART (Nseries = 2693). Error bars represent standard errors. Note: Task = on-task thought; TRI = task-related interference; TUT = task-unrelated thought.
In summary, and consistent with Smallwood, McSpadden, Luus et al. (2008), the three RT patterns revealed by our PCA (general relative speed, linear RT change, quadratic RT change) predicted SART errors: Subjects were more likely to make an error on a target trial following generally faster-than-average non-target RT series, as well as following non-target RT series that increased in speed just prior to the target event (either as a linear change or as the end of a quadratic change with slower RTs during the middle of the series). Only one of the three time-series patterns, however, predicted TUTs. Subjects were more likely to report an on-task thought, as opposed to a TUT, following a series of consistently slower-than-average RTs. In contrast to the findings from Smallwood, McSpadden, Luus et al. (2008), changes in non-target RTs preceding a target trial (whether linear or quadratic) did not reliably predict off-task thinking. We cannot be certain why we did not replicate their finding that decreasing pre-target RTs precede TUTs, but it may be because half of their trials came from a SART with a much slower rate of stimulus presentation than that used here (2500 ms vs. 1250 ms). Perhaps with very slow stimulus trains, RT variation is more reflective of thought content whereas with faster trains, RT variation is more indicative of speed-accuracy tradeoff, or yet some other mechanisms.
General Discussion
The three analytic sections of this article assessed: 1) WMC-related differences in the performance of a standard (go/no-go) versus a vigilance (no-go/go) version of the SART, and the contributions of TUT experiences to each; 2) the role, if any, of attentional lapses in producing the worst performance rule and the association between WMC and subjects’ longest RTs, and; 3) the potential for within-subject RT patterns to objectively mark or predict TUT experiences on-line. In the original experiment presented here, we replicated the McVay and Kane (2009) finding that individual differences in WMC predict both TUT rates and performance (accuracy and RT variation) in the standard SART. However, WMC differences did not emerge in either performance or thought content from the vigilance SART. We then demonstrated (with the present data combined with those from McVay & Kane, 2009) that both TUT rate and the drift-variability parameter (from quantitative evidence-accumulation choice-RT modeling) accounted for significant variance in the τ parameter of individual RT distributions from the standard SART. Moreover, these subjective (TUT rate) and objective (drift variability) indices of attentional lapses partially mediated the association between WMC and τ. Finally, with our combined dataset, we partially replicated the Smallwood, McSpadden, Luus et al. (2008) findings that some within-subject RT patterns predict some measures of interest from the standard SART: Slower than average RT series predicted accurate responses and on-task thought reports, but dynamic RT changes preceding targets predicted only accuracy and not thought content.
Mind Wandering and Theoretical Accounts of WMC
A primary goal of this study was to leverage the probed thought report as a tool to assess attentional lapses as TUT experiences and, thereby, to evaluate theories of WMC variation, in particular the executive attention theory (e.g., Engle & Kane, 2004; Kane, Conway et al., 2007; Unsworth & Spillers, 2010) and coordinative binding theory (e.g., Oberauer et al., 2007; Wilhelm & Oberauer, 2006). Whereas executive-attention theory argues for the importance of attention-driven goal maintenance (and, as its failure, goal neglect) to WMC variation and its predictive power, coordinative binding theory suggests that such attention-control processes are only weakly or spuriously associated with WMC and that WMC’s covariation with other constructs reflects a (non-executive) capacity to simultaneously bind multiple independent mental representations, such as S-R associations. Our finding that variation in TUT rate contributed to the WMC × standard SART correlation replicated McVay and Kane (2009) and supported (along with our drift-variability findings) the executive-attention theory by demonstrating a contribution of attentional lapses to WMC’s prediction of task performance. At the same time, this finding seems inconsistent with the variety of theories denying a role for attention control in WMC variation or covariation with other constructs (e.g., Colom et al., 2008; Mogle et al., 2008; Oberauer et al., 2007).
Standard Versus Vigilance SART
We designed the present study to go further, however, in explaining WMC’s association to the standard SART – and, by extension, WMC’s relation to other tasks requiring restraint of habitual responses in favor of novel ones (e.g., Long & Prat, 2002; Unsworth et al., 2004). Both here and in McVay and Kane (2009), failures of goal maintenance could not completely explain the WMC-performance correlations because WMC was only modestly associated with TUT rate and, furthermore, TUT rate only partially mediated WMC’s effects. That is, WMC consistently predicted significant variance in SART accuracy and RT variation independently of mind-wandering rate. McVay and Kane explained these findings by appealing to dual-process conceptions of executive control (e.g., Braver et al., 2007; Engle & Kane, 2004). According to such views, control may be accomplished proactively, in advance of interference or conflict, via goal-maintenance mechanisms that are vulnerable to disruption by external or internal distractors. Or, it may be accomplished reactively, in the face of experienced interference of conflict, via competition-resolution mechanisms that take real time to overcome the inertia of long- or short-term habit. Both of these mechanisms seem to vary with WMC (e.g., Kane & Engle, 2003), but if TUTs primarily reflect (or cause) goal-maintenance failures, then WMC’s TUT-independent prediction of performance may represent the contributions of competition-resolution processes. Our vigilance SART tested this idea by requiring subjects to not respond to most trials, thus removing the “go” prepotency – and the importance of competition resolution – from the task. With goal maintenance being the primary control process left to affect performance, we predicted TUT rate to more fully mediate WMC’s prediction of vigilance SART outcomes.
We were wrong. Instead, WMC predicted neither performance nor thought content in this task. Why? We cannot easily explain it via coordinative binding theory because the standard and vigilance SARTs don’t differ in their S-R binding rules. In both tasks, subjects must learn and maintain the identical, very simple, S-R rule (e.g., “if animal name, press key; if food name, don’t press”). Where the standard and vigilance SART differ is in the momentary implementation of that rule, with standard SART being considerably more difficult, we claim, due to the prepotency to respond that is built over trials and that must be actively controlled for critical no-go stimuli. With both tasks involving the same S-R mapping, then, the binding view must make some additional assumptions in order to explain WMC’s differential prediction of performance in each. For example, the no-go version of the rule might be somehow more difficult to bind (or learn) than is the go version, or the mapping is somehow is more difficult to maintain over the course of the no-go task than the go task. Our study cannot rule out these claims, and so if they are empirically testable, they are worth investigating further. Nevertheless, we emphasize that coordinative-binding theory has little to say about TUTs or attentional lapses, other than to claim that they may not be important to WMC variation (Schmiedek et al., 2007), and so it cannot help explain WMC’s differential relation to TUTs across the two different SARTs.
The executive-attention view may also explain the presence of a WMC effect in only standard SART but also, admittedly, in a post-hoc fashion. We speculate that instead of merely reducing the demand for the competition-resolution component of executive attention, the vigilance SART also eliminated subjects’ use of proactive executive control altogether. Subjects may have adopted a bottom-up attention strategy that allowed environmental events (i.e., target onsets) to trigger their reactions rather than allocating their attention proactively to maintain the task goal (Johnson et al. 2007), and so WMC no longer predicted off-task thinking or task accuracy. Braver et al. (2007) have pointed out significant disadvantages to proactive control that may encourage subjects to adopt a reactive stance during some tasks: Proactive control is resource-demanding (and metabolically costly; see also Gailliot et al., 2007) and it interferes with the automatization process. Based on these costs, Braver et al. argue, the cognitive system trades off between proactive and reactive control, and conflict cues must be quite strong and highly predictive in order to initiate costly proactive processes.
Indeed, null effects of WMC on attention-demanding tasks are not anomalous, and we have argued elsewhere that discovering such boundary conditions in the relation between WMC and “attention” is critical to inductively advancing our understanding of both WMC and executive control (Kane, Poole, Tuholski, & Engle, 2006; see also Barrouillet et al., 2008; Redick, Calvo, Gay, & Engle, 2011). Initially, individual-differences research seemed to suggest that WMC predicted performance in tasks generally thought to require controlled processing but not in those allowing automatic processing (e.g., Conway & Engle, 1994; Kane et al., 2001; Kane & Engle, 2000; Unsworth et al., 2004). Subsequent work demonstrated, however, that even quite difficult tasks requiring top-down control could be immune to WMC’s influence, such as many varieties of visual search, including feature-absence, feature-conjunction, and command search (see Kane et al., 2006; Poole & Kane, 2009; Sobel, Gerrie, Poole, & Kane, 2007). Obviously, the vigilance SART is not a visual search task, but it has in common with these tasks the need to identify targets amid presentations of non-targets without the need to withhold prepotent responses or block distractor processing. Perhaps the restraint of habitual action or the constraint of conscious focus is critical to a task’s eliciting WMC-related performance differences (Kane et al., 2006; but see Colflesh & Conway, 2007). Regarding thought content, at least one other study (a daily-life, experience-sampling study) has shown that lower WMC subjects mind-wander more than higher WMC subjects when they report trying hard to concentrate on their ongoing activity, but not when they report little effort to concentrate (Kane, Brown et al., 2007). It is possible, then, that particular task features, such as the need to actively prevent commission errors, induce higher WMC subjects into proactive control modes that serve to combat off-task thinking (see also Smallwood, 2010). In any case, it is clear that future work on WMC and mind wandering should systematically manipulate a variety of tasks’ executive demands in order to further clarify the boundaries of WMC- and TUT-related effects on cognition and cognitive individual differences.
WMC, Attentional Lapses, and the Worst Performance Rule
Schmiedek et al. (2007) and Unsworth et al. (2010) both demonstrated the worst performance rule by connecting individual differences in WMC to the τ parameter from subjects’ individualized RT distributions. They differed, however, in their interpretation of these results. Unsworth et al., like many investigators (e.g., Coyle, 2003; Larson & Alderton, 1990), attributed subjects’ longest RTs to lapses of attention to ongoing task demands and thus argued that their findings supported the executive attention theory of WMC. Schmiedek et al., in contrast, argued that τ and its covariation with WMC reflected general information-processing efficiency, rather than an influence of attentional lapses (consistent with coordinative binding theory); moreover, they backed their claim via formal modeling (á la Ratcliff et al., 2008; Wagenmakers et al., 2007) and a successful simulation study. We find no fault with the Schmiedek et al. methods or analyses, and their simulation results were compelling as far as they went. Our view, however, is that one can draw the strongest conclusions about attentional lapses by assessing them, rather than by inferring their unimportance via null modeling results (where the model includes no parameter that corresponds to lapses).
When we actually measured attentional lapses via probed thought reports and the drift-rate variability parameter from the LBA model, we found that TUT rate and drift variability significantly predicted normal variation in τ. Of most importance here, both TUT rate and drift variability also partially mediated the correlation between WMC and τ. That is, individual differences in the subjective experience of attentional lapses, and in the inter-trial variability in evidence accumulation left in the wake of those lapses, predicted long RTs in a continuous go/no-go task. Variation in attentional lapses was, moreover, partly responsible for WMC’s prediction of long RTs. We should make clear that neither result falsifies the Schmiedek et al (2007) claim that individual differences in τ are driven to some considerable extent by differences in general information-processing efficiency that might reflect S-R binding capability, at least in some task contexts (see also Ratcliff et al., 2008). Our results, however, directly support the claims of executive attention theory (e.g., Kane, Conway et al., 2007), that WMC’s predictive power derives – to some degree – from its tapping into variation in attention-control processes involved in the regulation of both thought and behavior.
We must note, however, that our modeling results differ from previously published reports on individual differences in RT tasks. In line with Schmiedek et al. (2007), this small but growing literature converges on the idea that drift rate is especially important to ability-related individual differences in choice-task performance. First, simulation studies (Ratcliff et al., 2008; van Ravenzwaaij, Brown, & Wagenmakers, 2011) link drift rate to the worst performance rule and to the association between intelligence and RT (and RT variability). Second, empirical work shows that IQ (as assessed by psychometric tests of matrix reasoning and vocabulary) correlates significantly and strongly with drift rate, especially in younger adults (Ratcliff, Thapar, & McKoon, 2010, 2011), with weak to null correlations with response criterion and nondecision parameters. What might account for our discrepant findings? We consider two possibilities as most promising.
First, most of the previous studies have considered only drift rate, response criterion, and nondecision times to be the parameters of interest, and have not sought to model or test for any role for drift variability in producing ability-related individual differences (although drift variability is needed by the diffusion model to account for the RT distributions of errors relative to accurate responses, it and the other within-subject variability parameters are often not accorded psychological or process-based interpretations). Second, the SART seems to differ from most choice-RT tasks that have served as the basis for diffusion modeling in individual-differences studies. It is a highly repetitive task that offered subjects no breaks over the course of a 45 min session, and it encourages rapid and mindless responding that seems to elicit both very fast and very slow responses (and so highly variable responding). Given that evidence-accumulation modeling has been successfully employed with go/no-go tasks (Gomez et al., 2007), and that LBA modeling yields similar parameter estimates to diffusion modeling when they are applied to the same data (Donkin et al., 2011), we do not believe that our findings are idiosyncratic to our modeling methods. Future work will be necessary, however, to further examine the contributions of drift-rate variability to ability-related individual differences across different varieties of tasks and subject groups.
WMC and Theoretical Accounts of Mind-Wandering
A current debate in mind wandering research concerns the role of executive processes, or resources. The Smallwood and Schooler (2006) view, along with numerous empirical reports (e.g., Ellis, Moore, Varner, Ottaway, & Becker, 1997; Forster & Lavie, 2009; Giambra, 1989; McKiernan et al., 2006; Teasdale et al., 1995) have argued that TUTs consume executive resources. McVay & Kane (2010) countered these claims with a “control failure × concerns” view, based largely on individual differences in the propensity to mind-wander and their connection to executive control. The control failures × concerns view posits that unwanted TUTs during ongoing tasks reflect a failure to control attention and maintain task goals in the face of interference from task-irrelevant, concern-related thoughts that are automatically cued by environmental or mental events. An important hypothesis derived from this perspective is that people with deficient control capabilities will more often succumb to TUTs than those with better control (as will those who have more versus less urgent personal concerns with which to contend). The resource-demanding view of mind wandering (e.g., Giambra, 1989; Smallwood & Schooler, 2006), in contrast, makes the opposite prediction. Namely, people with more executive resources at their disposal should mind wander more than those with fewer. That is, if mind wandering is resource-demanding, and if ongoing tasks and TUTs draw on the same resource pool, then people with greater resources should more effectively balance TUTs and on-task thinking (and thus, performance).
The current study provides evidence for the control failure × concerns view of mind wandering (McVay & Kane, 2010). First, WMC correlated negatively with TUT rate during an attention-demanding task (see also Kane, Brown, et al., 2007; McVay & Kane, 2009; in press). Second, if mind wandering were resource-demanding, then higher WMC subjects’ performance should be affected to a lesser degree than lower WMC subjects’, as higher WMC provides more resources to distribute between task performance and TUTs. A re-examination of data from McVay and Kane (2009; reported in McVay & Kane, 2010) found that, overall, subjects were less accurate when mind wandering but that the task performance of high and low WMC subjects were affected to the same degree by TUTs. The current study replicated this finding: Although subjects were more likely to make a Standard SART error when they reported a TUT, WMC did not interact significantly with thought report, signifying that high and low WMC subjects (defined as top and bottom quartile scorers) experienced the same performance decrement when mind wandering (Ms = .83 vs. .59 for high WMC and Ms = .74 vs. .57 for low WMC).6
Although our findings seem inconsistent with prototypical resource views of mind-wandering, Smallwood’s (2010) response to McVay and Kane (2010) provided an alternative conception of executive “resources” and their consumption during mind-wandering states. TUTs, here, occupy the global workspace of consciousness (e.g., Baars, 1988; Navon, 1989a, 1989b). According to workspace theories, modular processing networks that are specialized for particular functions can be brought under general executive control when goals or other representations are made globally available to the cognitive system via consciousness (i.e., reportable experiences). Smallwood’s logic, then, is that: (1) access to global broadcasting is capacity limited, and; (2) TUTs, as conscious experiences, occupy the workspace, ergo; (3) TUTs must consume an executive resource. Moreover, Smallwood argues that this workspace view correctly predicts the all-or-none pattern we find that experiencing a TUT in the moment should impair performance similarly regardless of a subject’s executive-control abilities.
On one hand, then, Smallwood’s argument jibes with our view that conscious access to goals is critical to the executive regulation of behavior and thought, and that automatically cued thoughts about personal concerns may commandeer consciousness and thus thwart attempts at proactive and reactive control. From this perspective, TUTs do appear to influence, if not engage, executive mechanisms. On the other hand, we still differ fundamentally from Smallwood (2010) in our claim that executive-control mechanisms are primarily important in preventing TUTs from gaining access to the global workspace in the first place; that is, TUTs can only monopolize the workspace-as-executive-mechanism if they are allowed by inefficient control processes to intrude into consciousness. Moreover, executive-control processes are heterogeneous and encompass much more than just the global workspace (e.g., Botvinick et al., 2001; Braver et al., 2007; Kane & Engle, 2003; Miller & Cohen, 2001; Miyake, Friedman, Emerson, Witzki, & Howerter, 2000), and so it would be unwise to characterize TUTs as consuming all or most of some undifferentiated executive “resource” (for more general concerns about the viability of resource views of attention, see Navon, 1984; Neumann, 1987).
Objective Markers, and Validity, of Subjective Mind-Wandering Reports
The search for a reliable, objective marker of mind wandering is ongoing. Unfortunately, the dynamic patterns of changing RTs originally identified by Smallwood, McSpadden, Luus et al. (2008) did not reliably predict the occurrence of TUTs in our large dataset that combined our new data with those from McVay & Kane (2009). Using long pre-target RT series, all standardized within subjects, we replicated their finding of three principal components. Of importance, all three of the identified RT patterns predicted target no-go errors (i.e., series that were generally faster than average and those that changed from relatively slow to relatively fast); we therefore replicated the Smallwood group’s interesting finding that impending errors can be predicted well in advance by RT changes. That same within-series change, from slow to fast, did not reliably predict TUTs, however. This difference in RTs’ predictions of impending errors versus thought reports further supports our general argument that errors are not always isomorphic with TUTs and that errors are determined only in part (or only some of the time) by lapses of thought. In short, theoretical inferences about thought content cannot reliably be made based on performance patterns alone (see also Helton et al., 2005, 2010). It seems that further research will be necessary to establish objective behavioral markers of mind wandering (but for other promising behavioral, psychophysiological, and neuroimaging findings, see Christoff et al., 2009; Reichle, Reineberg, & Schooler, in press; Smallwood, Beach et al., 2008; Smallwood et al., 2004; Smallwood, O’Connor et al., 2007). In the meantime, the thought probe remains a useful, if subjective, tool for testing the importance of thought content in theoretical discussions of WMC and executive control.
Indeed, probed reports of TUT experiences have a strong record of validity, as we already reviewed. The present study provides additional sources of validation, including evidence that TUT reports did not simply reflect subjects’ reactive, post hoc explanations for their own performance. For example, if subjects used target-trial performance to determine whether their mind had wandered (“Oops, I missed that one, I must have been mind-wandering”), then target accuracy should have predicted thought reports more strongly than it did. Although performance varied systematically with thought reports, subjects committed errors on 38% of trials preceding on-task thought reports (in the Standard SART; similar to the 34% reported in McVay & Kane, 2009), and responded accurately on 36% of trials preceding TUT reports (42% in McVay & Kane, 2009); clearly, subjects often reported thoughts at odds with their performance. Similarly, regarding individual differences, the significant but non-perfect correlation between TUT rate and dL indicates that most of the variance in thought reports was independent of SART accuracy. Furthermore, in both McVay and Kane (2009) and the current study, overall TUT rate correlated as strongly with intraindividual RT variation as with SART accuracy, but only the latter could be easily monitored and used to influence thought reports. Indeed, our quantitative diffusion-modeling results also refute the reactivity of TUT reports because the drift-variability parameter from the LBA model correlated with WMC and TUT reports, and it partially mediated the WMC-TUT and WMC-τ associations: Subjects obviously could not use their drift-variability parameter to inform their thought reports!
Finally, key differences between subjects’ reports of TUTs and TRI (i.e., evaluative thoughts about their performance) offer further evidence for thought-report validity. Although McVay and Kane (2009) did not report analyses of TRI, in re-examining those data here we note that Standard SART accuracy was similarly low for trials on which subjects reported TRI (M = .44) as TUTs (M = .42), suggesting that both varieties of off-task thought hurt performance (versus M = .66 for on-task trials). In the current study, the Standard SART patterns were similar (TRI M accuracy = .38; TUT M accuracy = .36; on-task accuracy M = .62). At the same time, the latency with which subjects indicated their thought content to probes was different for TUTs and TRI. Subjects more quickly categorized their thoughts as being on-task or about their task performance (Ms ± SEMs = 2309±57 ms vs. 2705±67 ms for on-task vs. TRI reports) than as being about task-unrelated topics (TUTs: 3268±80 ms). A re-analysis of the McVay and Kane (2009) data shows a similar pattern (Ms ± SEMs for on-task thoughts = 2213±60 ms, for TRI = 2261±48 ms, and for TUTs= 2665±59 ms). If subjects simply allowed their accuracy to influence their thought reports, they should have made both TUT and TRI responses (indicative of error) with similar ease and speed.
Conclusions
The measurement of mind wandering, or TUTs, within a task contributes significantly to our understanding of individual differences in WMC and attention control. The negative correlation between WMC and TUT rate supports the executive-attention theory of WMC, which claims that a primary factor underlying both tests of WMC and complex cognition (e.g., reading comprehension, scholastic achievement tests, and Gf tests) is executive control. Furthermore, our thought-report and evidence-accumulation modeling findings indicate that lapses of attention contribute to the worst performance rule, whereby subjects’ longest RTs (and the ex-Gaussian τ parameter) correlate most strongly with cognitive ability. More broadly, the apparent impact of off-task thoughts on particular varieties of task performance demands a closer look at the ways in which thought control and action control interact to produce goal-directed behavior (see e.g., the hypothesized addition of a “Supervisory Attention Gateway” to classic models of the Supervisory Attention System; Burgess, Dumontheil, & Gilbert, 2007; Gilbert, Frith, & Burgess, 2005; Gilbert, Simons, Frith, & Burgess, 2006).
Table 10.
Component loadings of RTs (standardized within subjects) for trials 20 to 1 back from a target trial. N (response-time series) = 3427.
| Component loadings | |||
|---|---|---|---|
| 1 | 2 | 3 | |
| 20BACK | 0.404 | 0.364 | 0.366 |
| 19BACK | 0.544 | 0.429 | 0.384 |
| 18BACK | 0.575 | 0.472 | 0.309 |
| 17BACK | 0.616 | 0.477 | 0.209 |
| 16BACK | 0.633 | 0.430 | 0.093 |
| 15BACK | 0.653 | 0.379 | −0.045 |
| 14BACK | 0.657 | 0.300 | −0.188 |
| 13BACK | 0.670 | 0.225 | −0.302 |
| 12BACK | 0.669 | 0.135 | −0.369 |
| 11BACK | 0.698 | 0.060 | −0.378 |
| 10BACK | 0.693 | −0.062 | −0.331 |
| 9BACK | 0.702 | −0.142 | −0.281 |
| 8BACK | 0.693 | −0.209 | −0.225 |
| 7BACK | 0.696 | −0.254 | −0.118 |
| 6BACK | 0.688 | −0.344 | −0.004 |
| 5BACK | 0.681 | −0.393 | 0.129 |
| 4BACK | 0.659 | −0.413 | 0.240 |
| 3BACK | 0.644 | −0.408 | 0.311 |
| 2BACK | 0.617 | −0.395 | 0.320 |
| 1BACK | 0.565 | −0.352 | 0.296 |
Acknowledgements
Portions of this work were supported by an NIH Ruth L. Kirschstein National Research Service Award (NRSA) Individual Pre-doctoral Fellowship granted to Jennifer McVay, Award Number F31MH081344 from the National Institute of Mental Health (NIMH). The content is solely the responsibility of the authors and does not necessarily represent the official views of NIMH.
We are also grateful to Cody Burns, DeLaura Jansen, Meaghan Kerns, Dara Rogers, Lindsay Squires, Alanna Stockford, Meaghan X, and Hanna Zombek for their assistance in data collection.
Footnotes
We have also proposed that control may be implemented reactively, by mechanisms specialized for resolving response conflict and distractor inhibition (Engle & Kane, 2004; Kane et al., 2007; Kane & Engle, 2003; see also Braver et al., 2007; Hasher, Lustig, & Zacks, 2007; Jacoby et al., 1999).
The diffusion model parameters of most consistent interest across studies are evidence accumulation/drift rate (υ), response criterion/boundary separation (a), nondecision components (Ter), drift starting point/response bias (z), across-trial variation in drift rate (η), across-trial variation in nondecision components (st), across-trial variation in starting point (sz), and, most recently, proportion of contaminant RTs (po; e.g., Ratcliff & Teurlinckx, 2002).
Even if binding theory (Oberauer et al., 2007; Wilhelm & Oberauer, 2006) were to claim that the standard SART challenges S-R binding capabilities more than does the vigilance SART (see our General Discussion for more on this issue), the vigilance-SART variance that is predicted by WMC should still have no association with TUT rate.
The 12 trials used for analysis in Smallwood, McSpadden et al. (2008) differed between their “slow” and “fast” pace conditions. All 12 discrete trials were used in the slow condition, whereas 12 “averaged” RTs were used in the fast; the fast condition presented 24 trials per block, so the authors averaged across consecutive trials to equate the number of trials between pace conditions.
McVay and Kane (2009) found that TRI comprised 24% of Standard SART thought-probe responses, but they did not analyze TRI reports further. Analyzing those data, here, yielded a similar decrease in TRI rate over blocks, a similar prediction of in-the-moment error versus on-task thought reports, and similar null correlations between individual differences in TRI rate and SART performance. The only discrepancy with the present findings was a significant WMC × TRI correlation (r = .19), such that higher WMC subjects report higher rates of TRI than did lower WMC subjects. Given the failure to replicate this positive correlation here, we do not consider it further.
It is also possible that higher and lower WMC subjects are equivalently hurt by TUTs because higher WMC subjects entertain more complex (i.e., more resource-demanding) thoughts during tasks than do lower WMC subjects (J. Smallwood, personal communication, October 2010). It would be very difficult to test such a claim, however, and we are skeptical that higher WMC subjects would engage in thought just complex enough to make their “dual-tasking” cost similar to lower WMC subjects’. It seems to us much more likely that engaging in off-task thought of any kind induces a cost to ongoing performance that is of similar magnitude for everyone (see also Smallwood, 2010).
References
- Alloway TP, Gathercole SE, Kirkwood H, Elliott J. The cognitive and behavioral characteristics of children with low working memory. Child Development. 2009;80:606–621. doi: 10.1111/j.1467-8624.2009.01282.x. [DOI] [PubMed] [Google Scholar]
- Antrobus JS, Coleman R, Singer JL. Signal-detection performance by subjects differing in predisposition to daydreaming. Journal of Consulting Psychology. 1967;31:487–491. doi: 10.1037/h0024969. [DOI] [PubMed] [Google Scholar]
- Antrobus JS, Singer JL, Greenberg S. Studies in the stream of consciousness: Experimental enhancement and suppression of spontaneous cognitive processes. Perceptual and Motor Skills. 1966;23:399–417. [Google Scholar]
- Barrouillet P, Lépine R, Camos V. Is the influence of working memory capacity on highlevel cognition mediated by complexity or resource-dependent elementary processes? Psychonomic Bulletin & Review. 2008;15:528–534. doi: 10.3758/pbr.15.3.528. [DOI] [PubMed] [Google Scholar]
- Beilock SL, Carr TH. On the fragility of skilled performance: What governs choking under pressure? Journal of Experimental Psychology: General. 2001;4:701–225. [PubMed] [Google Scholar]
- Botvinick MM, Braver TS, Barch DM, Carter CS, Cohen JC. Conflict monitoring and cognitive control. Psychological Review. 2001;108:624–652. doi: 10.1037/0033-295x.108.3.624. [DOI] [PubMed] [Google Scholar]
- Braver TS, Gray JR, Burgess GC. Explaining the many varieties of working memory variation: Dual mechanisms of cognitive control. In: Conway ARA, Jarrold C, Kane MJ, Miyake A, Towse JN, editors. Variation in working memory. New York: Oxford University Press; 2007. pp. 76–106. [Google Scholar]
- Brown S, Heathcote A. QMLE: Fast, robust, and efficient estimation of distribution functions based on quantiles. Behavior Research Methods, Instruments & Computers. 2003;35:485–492. doi: 10.3758/bf03195527. [DOI] [PubMed] [Google Scholar]
- Burgess PW, Dumontheil I, Gilbert SJ. The gateway hypothesis of rostral prefrontal cortex (area 10) function. Trends in Cognitive Sciences. 2007;11:290–298. doi: 10.1016/j.tics.2007.05.004. [DOI] [PubMed] [Google Scholar]
- Cheyne JA, Solman GJF, Carriere JSA, Smilek D. Anatomy of an error: A bidirectional state model of task engagement/disengagement and attention-related errors. Cognition. 2009;111:98–113. doi: 10.1016/j.cognition.2008.12.009. [DOI] [PubMed] [Google Scholar]
- Christoff K, Gordon AM, Smallwood J, Smith R, Schooler JW. Experience sampling during fMRI reveals default network and executive system contributions to mind wandering. Proceedings of the National Academy of Sciences. 2009;106:8719–8724. doi: 10.1073/pnas.0900234106. [DOI] [PMC free article] [PubMed] [Google Scholar]
- Cohen JD, Servan-Schreiber D. Context, cortex, and dopamine: A connectionist approach to behavior and biology in schizophrenia. Psychological Review. 1992;99:45–77. doi: 10.1037/0033-295x.99.1.45. [DOI] [PubMed] [Google Scholar]
- Colflesh JGH, Conway ARA. Individual differences in working memory capacity and divided attention in dichotic listening. Psychonomic Bulletin & Review. 2007;14:699–703. doi: 10.3758/bf03196824. [DOI] [PubMed] [Google Scholar]
- Colom R, Abad FJ, Quiroga MA, Shih PC, Flores-Mendoza C. Working memory and intelligence are highly related constructs, but why? Intelligence. 2008;36:584–606. [Google Scholar]
- Colzato LS, Spapé MMA, Pannebakker MM, Hommel B. Working memory and the attentional blink: Blink size is predicted by individual differences in operation span. Psychonomic Bulletin & Review. 2007;14:1051–1057. doi: 10.3758/bf03193090. [DOI] [PubMed] [Google Scholar]
- Conway ARA, Cowan N, Bunting MF. The cocktail party phenomenon revisited: The importance of working memory capacity. Psychonomic Bulletin and Review. 2001;8:331–335. doi: 10.3758/bf03196169. [DOI] [PubMed] [Google Scholar]
- Conway ARA, Engle RW. Working memory and retrieval: A resource-dependent inhibition model. Journal of Experimental Psychology: General. 1994;123:354–373. doi: 10.1037//0096-3445.123.4.354. [DOI] [PubMed] [Google Scholar]
- Conway ARA, Kane MJ, Bunting MF, Hambrick DZ, Wilhelm O, Engle RW. Working memory span tasks: A methodological review and user’s guide. Psychonomic Bulletin & Review. 2005;12:769–786. doi: 10.3758/bf03196772. [DOI] [PubMed] [Google Scholar]
- Coyle TR. A review of the worst performance rule: Evidence, theory, and alternative hypotheses. Intelligence. 2003;31:567–587. [Google Scholar]
- Daneman M, Merikle PM. Working memory and language comprehension: A meta-analysis. Psychonomic Bulletin & Review. 1996;3:422–433. doi: 10.3758/BF03214546. [DOI] [PubMed] [Google Scholar]
- Davies DR, Parasuraman R. The psychology of vigilance. New York: Academic Press; 1982. [Google Scholar]
- De Jong RD. Adult age differences in goal activation and goal maintenance. European Journal of Cognitive Psychology. 2001;13:71–89. [Google Scholar]
- De Jong RD, Berendsen E, Cools R. Goal neglect and inhibitory limitations: Dissociable causes of interference effects in conflict situations. Acta Psychologica. 1999;101:379–394. doi: 10.1016/s0001-6918(99)00012-8. [DOI] [PubMed] [Google Scholar]
- Donkin C, Averell L, Brown S, Heathcote A. Getting more from accuracy and response time data: Methods for fitting the linear ballistic accumulator. Behavior Research Methods. 2009;41:1095–1110. doi: 10.3758/BRM.41.4.1095. [DOI] [PubMed] [Google Scholar]
- Donkin C, Brown S, Heathcote A, Wagenmakers E-J. Diffusion versus linear ballistic accumulation: Different models but the same conclusions about psychological processes? Psychonomic Bulletin & Review. 2011;18:61–69. doi: 10.3758/s13423-010-0022-4. [DOI] [PMC free article] [PubMed] [Google Scholar]
- Duncan J. Attention, intelligence, and the frontal lobes. In: Gazzaniga M, editor. The cognitive neurosciences. Cambridge, MA: MIT Press; 1995. pp. 721–733. [Google Scholar]
- Ellis HC, Moore BA, Varner LJ, Ottaway SA, Becker AS. Depressed mood, task organization, cognitive interference, and memory: Irrelevant thoughts predict recall performance. Journal of Social Behavior and Personality. 1997;12:453–470. [Google Scholar]
- Engle RW, Kane MJ. Executive attention, working memory capacity, and a two-factor theory of cognitive control. In: Ross B, editor. The Psychology of Learning and Motivation. New York: Academic Press; 2004. pp. 145–199. [Google Scholar]
- Forster S, Lavie N. Harnessing the wandering mind: The role of perceptual load. Cognition. 2009;111:345–355. doi: 10.1016/j.cognition.2009.02.006. [DOI] [PMC free article] [PubMed] [Google Scholar]
- Fukuda K, Vogel EK. Human variation in overriding attentional capture. Journal of Neuroscience. 2009;29:8726–8733. doi: 10.1523/JNEUROSCI.2145-09.2009. [DOI] [PMC free article] [PubMed] [Google Scholar]
- Gailliot MT, Baumeister RF, DeWall CN, Maner JK, Plant EA, Tice DM, et al. Self-control relies on glucose as a limited energy source: Willpower is more than a metaphor. Journal of Personality and Social Psychology. 2007;92:325–336. doi: 10.1037/0022-3514.92.2.325. [DOI] [PubMed] [Google Scholar]
- Gathercole SE, Alloway TP, Kirkwood HJ, Elliott JG, Holmes J, Hilton KA. Attentional and executive function behaviours in children with poor working memory. Learning and Individual Differences. 2008;18:214–223. [Google Scholar]
- Giambra LM. Task-unrelated thought frequency as a function of age: A laboratory study. Psychology and Aging. 1989;4:136–143. doi: 10.1037/0882-7974.4.2.136. [DOI] [PubMed] [Google Scholar]
- Giambra LM. The influence of aging on spontaneous shifts of attention from external stimuli to the contents of consciousness. Experimental Gerontology. 1993;28:485–492. doi: 10.1016/0531-5565(93)90073-m. [DOI] [PubMed] [Google Scholar]
- Giambra LM. A laboratory method for investigating influences on switching attention to task-unrelated imagery and thought. Consciousness and Cognition. 1995;4:1–21. doi: 10.1006/ccog.1995.1001. [DOI] [PubMed] [Google Scholar]
- Gilbert SJ, Frith CD, Burgess PW. Involvement of rostral prefrontal cortex in selection between stimulus-oriented and stimulus-independent thought. European Journal of Neuroscience. 2005;21:1423–1431. doi: 10.1111/j.1460-9568.2005.03981.x. [DOI] [PubMed] [Google Scholar]
- Gilbert SJ, Simons JS, Frith CD, Burgess PW. Performance-Related Activity in Medial Rostral Prefrontal Cortex (Area 10) during Low-Demand Tasks. Journal of Experimental Psychology: Human Perception and Performance. 2006;32:45–58. doi: 10.1037/0096-1523.32.1.45. [DOI] [PubMed] [Google Scholar]
- Grodsky A, Giambra LM. The consistency across vigilance and reading tasks of individual differences in the occurrence of task-unrelated and task-related images and thoughts. Imagination, Cognition and Personality. 1990–91;10:39–52. [Google Scholar]
- Hasher L, Lustig C, Zacks RT. Inhibitory mechanisms and the control of attention. In: Conway ARA, Jarrold C, Kane MJ, Miyake A, Towse JN, editors. Variation in working memory. Oxford: Oxford University Press; 2007. pp. 227–249. [Google Scholar]
- Hasher L, Zacks RT. Working memory, comprehension, and aging: A review and a new view. In: Bower GH, editor. The Psychology of Learning and Motivation: Advances in Research and Theory. vol. 22. San Diego, CA: Academic Press; 1988. pp. 193–225. [Google Scholar]
- Heitz RP, Engle RW. Focusing the spotlight: Individual differences in visual attention control. Journal of Experimental Psychology: General. 2007;136:217–240. doi: 10.1037/0096-3445.136.2.217. [DOI] [PubMed] [Google Scholar]
- Helton WS, Hollander TD, Warm JS, Matthews G, Dember WN, Wallaart M, et al. Signal regularity and the mindlessness model of vigilance. British Journal of Psychology. 2005;96:249–261. doi: 10.1348/000712605X38369. [DOI] [PubMed] [Google Scholar]
- Helton WS, Weil L, Middlemiss A, Sawers A. Global interference and spatial uncertainty in the Sustained Attention to Response Task (SART) Consciousness and Cognition. 2010;19:77–85. doi: 10.1016/j.concog.2010.01.006. [DOI] [PubMed] [Google Scholar]
- Jacoby LL, Kelley CM, McElree BD. The role of cognitive control: Early selection versus late correction. In: Chaiken S, Trope E, editors. Dual process theories in social psychology. New York: Guilford Press; 1999. pp. 383–400. [Google Scholar]
- Jackson JD, Balota DA. Mind-wandering in younger and older adults: Converging evidence from the Sustained Attention to Response Task and reading for comprehension. 2011 Jun 27; doi: 10.1037/a0023933. Advance online publication. [DOI] [PMC free article] [PubMed] [Google Scholar]
- Jensen AR. The importance of intraindividual variability in reaction time. Personality and individual differences. 1992;13:869–882. [Google Scholar]
- Johnson KA, Kelly SP, Bellgrove MA, Barry E, Cox M, Gill M, et al. Response variability in attention deficit hyperactivity disorder: Evidence for neuropsychological heterogeneity. Neuropsychologia. 2007;45:630–638. doi: 10.1016/j.neuropsychologia.2006.03.034. [DOI] [PubMed] [Google Scholar]
- Kane MJ, Bleckley MK, Conway ARA, Engle RW. A controlled-attention view of working-memory capacity. Journal of Experimental Psychology: General. 2001;130:169–183. doi: 10.1037//0096-3445.130.2.169. [DOI] [PubMed] [Google Scholar]
- Kane MJ, Brown LH, McVay JC, Silvia PJ, Myin-Germeys I, Kwapil TR. For whom the mind wanders, and when: An experience-sampling study of working memory and executive control in daily life. Psychological Science. 2007;18:614–621. doi: 10.1111/j.1467-9280.2007.01948.x. [DOI] [PubMed] [Google Scholar]
- Kane MJ, Conway ARA, Hambrick DZ, Engle RW. Variation in working memory as variation in executive attention and control. In: Conway ARA, Jarrold C, Kane MJ, Miyake A, Towse JN, editors. Variation in Working Memory. New York: Oxford University Press; 2007. pp. 21–48. [Google Scholar]
- Kane MJ, Engle RW. Working-memory capacity, proactive interference, and divided attention: Limits on long-term memory retrieval. Journal of Experimental Psychology: Learning, Memory, and Cognition. 2000;26:336–358. doi: 10.1037//0278-7393.26.2.336. [DOI] [PubMed] [Google Scholar]
- Kane MJ, Engle RW. Working-memory capacity and the control of attention: The contributions of goal neglect, response competition, and task set to Stroop interference. Journal of Experimental Psychology: General. 2003;132:47–70. doi: 10.1037/0096-3445.132.1.47. [DOI] [PubMed] [Google Scholar]
- Kane MJ, Hambrick DZ, Conway ARA. Working memory capacity and fluid intelligence are strongly related constructs: Comment on Ackerman, Beier, and Boyle. Psychological Bulletin (2005) 2005;131:66–71. doi: 10.1037/0033-2909.131.1.66. [DOI] [PubMed] [Google Scholar]
- Kane MJ, Poole BJ, Tuholski SW, Engle RW. Working memory capacity and the top-down control of visual search: Exploring the boundaries of 'executive attention'. Journal of Experimental Psychology: Learning, Memory, and Cognition. 2006;32:749–777. doi: 10.1037/0278-7393.32.4.749. [DOI] [PubMed] [Google Scholar]
- Keye D, Wilhelm O, Oberauer K, van Ravenzwaaij D. Individual differences in conflict-monitoring: Testing means and covariance hypothesis about the Simon and the Eriksen Flanker task. Psychological Research. 2009;73:762–776. doi: 10.1007/s00426-008-0188-9. [DOI] [PubMed] [Google Scholar]
- Klinger E, Cox WM. Dimensions of thought flow in everyday life. Imagination, Cognition and Personality. 1987–88;7:105–128. [Google Scholar]
- Larson GE, Alderton DL. Reaction time variability and intelligence: A “worst performance” analysis of individual differences. Intelligence. 1990;14:309–325. [Google Scholar]
- Larson GE, Saccuzzo DP. Cognitive correlates of general intelligence: Toward a process theory of g. Intelligence. 1989;13:5–31. [Google Scholar]
- Long DL, Prat CS. Working memory and Stroop interference: An individual differences investigation. Memory and Cognition. 2002;3:294–301. doi: 10.3758/bf03195290. [DOI] [PubMed] [Google Scholar]
- Marcovitch S, Boseovski JJ, Knapp RJ, Kane MJ. Goal neglect and working memory capacity in 4- to 6-year-old children. Child Development. 2010;81:1687–1695. doi: 10.1111/j.1467-8624.2010.01503.x. [DOI] [PubMed] [Google Scholar]
- Martínez K, Colom R. Working memory capacity and processing efficiency predict fluid but not crystallized and spatial intelligence: Evidence supporting the neural noise hypothesis. Personality and Individual Differences. 2009;46:281–286. [Google Scholar]
- Mason MF, Norton MI, Van Horn JD, Wegner DM, Grafton ST, Macrae CN. Wandering minds: The default network and stimulus-independent thought. Science. 2007;315:393–395. doi: 10.1126/science.1131295. [DOI] [PMC free article] [PubMed] [Google Scholar]
- Matzke D, Wagenmakers EJ. Psychological interpretation of the ex-Gaussian and shifted Wald parameters: A diffusion model analysis. Psychonomic Bulletin & Review. 2009;16:798–817. doi: 10.3758/PBR.16.5.798. [DOI] [PubMed] [Google Scholar]
- McGuire PK, Paulesu E, Frackowiak RSJ, Frith CD. Brain activity during stimulus independent thought. NeuroReport. 1996;7:2095–2099. [PubMed] [Google Scholar]
- McKiernan KA, D’Angelo BR, Kaufman JN, Binder JR. Interrupting the stream of consciousness: An fMRI investigation. NeuroImage. 2006;29:1185–1191. doi: 10.1016/j.neuroimage.2005.09.030. [DOI] [PMC free article] [PubMed] [Google Scholar]
- McVay JC, Kane MJ. Conducting the train of thought: Working memory capacity, goal neglect, and mind wandering in an executive-control task. Journal of Experimental Psychology: Learning, Memory, and Cognition. 2009;35:196–204. doi: 10.1037/a0014104. [DOI] [PMC free article] [PubMed] [Google Scholar]
- McVay JC, Kane MJ. Does mind wandering reflect executive function or executive failure? Comment on Smallwood and Schooler (2010) and Watkins (2005) Psychological Bulletin. 2008;136:188–197. doi: 10.1037/a0018298. [DOI] [PMC free article] [PubMed] [Google Scholar]
- McVay JC, Kane MJ. Why does working memory capacity predict variation in reading comprehension? On the influence of mind wandering and executive attention. Journal of Experimental Psychology: General. doi: 10.1037/a0025250. (in press) [DOI] [PMC free article] [PubMed] [Google Scholar]
- McVay JC, Kane MJ, Kwapil TR. Tracking the train of thought from the laboratory into everyday life: An experience-sampling study of mind-wandering across controlled and ecological contexts. Psychonomic Bulletin & Review. 2009;16:857–863. doi: 10.3758/PBR.16.5.857. [DOI] [PMC free article] [PubMed] [Google Scholar]
- Miller EK, Cohen JD. An integrative theory of prefrontal cortex function. Annual Review of Neuroscience. 2001;24:167–202. doi: 10.1146/annurev.neuro.24.1.167. [DOI] [PubMed] [Google Scholar]
- Miyake A, Friedman NP, Emerson MJ, Witzki AH, Howerter A. The unity and diversity of executive functions and their contributions to complex “frontal lobe” tasks: A latent variable analysis. Cognitive Psychology. 2000;41:49–100. doi: 10.1006/cogp.1999.0734. [DOI] [PubMed] [Google Scholar]
- Mogle JA, Lovett BJ, Stawski RS, Sliwinski MJ. What’s so special about working memory? An examination of the relationship among working memory, secondary memory, and fluid intelligence. Psychological Science. 2008;19:1071–1077. doi: 10.1111/j.1467-9280.2008.02202.x. [DOI] [PubMed] [Google Scholar]
- Navon D. Resources -- A theoretical soup stone? Psychological Review. 1984;91:216–234. [Google Scholar]
- Neumann O. Beyond capacity: A functional view of attention. In: Heuer H, Sanders AF, editors. Perspectives on perception and action. Hillsdale, NJ: Erlbaum; 1987. pp. 361–394. [Google Scholar]
- Nisbett RE, Wilson TD. Telling more than we can know: Verbal reports on mental processes. Psychological Review. 1977;84:231–259. [Google Scholar]
- Oberauer K. Binding and inhibition in working memory – Individual and age differences in short-term recognition. Journal of Experimental Psychology: General. 2005;134:368–387. doi: 10.1037/0096-3445.134.3.368. [DOI] [PubMed] [Google Scholar]
- Oberauer K. Design for a working memory. Psychology of Learning and Motivation. 2009;51:45–100. [Google Scholar]
- Oberauer K, Schulze R, Wilhelm O, Süß HM. Working memory and intelligence – their correlation and their relation: Comment on Ackerman, Beier, and Boyle (2005) Psychological Bulletin. 2005;131:61–65. doi: 10.1037/0033-2909.131.1.61. [DOI] [PubMed] [Google Scholar]
- Oberauer K, Süß HM, Wilhelm O, Sander N. Individual differences in working memory capacity and reasoning ability. In: Conway ARA, Jarrold C, Kane MJ, Miyake A, Towse JN, editors. Variation in working memory. New York: Oxford University Press; 2007. pp. 21–48. [Google Scholar]
- Perry AR, Laurie CA. Sustained attention and the Type A behavior pattern: The effect of daydreaming on performance. Journal of General Psychology. 2001;119:217–228. doi: 10.1080/00221309.1992.9917803. [DOI] [PubMed] [Google Scholar]
- Poole BJ, Kane MJ. Working memory capacity predicts the executive control of visual search among distractors: The influences of sustained and selective attention. Quarterly Journal of Experimental Psychology. 2009;62:1430–1454. doi: 10.1080/17470210802479329. [DOI] [PubMed] [Google Scholar]
- Ratcliff R, Rouder JN. Modeling response times for two-choice decisions. Psychological Science. 1998;9:347–356. [Google Scholar]
- Ratcliff R, Schmiedek F, McKoon G. A diffusion model explanation of the worst performance rule for reaction time and IQ. Intelligence. 2008;36:10–17. doi: 10.1016/j.intell.2006.12.002. [DOI] [PMC free article] [PubMed] [Google Scholar]
- Ratcliff R, Smith PL. A comparison of serial sampling models for two-choice reaction time. Psychological Review. 2004;111:333–367. doi: 10.1037/0033-295X.111.2.333. [DOI] [PMC free article] [PubMed] [Google Scholar]
- Ratcliff R, Thapar A, McKoon G. Individual differences, aging, and IQ in two-choice tasks. Cognitive Psychology. 2010;60:127–157. doi: 10.1016/j.cogpsych.2009.09.001. [DOI] [PMC free article] [PubMed] [Google Scholar]
- Ratcliff R, Thapar A, McKoon G. Effects of aging and IQ on item and associative memory. Journal of Experimental Psychology: General. 2001;140:464–487. doi: 10.1037/a0023810. [DOI] [PMC free article] [PubMed] [Google Scholar]
- Ratcliff R, Tuerlinckx F. Estimating parameters of the diffusion model: Approaches to dealing with contaminant reaction times and parameter variability. Psychonomic Bulletin & Review. 2002;9:438–481. doi: 10.3758/bf03196302. [DOI] [PMC free article] [PubMed] [Google Scholar]
- Reason JT. Human error. Cambridge, England: Cambridge University Press; 1990. [Google Scholar]
- Redick TS, Calvo A, Gay CE, Engle RW. Working memory capacity and go/no-go task performance: Selective effects of updating, maintenance, and inhibition. Journal of Experimental Psychology: Learning, Memory, and Cognition. 2011;37:308–324. doi: 10.1037/a0022216. [DOI] [PubMed] [Google Scholar]
- Reichle ED, Reineberg AE, Schooler JW. Eye movements during mindless reading. Psychological Science. doi: 10.1177/0956797610378686. (in press) [DOI] [PubMed] [Google Scholar]
- Roberts RJ, Pennington BF. An interactive framework for examining prefrontal cognitive processes. Developmental Neuropsychology. 1996;12:105–126. [Google Scholar]
- Robertson IH, Manly T, Andrade J, Baddeley BT, Yiend J. ‘Oops!’: Performance correlates of everyday attentional failures in traumatic brain injured and normal subjects. Neurospsychologia. 1997;35:747–758. doi: 10.1016/s0028-3932(97)00015-8. [DOI] [PubMed] [Google Scholar]
- Schmiedek F, Oberauer K, Wilhelm O, Süß HM, Wittmann WW. Individual differences in components of reaction time distributions and their relations to working memory and intelligence. Journal of Experimental Psychology: General. 2007;136:414–429. doi: 10.1037/0096-3445.136.3.414. [DOI] [PubMed] [Google Scholar]
- Schooler JW. Re-representing consciousness: Dissociations between experience and metaconsciousness. Trends in Cognitive Sciences. 2002;6:339–344. doi: 10.1016/s1364-6613(02)01949-6. [DOI] [PubMed] [Google Scholar]
- Schooler JW, Reichle ED, Halpern DV. Zoning out while reading: Evidence for dissociations between experience and metaconsciousness. In: Levin D, editor. Thinking and seeing: Visual metacognition in adults and children. Cambridge, MA: MIT Press; 2004. pp. 203–226. [Google Scholar]
- Shaw GA, Giambra LM. Task unrelated thoughts of college students diagnosed as hyperactive in childhood. Developmental Neuropsychology. 1993;9:17–30. [Google Scholar]
- Smallwood J, Beach E, Schooler JW, Handy TC. Going AWOL in the brain: Mind wandering reduces cortical analysis of external events. Journal of Cognitive Neuroscience. 2008;20:458–469. doi: 10.1162/jocn.2008.20037. [DOI] [PubMed] [Google Scholar]
- Smallwood J, Davies JB, Heim D, Finnigan F, Sudberry MV, O Connor RC, Obonsawain MC. Subjective experience and the attentional lapse. Task engagement and disengagement during sustained attention. Consciousness and Cognition. 2004;4:657–690. doi: 10.1016/j.concog.2004.06.003. [DOI] [PubMed] [Google Scholar]
- Smallwood J, Fitzgerald A, Miles LK, Phillips LH. Shifting moods, wandering minds: Negative moods lead the mind to wander. Emotion. 2009;9:271–276. doi: 10.1037/a0014855. [DOI] [PubMed] [Google Scholar]
- Smallwood JM, McSpadden M, Schooler JW. The lights are on but no one’s home: Meta-awareness and the decoupling of attention when the mind wanders. Psychonomic Bulletin and Review. 2007;14:527–533. doi: 10.3758/bf03194102. [DOI] [PubMed] [Google Scholar]
- Smallwood J, McSpadden M, Schooler JW. When attention matters: The curious incidence of the wandering mind. Memory & Cognition. 2008;36:1144–1150. doi: 10.3758/MC.36.6.1144. [DOI] [PubMed] [Google Scholar]
- Smallwood JM, McSpadden M, Luus B, Schooler JW. Segmenting the stream of consciousness: The psychological correlates of temporal structures in the time series data of a continuous performance task. Brain & Cognition. 2008;66:50–56. doi: 10.1016/j.bandc.2007.05.004. [DOI] [PubMed] [Google Scholar]
- Smallwood J, Obonsawin M, Baracaia SF, Reid H, O’Connor R, Heim D. The relationship between rumination, dysphoria, and self-referent thinking: Some preliminary findings. Imagination, Cognition, and Personality. 2002–2003;22:317–342. [Google Scholar]
- Smallwood J, Obonsawin M, Reid H. The effects of block duration and task demands on the experience of task unrelated thought. Imagination, Cognition and Personality. 2002–2003;22:13–31. [Google Scholar]
- Smallwood J, O’Connor RC, Sudbery MV, Obansawin MC. Mind-wandering and dysphoria. Cognition and Emotion. 2007;21:816–842. [Google Scholar]
- Smallwood J, Riby L, Heim D, Davies JD. Encoding during the attentional lapse: Accuracy of encoding during the semantic SART. Consciousness and Cognition. 2006;15:218–231. doi: 10.1016/j.concog.2005.03.003. [DOI] [PubMed] [Google Scholar]
- Smallwood JM, Schooler JW. The restless mind. Psychological Bulletin. 2006;132:946–958. doi: 10.1037/0033-2909.132.6.946. [DOI] [PubMed] [Google Scholar]
- Snodgrass JG, Corwin J. Pragmatics of measuring recognition memory: applications to dementia and amnesia. Journal of Experimental Psychology: General. 1988;117:34–50. doi: 10.1037//0096-3445.117.1.34. [DOI] [PubMed] [Google Scholar]
- Sobel KV, Gerrie MP, Poole BJ, Kane MJ. Individual differences in working memory capacity and visual search: The roles of top-down and bottom-up processing. Psychonomic Bulletin & Review. 14:840–845. doi: 10.3758/bf03194109. [DOI] [PubMed] [Google Scholar]
- Steiger JH. Tests for comparing elements of a correlation matrix. Psychological Bulletin. 1980;87:245–251. [Google Scholar]
- Stuyven E, Van der Goten K. Stimulus independent thoughts and working memory: The role of the central executive. Psychologica Belgica. 1995;35:241–251. [Google Scholar]
- Teasdale JD, Dritschel BH, Taylor MJ, Proctor L, Lloyd CA, Nimmo-Smith I, Baddeley AD. Stimulus-independent thought depends on central executive resources. Memory and Cognition. 1995;23:551–559. doi: 10.3758/bf03197257. [DOI] [PubMed] [Google Scholar]
- Teasdale JD, Proctor L, Lloyd CA, Baddeley AD. Working memory and stimulus-independent thought: Effects of memory load and presentation rate. European Journal of Cognitive Psychology. 1993;5:417–433. [Google Scholar]
- Tse C-S, Balota DA, Yap MJ, Duchek JM, McCabe DP. Effects of healthy aging and early stage dementia of the Alzheimer’s type on components of response time distributions in three attention tasks. Neuropsychology. 2010;24:300–315. doi: 10.1037/a0018274. [DOI] [PMC free article] [PubMed] [Google Scholar]
- Unsworth N, Engle RW. The nature of individual differences in working memory capacity: Active maintenance in primary memory and controlled search from secondary memory. Psychological Review. 2007;114:104–132. doi: 10.1037/0033-295X.114.1.104. [DOI] [PubMed] [Google Scholar]
- Unsworth N, Engle RW. The nature of individual differences in working memory capacity: Active maintenance in primary memory and controlled search from secondary memory. Psychological Review. 2007;114:104–132. doi: 10.1037/0033-295X.114.1.104. [DOI] [PubMed] [Google Scholar]
- Unsworth N, Heitz RP, Schrock JC, Engle RW. An automated version of the operation span task. Behavior Research Methods. 2005;37:498–505. doi: 10.3758/bf03192720. [DOI] [PubMed] [Google Scholar]
- Unsworth N, Redick TS, Heitz RP, Broadway JM, Engle RW. Complex working memory span tasks and higher-order cognition: A latent-variable analysis of the relationship between processing and storage. Memory. 2009;17:635–654. doi: 10.1080/09658210902998047. [DOI] [PubMed] [Google Scholar]
- Unsworth N, Redick TS, Lakey CE, Young DL. Lapses in sustained attention and their relation to executive control and fluid abilities: An individual differences investigation. Intelligence. 2010;38:111–122. [Google Scholar]
- Unsworth N, Schrock JC, Engle RW. Working memory capacity and the antisaccade task: Individual differences in voluntary saccade control. Journal of Experimental Psychology: Learning, Memory, and Cognition. 2004;30:1302–1321. doi: 10.1037/0278-7393.30.6.1302. [DOI] [PubMed] [Google Scholar]
- Unsworth N, Spillers GJ. Working memory capacity: Attention control, secondary memory, or both? A direct test of the dual-component model. Journal of Memory and Language. 2010;62:392–406. [Google Scholar]
- Van Ravenzwaaij D, Brown S, Wagenmakers EJ. An integrated perspective on the relation between response speed and intelligence. Cognition. 2011;119:381–393. doi: 10.1016/j.cognition.2011.02.002. [DOI] [PubMed] [Google Scholar]
- Wagenmakers EJ, van der Maas HLJ, Grasman RPPP. An EZ-diffusion model for response time and accuracy. Psychonomic Bulletin & Review. 2007;14:3–22. doi: 10.3758/bf03194023. [DOI] [PubMed] [Google Scholar]
- West R. The transient nature of executive control processes in younger and older adults. European Journal of Cognitive Psychology. 2001;13:91–105. [Google Scholar]
- Wilhelm O, Oberauer K. Why are reasoning ability and working memory capacity related to mental speed? An investigation of stimulus-response compatibility in choice reaction time tasks. European Journal of Cognitive Psychology. 2006;18:18–50. [Google Scholar]
- Wilson TD. Strangers to ourselves: Discovering the adaptive unconscious. Cambridge, MA: Harvard University Press; 2002. [Google Scholar]