Abstract
A major factor involved in providing closed loop feedback for control of neural function is to understand how neural ensembles encode online information critical to the final behavioral endpoint. This issue was directly assessed in rats performing a short-term delay memory task in which successful encoding of task information is dependent upon specific spatiotemporal firing patterns recorded from ensembles of CA3 and CA1 hippocampal neurons. Such patterns, extracted by a specially designed nonlinear multi-input multi-output (MIMO) nonlinear mathematical model, were used to predict successful performance online via a closed loop paradigm which regulated trial difficulty (time of retention) as a function of the “strength” of stimulus encoding. The significance of the MIMO model as a neural prosthesis has been demonstrated by substituting trains of electrical stimulation pulses to mimic these same ensemble firing patterns. This feature was used repeatedly to vary “normal” encoding as a means of understanding how neural ensembles can be “tuned” to mimic the inherent process of selecting codes of different strength and functional specificity. The capacity to enhance and tune hippocampal encoding via MIMO model detection and insertion of critical ensemble firing patterns shown here provides the basis for possible extension to other disrupted brain circuitry.
Keywords: hippocampal ensembles, short-term memory task, nonlinear math model, closed-loop control, relation to normal encoding patterns
I. INTRODUCTION
The encoding of memory by brain systems has long been one of the major interests of neuroscience research and requires recognition, categorization and detection of information in order to operate effectively [1-5]. The brain structure most intricately involved in this process is the hippocampus, existing in all mammalian species and capable of long-term retention of goal-directed objectives [4;6-11]. Functional diagnoses of the dual-layered anatomic subdivision of CA3 and CA1 hippocampal cell fields together with multi-connected synaptic micro-architecture interfaced with other limbic structures, have been pursued over many years to gain insight into these memory process [7;8;12;13]
In order to understand how the hippocampus encodes information several features of both the situational context, as well as the representative aspects of simultaneously recorded multineuron firing patterns, must be interpreted and manipulated before a functional process is revealed [14;15]. In a recent report [16], such characterizations have been achieved by integrating 1) an effective operational nonlinear mathematical model for online prediction of multineuron CA1 cell discharges from simultaneously recorded firing patterns of multiple presynaptic CA3 neurons [16-19]; with 2) systematically recorded hippocampal ensemble activity in a well characterized short-term memory task in which stimulus encoding was a requirement [22-24]. This integration provided a format for controlling performance in a “closed loop” manner by detecting ensemble activity online during task-relevant events and changing task difficulty in a manner consistent with the level or “strength” of encoding of those behavioral events [25-27]. It was also demonstrated for the first time that these same ensemble firing patterns could be delivered via electrical stimulation to the same hippocampal recording locations to enhance performance on trials in which events were insufficiently encoded, which improved normal performance or recovered performance when hippocampal function was pharmacologically compromised [16].
From these investigations it was determined that an important factor controlling the relationship between ensemble firing and performance is the relationship of spontaneously generated code strength to performance on a particular trial. We have shown in the past that “strong codes” defined as those that occur on correct trials with long delays are the most effective version and that “weak codes” that occur on trials which are errors are the least effective [18]. This can be determined directly by tracking changes in the spontaneous distribution of code strengths that accompany alterations in overall performance over time. In recent work [20] we have shown that cumulative effects of MIMO and Generic based strong code stimulation patterns improve performance on trials in the same sessions in which stimulation is not administered and that that this improvement persists after stimulation has been removed. Such circumstances provide the means to track changes in spontaneously generated code strength associated with improved performance and to subsequently associate those changes with alterations in firing characteristics of different neurons in the hippocampal ensembles [23].
II. METHODS
Subjects and Training
Animals
Subjects were Long-Evans rats (Harlan) aged 4-6 months (n=45) individually housed and allowed free access to food with water-restriction to maintain 85% of ad libitum body weight during testing. All animal protocols were approved by the Wake Forest University Institutional Animal Care and Use Committee, Association for Assessment and Accreditation of Laboratory Animal Care and the National Institute of Health Guide for the Care and Use of Laboratory Animals (NIH Publication No. 8023).
Apparatus
The behavioral testing apparatus for the delayed nonmatch to sample (DNMS) task is the same as reported in other studies [21;22] and consisted of a 43 × 43 × 50 cm Plexiglas chamber with two retractable levers (left and right) positioned on either side of a water trough on the front panel. A nosepoke device (photocell) was mounted in the center of the wall opposite the levers with a cue light positioned immediately above the nosepoke device [18]. A video camera was mounted on the ceiling and the entire chamber was housed inside a commercially built sound-attenuated cubical.
Behavioral Training Procedure
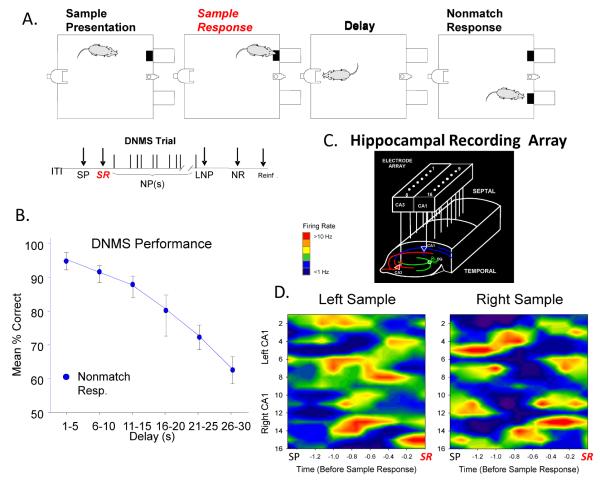
The DNMS task consisted of three main phases: Sample, Delay and Nonmatch. At the initiation of a trial, in the Sample phase either the left or right lever was extended (50% probability) requiring the animal to press it as the Sample Response (SR). The lever was then retracted and the Delay phase of the task initiated, as signaled by the illumination of a cue light over the nosepoke photocell device on the wall on the opposite side of the chamber (Figure 1A). At least one nosepoke (NP) was required during the delay interval which varied randomly in duration (1-30 s) on each trial during the session. When the delay timed out the photocell cue light turned off and both the left and right levers on the front panel were extended, signaling the onset of the Nonmatch phase. Correct responses consisted of pressing the lever in the Nonmatch phase located in the spatial position opposite the SR (nonmatch response: NR). This produced a drop of water (0.4 ml) reward in the trough between the two levers. After the NR the levers were retracted for a 10.0 s intertrial interval (ITI) before the next Sample lever was presented to begin the next trial. A lever press at the same position as the SR (Match Response) constituted an “error” with no water delivery and turned off of the chamber house lights for 5.0s and the next trial was presented 5.0 s later. Individual performance was assessed as % NRs (correct responses) with respect to the total number of trials (100-150) per daily (1 hr) sessions.
Fig. 1.
Delayed nonmatch to sample (DNMS) task and associated hippocampal ensemble activity. A: Diagram of different phases of DNMS task: 1) Sample lever presentation (SP) in one of two positions (left or right) and Sample lever response (SR) followed by 2) Delay interval of random durations during which delay timeout was contingent on a nosepoke into photocell mounted on opposite wall, followed by 3) simultaneous presentation of both levers (left and right) in Nonmatch phase in which 4) a Nonmatch Response (NR) on the lever opposite the spatial position to the prior SR produced, delivery of 0.2 ml of water to the trough between levers for the correct (Nonmatch) choice or 5) a response on the same lever as the SR shut off houselights for 5s indicating an incorrect (Match) choice and no reward. Timeline shows sequence of task phases: ITI – intertrial interval; SP – sample lever presentation; SR – sample response; Delay – delay interval; NPs – nosepokes during Delay; LNP – last nosepoke; NR – nonmatch position response; Reinf. – delivery of water (0.2 ml) reward. B: DNMS task performance. Mean (±SEM) % correct NRs summed across animals (n = 23) shows significant decline in accuracy (F(5,1271) = 6.62, p<0.001) as a function of duration of delay in 5.0s blocks. C: Hippocampal recording array consisted of eight pairs of stainless steel 20 μm wires positioned longitudinally within each hippocampus at 200 μm intervals, For each pair one electrode was positioned in CA3 and the other in CA1 cell field in a line tangent to the longitudinal axis of the hippocampus. Arrays were implanted bilaterally in each hippocampus providing a total of 32 electrodes per animal. D: Multineuron mean firing rate contour maps show relationship of hippocampal ensemble firing to both types of SR events (Left and Right Sample lever presses) for a single ensemble averaged over several trials (n=50). Neural firing rates (color shading representing vertical deflection) are shown for each electrode position commencing at Sample lever presentation (SP) to occurrence of Sample response (SR). Firing rate scale (colored bar): blue < 1.0 Hz, red > 10.0 Hz.
Surgery
Hippocampal Electrode Arrays
All surgical procedures conformed to National Institutes of Health and Association for Assessment and Accreditation of Laboratory Animal Care guidelines, and were performed in a rodent surgical facility approved by the Wake Forest University Institutional Animal Care and Use Committee. After being trained to criterion performance level in the DNMS task animals were anesthetized with ketamine (100 mg/kg) and xylazine (10 mg/kg) and placed in a stereotaxic frame. Craniotomies (5mm-diameter) were performed bilaterally over the dorsal hippocampus to provide for implantation of 2 identical array electrodes (Neurolinc, New York, NY), each consisting of two rows of 8 stainless steel wires (diameter: 20 μm) positioned such that the geometric center of each electrode array was centered at co-ordinates 3.4 mm posterior to Bregma and 3.0 mm lateral (right or left) to midline [23]. The array was designed such that the distance between two adjacent electrodes within a row was 200 μm and between rows was 400 μm to conform to the locations of the respective CA3 and CA1 cell layers. The longitudinal axis of the array of electrodes was angled 30° to the midline during implantation to conform to the orientation of the longitudinal axis of the hippocampus, with posterior electrode sites more lateral than anterior sites (Figure 1C). The electrode array was lowered in 25-100 μm steps to a depth of 3.0 - 4.0 mm from the cortical surface for the longer electrodes positioned in the CA3 cell layer, leaving the shorter CA1 electrodes 1.2 mm higher with tips in the CA1 layer. Extracellular neuronal spike activity was monitored from all electrodes during surgery to maximize placement in the appropriate hippocampal cell layers. After placement of the array the cranium was sealed with bone wax and dental cement and the animals treated with buprenorphine (0.01–0.05 mg/kg) for pain relief over the next 4-6 hrs. The scalp wound was treated periodically with Neosporin antibiotic and systemic injections of penicillin G (300,000 U, intramuscular) were given to prevent infection. Animals were allowed to recover from surgery for at least 1 week before continuing behavioral testing [16].
Multineuron Recording of Hippocampal Ensembles
Electrophysiological Monitoring and Acquisition of Neuronal Data
Animals were connected by cable to the recording apparatus via a 32-channel headstage and harness attached to a 40-channel slip-ring commutator (Crist Instruments, Hagerstown, MD) to allow free movement in the behavioral testing chamber. Single neuron action potentials (spikes) were isolated by time-amplitude window discrimination and computer-identified individual waveform characteristics using a multi-neuron acquisition (MAP) processor (Plexon Inc., Dallas, TX, USA). Single neuron spikes were recorded daily using waveform and firing characteristics within the task (perievent histograms) for each of the DNMS events (SR, LNP & NR). Only isolated spike waveforms exhibiting firing rates consistent with CA1 and CA3 principal cells (i.e. 0.5-5.0 Hz baseline firing rate) and stable behavioral correlates across sessions were employed for experimental manipulations and model development [16;21;24]. Hippocampal neuron ensembles used to analyze encoding of DNMS events consisted of 15-32 single neurons, each recorded from a separate identified electrode location on either of the bilateral arrays.
Identification of Functional Cell Types
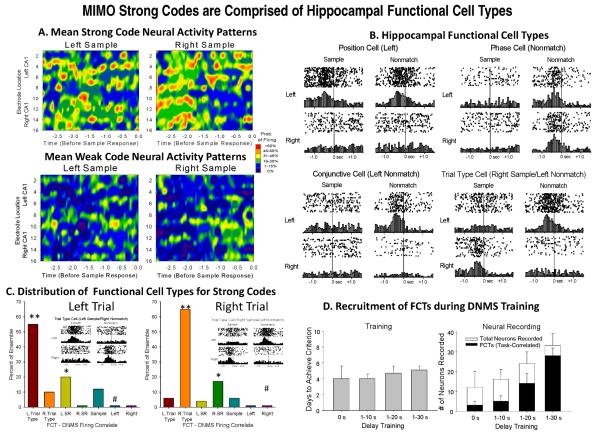
Prior studies from this laboratory have identified hippocampal neurons recorded as above by “Functional Cell Types” (FCTs) described by different behavioral correlates of DNMS task-related events such as lever position and/or phase of the task [25;26]. Individual neurons exhibit firing rate increases in response to Sample and Nonmatch responses (Figure 3B); however, the defining characteristic an FCT in this context is that the neuron responds only to a specific combination of events within the trial. Neural firing in response to each Sample (SR) or Nonmatch (NR) response event is analyzed by standard score where the baseline firing rate is computed 1.5-2.0 sec prior to the SR or NR, and the peak firing rate computer ±0.5 sec around the SR or NR. Neurons are then categorized according to simple responses: Sample only, Nonmatch only, Left only, Right only; conjunctive cells: Right Sample only, Left Sample only, Right Nonmatch only, Left Nonmatch only; or Trial-type cells: Right Sample + Left Nonmatch, Left Sample + Right Nonmatch. Neurons that do not match these criteria categorized as indeterminate correlates and constitute less than 10% of recorded neurons in fully trained animals [25;26]
Fig. 3.
Neuronal Composition of MIMO Detected SR Codes: A. Contour map representations of mean firing characteristics of hippocampal ensembles during MIMO detected strong and weak SR codes for each lever position (as in Figure 2B). Color scale indicates probability of firing across animals (n=15) for each spatiotemporal coordinate on contour maps. B. Examples of functional cell types of hippocampal neurons recorded on same bilateral arrays determined by correlated firing (± 1.5s) to Sample (SR) and Nonmatch (NR) task events (0.0s). Raster and perievent histograms for 4 different types of FCTs, Position, Phase, Conjunctive and Trial Type (TT) are shown for each lever position (right or left) and each phase (sample or nonmatch) of the task. TT cells encode the correct response sequence in the DNMS task by only firing during a response in the Nonmatch phase that is opposite the lever position of SR in which increased firing occurred in the Sample phase [22;25]. C. Percent of FCTs (B) relative to total cells recorded that increased firing during strong SR code trials. TT cells were the major contributors but specifically only when the appropriate lever position for that TT was responded to, as indicated by no increase in firing of the same TT cells on opposite types of trials (i.e. L vs. R lever position). Asterisks: * X2(46)>72.3, p<0.01; ** X2(46)>83.4, p<0.001 greater than expected; #X2(46)>69.8, p<0.01 less frequent than expected by Monte Carlo random probability. D. Relationship of FCTS to Training Level. Left: Level of training (# sessions) required for hippocampal ensembles to develop neurons of FCT status as a function of exposure to delay intervals of longer duration. Right: Ratios of number of FCTs detected to total number of neurons recorded in ensembles as a function of exposure to the gradual increase in duration of trial delays (1-30 s) during training. As the delay increased the ration of the number of FCTs to the total population of cells increased to near maximum [26].
Nonlinear Systems Derivation of Neural Codes
Multi-Input, Multi-Output (MIMO) Model
A general, Volterra kernel-based strategy for modeling MIMO nonlinear dynamics underlying spike train-to-spike train transformations between CA3 and CA1 was established to predict output patterns of CA1 firing pattern from input patterns of CA3 neural activity [18;27;28]. In this approach, the modeling of spatiotemporal pattern transformations from the hippocampal CA3 region to the CA1 region is formulated as the identification of an MIMO system that can be decomposed into a series of multiple-input, single-output (MISO) subsystems with physiologically identifiable structure that can be expressed by the following equations:
The variable xi represents input spike trains; yi represents output spike trains. The hidden variable w represents the pre-threshold membrane potential of the output neurons. It is equal to the summation of three components, i.e., synaptic potential u caused by input spike trains, the output spike-triggered after-potential a, and a Gaussian white noise input ε with standard deviation σ. The noise term models both intrinsic noise of the output neuron and the contribution of unobserved inputs. When w exceeds threshold, θ , an output spike is generated and a feedback after-potential (a) is triggered and then added to w. Feedforward kernels k describe the transformation from x to u. The feedback kernel, h, describes the transformation from y to a. u can be expressed as a Volterra functional series of x, as in
The zeroth order kernel, k0, is the value of u when the input is absent. First order kernels, k1(n), describe the linear relation between the nth input xn and u. Second and third order self-kernels, k2(n), and k3(n), describe the 2nd and 3rd order nonlinear relation between the nth input xn and u, respectively. Second order cross-kernels k2(n1,n2) reflect the 2nd order nonlinear interactions between each unique pair of inputs (xn1 and xn2) as they affect u. N is the number of inputs. Mk denotes the memory length of the feedforward process. The feedback variable a can be expressed as:
where h is the linear feedback kernel. Mh is the memory of the feedback process. In total, then, the model describes how temporal patterns of third-order (i.e., the effects of triplets) for each input, and second-order (i.e., the effects of pairs) for any of two interacting inputs, affect each output, taking into account differing noise level and output spike-triggered feedback (the latter due to circuitry and/or membrane biophysics), and neuron-specific differences in thresholds. In order to reduce the number of open parameters to be estimated, both k and h are expanded with orthonormal Laguerre basis functions [29]. Due to the Gaussian noise term and the threshold, this model can be considered a special case of the Generalized Laguerre-Volterra Model (GLVM) which employs a probit link function [17]. All model parameters, i.e., feedforward Volterra kernel k and feedback Volterra kernel h can be estimated using an iterative re-weighted least-squares method [30]. Noise deviation σ and threshold θ are redundant variables and thus can be indirectly obtained through variable transformation [17]. Due to the stochastic nature of the system, estimated models are validated using an out-of-sample Kolmogorov-Smirnov test based on the time-rescaling theorem [31].
The success of the application of MIMO model [30;32] for assessing the ‘temporal structure’ of ensemble firing was revealed in prior reports applied offline to data from hippocampal ensemble recordings in the DNMS task to determine the temporal relation between spike occurrences recorded in CA3 and CA1, i.e. the “ensemble code” [17;18;28;33;34]. More recently the significance of MIMO derived ensemble codes for the Sample Lever Response (SR) was determined by the demonstration of online application to animals performing the DNMS task and validated under several types of conditions including 1) closed loop control of performance and 2) use of electrical stimulation patterns derived from MIMO model extracted codes to facilitate performance [16].
Code Structure and Frequency
Computation and Analysis of MIMO Code Strength
CA3 and CA1 neural firing patterns associated with the most difficult trials that were correct at the longest DNMS trial delays (21-30 s) were classified as strong codes, while those associated with trials that were errors at the least difficult short delay trials (<15 s) were classified as weak codes (Figure 2B). Kernels of the MIMO model were computed using only strong code Left or Right DNMS trials, so that the model prediction of CA1 most likely generated strong codes for Left or Right trials only. Individual trial SR codes were identified and scored by computing the Pearson product-moment cross-correlation of each MIMO Model CA1 prediction with actual CA1 firing, and normalizing the resultant scores to mean = 0 and standard deviations = ±1.0%. Code strength on individual trials was then binned in code strength increments of 0.1 and the frequency of occurrence of trials with these values determined, yielding a bimodal distribution with peaks at approximately −2.0 and +2.0, representing the mean code strength on Left and Right trials respectively (Figure 6). Strong codes were subsequently defined as those trials with scores one standard deviation greater than the mean (i.e. peak) of the appropriate distribution of scores for that trial type (positive or negative in Figure 6). Alternatively weak codes were classified as those scores more than one standard deviation smaller than the mean of the distribution for that trial type. Analysis of the frequency distribution of SR code strength utilized Chi-square analysis with normal (control, Figure 2B) distribution as expected frequency (Ei) and the altered distributions (Strong and Weak codes in Figure 2B) as observed frequency (Oi). Analysis of neurons contributing to Strong and Weak codes involves identification of those electrodes with the highest (≥ 50%) temporally-specific coefficient weightings for the MIMO model, which also defines the firing correlations of those neurons as Functional Cell Types (FCTs) for the DNMS task as previously described [22;25;26;35] and utilizes the descriptions of Sample, Nonmatch, Left, Right, Conjunctive and Trial-Type cells as reported by Hampson et al. [25]. The relative frequency of contribution of different FCTs on individual trials was summed across animals to reveal the overall frequency distribution of FCTs contributing to each type of MIMO model code and statistically analyzed across animals and conditions by ANOVA.
Fig. 2.
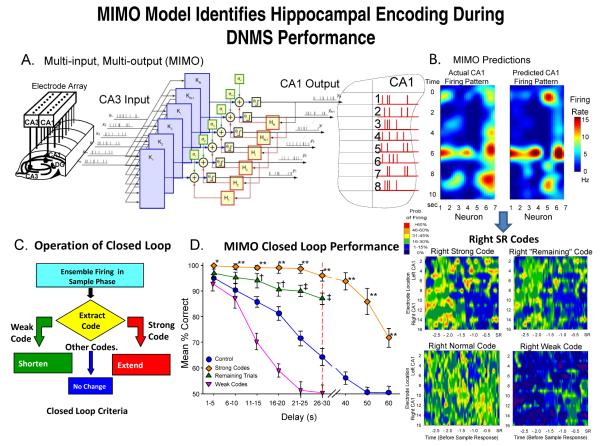
Multi-input, Multi-output (MIMO) nonlinear model analysis of hippocampal ensemble activity. A: Schematic of MIMO model. Spike trains recorded from CA3 electrodes (CA3 input) on the hippocampal array (left) constitute input to the MIMO model that predicts spike trains of cells recorded via CA1 electrodes (CA1 output) in the array (right). The spatiotemporal relationship between each CA1 output and multiple CA3 inputs modeled via Volterra kernels of orders 0-2 (see Methods) constructed from parallel Multi-input, Single-output (MISO) computations (K1-KN). Prediction of firing of each CA1 output neuron by the MIMO model as a function of prior multiple CA3 cell firing (inputs) shown in the foldout of hippocampus (CA1) accomplished in 2.0 ms. B: MIMO Model Predictions: Illustration of online waterfall display of ensemble activity over time (10 s, vertical axis) in the Sample Phase of a single trial. Color contour map depicts actual (instantaneous) firing rates for CA1 neurons and MIMO model predictions of firing from CA3 input listed by array positions 1-7 (horizontal axis). SR Codes (below): Mean firing rate contour maps for strong and weak MIMO derived SR codes of ensemble neuron activity recorded at each electrode location in both arrays calculated from 3.0s prior to and including SR occurrence (−3.0 to 0.0 s, X- axis) for left and right SR lever positions appropriate to the two types of DNMS trial. Color scale indicates probability of firing across animals (n=15) for each spatiotemporal coordinate on contour maps. C: Closed Loop Control of DNMS Task: Diagram shows operation of closed loop paradigm employing MIMO extracted strong or weak SR codes (SR Codes in B) to either extend or shorten the duration of the ensuing Delay interval on the same DNMS trial in which the SR code was detected. On trials without strong or weak SR codes delay durations were varied randomly as in normal training sessions. D: Performance on DMNS task (n=15) utilizing MIMO model detected SR codes for closed-loop control criteria (C) on both Strong and Weak SR Code trials compared to performance on trials (Control) without closed-loop feedback (F(1,1732) = 15.61, p<0.001). Trials on which strong SR codes were detected were extended beyond trained level of 30 sec (dotted line) and compared to trials in which such were not detected. Also shown is performance significantly higher (F(1,1732) = 7.96, p<0.01) than Control sessions on other non-closed loop trials (Remaining Trials) in sessions where weak SR code trials (weak codes) were changed to short delays of 10 sec by the closed loop procedure. Asterisks (*p<0.01, **p<0.001) indicate significant increase from Control; daggers (†p<0.01; ‡p<0.001) indicate significant differences between Remaining Trials in closed loop weak SR code sessions and Control sessions.
Fig. 6.
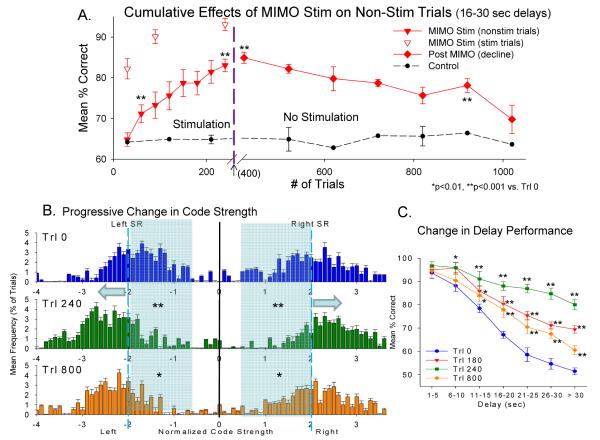
Cumulative Effects of MIMO Stimulation on DNMS Performance and Ensemble Coding. A. Plot shows change in mean % correct performance over successive 100 trial blocks on non-stimulated trials which occurred in sessions where strong SR code MIMO stimulation was delivered randomly on 20% of trials in the session. Performance on stimulated trials is shown as separate (open triangle) symbols. After 240 successive trials (12 sessions) MIMO stimulation was terminated and performance tracked over the remaining 8 sessions (600 trials) to follow the decline in performance back toward baseline level prior to when MIMO stimulation trials were initiated (dotted line-Control) for the same animals (n=11). B. Progressive increase in ensemble code strength as a function of Cumulative MIMO stimulation trials. Graphs show average distributions of SR code strengths for left and right levers on non-stimulated trials, prior to (Trl 0), at peak performance (Trl 240), and 1 week (Trl 800) following termination of cumulative MIMO stimulation trial sessions. Distributions show mean frequency of occurrence of non-stimulated trials with SR code strengths of ± 0-4.0 (coefficient score units normalized to Mean=0, S.D.=1, see Methods) based on derivations from MIMO coefficient allocations on each trial. Significant shift in distributions is shown by X2 comparison relative to distributions on trials before cumulative MIMO stimulation was initiated (dotted line control plot in A): *X2(80)=112.0, p<0.01; **X2(80)=231.3, p<0.001. Shaded region and arrows highlight shift in frequency distribution from normal SR codes (±1.5-2.5, blue bars) to stronger SR codes following 240 trials of cumulative stimulation (±2.0-3.0, green bars) and which persisted to a large extent after stimulation was terminated for 800 trials (orange bars). C. Delay curves for DNMS performance at different time points in the graph shown in A. Each curve reflects DNMS performance (% correct trials) after the indicated number of trials averaged across all animals (n=11) that occurred relative to MIMO stimulation and post-stimulation sessions shown in A at Trls 0, 180, 240 and 800.
Determination of SR Code Strength
An important factor controlling the relationship between ensemble firing and performance is the relationship of the strength of spontaneously generated SR codes with respect to successfully performing trials with different, non-predictable, delay intervals. We have shown in the past that “strong codes”, defined as those that lead to correct performance on long delay trials, are the most effective version and that “weak codes” that occur on trials which are errors are the least effective [16;18]. Since the association of code strength with the ensuing length of delay interval for a given trial constitutes the relation between ensemble firing and retention of trial specific information, the basis for spontaneously generated codes of different strengths on trials with randomly varying delay durations, is the major factor controlling performance of the DNMS task. This can be assessed directly by tracking changes in the distribution of code strengths (as described above) that accompany increases in performance over sessions. In prior work we have shown that that the cumulative effects of MIMO derived stimulation patterns [16] improve performance, however trials in the same sessions in which stimulation is not administered also show improvement in code strength but not as quickly nor to the same degree and the improvement persists after stimulation is no longer administered [20]. Such circumstances provide the means to track changes in spontaneously generated code strengths associated with improved performance and to subsequently compare those changes in code strength to alterations in firing characteristics of the underlying hippocampal neural ensembles as shown in the study reported here.
MIMO Generated Electrical Stimulation
Stimulation Parameters
A custom built 16-channel stimulator (Triangle BioSystems Inc. Durham, NC) was utilized to deliver patterns of electrical pulses to CA1 electrodes in both (bilateral) hippocampal arrays [16;36]. The stimulator delivered digital-to-analog (D/A) converted biphasic output pulses to the 8 CA1 electrodes in a single array. Each output channel delivered one-half of a symmetric biphasic stimulation pulse of 1.0 ms duration to a pair of adjacent electrodes in CA1 allowing localized bipolar stimulation isolated from other electrodes on the same array. Stimulator pulses were electronically gated to produce square constant voltage outputs in the range of 0.1 to 15 V (2.5-375 μA) in 0.05 V increments with an interpulse interval of 0.5 ms on a given channel. The range of parameters employed on individual MIMO output channels was typically, biphasic, 1.0-4.0 V p-p (25-100 μA), 1.0 ms, 10.0 Hz. Unilateral stimulation patterns consisted of 8 channels of pulses delivered to CA1 electrodes in trains of 1.5-3.0 s duration following Sample lever presentation as detected by the MIMO model and during performance of the SR. Controls for stimulation effects consisted of scrambling model coefficients to produce different patterns or shifting delivery of the pulse train to 3.0s after the completion of the SR [16].
III. RESULTS
Characterization of Hippocampal Ensemble Activity in the Delayed-Nonmatch-to-Sample (DNMS) Memory Task
Recordings and analyses of hippocampal ensemble activity in rodents performing a version of a delayed-nonmatch-to-sample (DNMS) memory task have been conducted over a number of years and have provided substantial insight into the functional nature of task-specific ensemble firing patterns [26;36]. Figure 1A shows the DNMS task which requires the rat to make a ‘Sample response’ (SR) at the start of the trial and retain the lever position information in order to make the correct lever position choice ‘Nonmatch response’ (NR) after an interposed temporal delay interval that varies randomly in duration from 1-30 s on different trials during the session. Figure 1B shows that DNMS performance accuracy decreases linearly as a direct function of the duration of the intervening delay interval which is a standard feature in fully trained animals (n=23). Hippocampal ensemble recording during the DNMS task employed custom designed arrays of microwire (20 μm) electrodes implanted bilaterally in the dorsal hippocampi (Figure 1C) to provide single neuron action potentials from 8 pairs of aligned CA3-CA1 probes spaced at 200 μm intervals along the longitudinal axis of the rodent hippocampus. Figure 1D illustrates prior findings that each SR event in the DNMS task generates a different and unique ensemble firing pattern that encodes conjunctive spatial position of the SR (left vs. right sample) on a given trial in order to successfully perform the required NR after the delay interval as a function of the position of the prior executed SR on the same trial [16;37;38].
Several aspects of this relationship of ensemble firing to performance of the DNMS task have been documented in the past including the nonlinear nature of trial-by-trial fluctuations in ensemble firing patterns associated with successful performance as well as changes in relation to the actions of endogenous neurotransmitters [18;24;39]. CA1 output predictions from the MIMO model shown in Figure 2 for a given ensemble were computed from 5-10 consecutive sessions for each animal. The MIMO model was applied to data from these sessions and utilized second-order self-kernels (k2s) to sufficiently capture CA3-CA1 nonlinear dynamics [17;33] which accurately predicted the CA1 (output) spike trains based on CA3 (input) spike trains on 1) correct long (25-30s) delay trials (strong SR codes) and on 2) error trials (weak SR codes), for each animal. Figures 2A&B show a detailed illustration of the manner in which CA1 cell firing was predicted by online readout of the MIMO model built from ensemble data recorded from each individual animal over several behavioral sessions [17;28]. These assessments showed that the MIMO model 1) predicted the output pattern in CA1 from the inputs of CA3 (Figure 2A) by 2) temporally synchronizing the multichannel activity across neurons in the same manner that occurs naturally in hippocampus [33]. The temporal correspondence with normally occurring CA1 spike events, provided the basis for predicting CA1 firing (Figure 2B) based only on CA3 inputs [40-42].
Closed Loop Application of Nonlinear MIMO Model to Detect and Predict Hippocampal ‘Ensemble Codes’ During Performance of DNMS Task
The nature of hippocampal ensemble firing during the DNMS task was examined utilizing online manipulation of task parameters [43;44] to define the extent to which detection of critical firing features could be exploited to enhance task performance. The precise relationship between hippocampal ensemble activity and successful DNMS performance was determined by a unique “closed-loop” procedure shown in Figure 2C&D. The method involved online monitoring of MIMO model derived ensemble firing patterns during the SR ( Figure 2A&B) and depending on the strength of the ensemble SR code (Figure 2B, lower right: SR codes for Strong, Weak, Normal and Remaining codes corresponding to curves in Figure 2D) the duration of the ensuing delay on the same trial was adjusted by the closed-loop procedure (Figure 2C). If the ensemble SR firing on a given trial was classified by online MIMO analyses to be a strong SR code (i.e. associated with correct trials) the closed-loop manipulation increased the duration of the delay beyond the intervals employed in normal testing trials (i.e. > 30s). On weak SR code trials (associated with errors), the closed loop procedure shortened the trial (to ≤10s) which was normally successfully performed. On trials in which strong SR codes were detected delay intervals were extended to one of three randomly-selected durations 40, 50, or 60 s, each longer than the animals’ normal maximum delay duration of 30 s, in order to detect the limits of the facilitation of performance for online detected strong SR codes. Trials on which closed-loop procedures were implemented occurred randomly on 20-25% of the total trials within a session depending upon frequency of spontaneously generated strong or weak SR codes.
The closed-loop procedure provided the critical test of the specificity of the MIMO predicted CA1 output patterns and their functional significance. Figure 2D (Strong Codes) shows that normal trials, on which the MIMO model detected strong SR codes, were consistently associated with maximal performance levels at all trained (1-30 s) delays. Performance on strong SR code trials with delays extended by the closed-loop procedure to 40, 50 or 60 s declined in a delay-dependent manner (Figure 2D, Strong Codes) but remained significantly (F(1,1732) = 15.61, p<0.001) higher than on non closed-loop trials with similar delays (Figure 2D, Control). Figure 2D also illustrates performance on trials in which weak SR codes were detected by the MIMO model (Weak Codes) indicating significantly reduced proficiency relative to both overall control levels and strong SR code trials. The closed-loop paradigm was thus implemented to detect weak SR code trials and shorten the delays to 10 s which maintained performance at > 85%, the same as on control trials (Figure 2D, Weak Codes) on weak code trials. However, performance on the remaining non closed-loop (i.e. trials in which weak SR codes were not detected by the MIMO model) in the same sessions was significantly improved at all delays > 10 s relative to control sessions (Figure 2D, Remaining Trials vs. Control); presumably because of the elimination of weak SR codes on longer (> 10 s) delay trials that were normally at risk for error (Figure 2D, Weak Codes).
Further determination of the specificity of MIMO model detection of task-dependent ensemble encoding was performed by randomly shuffling or ‘scrambling’ the coefficients of the MIMO model between CA1 neuron locations on the array, or with respect to timing of spike occurrences at each electrode location for the strong and weak SR codes employed in the closed-loop paradigm. Both of these procedures produced randomized outputs from the MIMO model with respect to the established SR codes and their strengths (strong or weak) in each animal [16]. The final determination of the power of the strong and weak SR code detection in the closed loop paradigm has been shown with respect to stimulation patterns administered that mimic strong codes for the left and right levers [16]. When those patterns were reversed performance was actually driven below chance level suggesting that the SR code is the actual information used to perform the task and that additional information obtained during the trial does not influence the dependence on the SR code to perform the NR. This manipulation of model generated coefficients indicates that such patterns, detected by the MIMO model as SR codes within trials were the critical factors that controlled DNMS performance, confirmed by the success of the closed-loop procedure.
Ensemble Neuron Bases of MIMO Strong SR Codes
The relationship of the strength of MIMO extracted ensemble SR codes to neuron representations of task-specific information in hippocampus was revealed by determining the nature of strong and weak SR codes with respect to individual neurons that encode specific features of the DNMS task [25;26]. Figure 3A depicts the distinct differences between average strong and weak SR code firing patterns for right or left lever as determined across a large population (n=19) of animals trained to the same levels of performance with recordings obtained from exactly the same locations with the multi-array electrodes shown in Figures 1C & 2A. It is clear that the patterns in Figure 3A are distinctly different for each lever and that the average of firing in hippocampal neuronal populations recorded show distinct differences when the animal encodes the information correctly (strong SR code Figure 3A, upper) vs. incorrectly (Figure 3A, lower, weak SR code). The basis for these firing patterns is shown in Figure 3B where examples of the actual firing patterns of individual Functional Cell Types (FCTs) is portrayed as histograms and individual trial rasters of event associated firing [26]. The contribution of each of these FCTs to the strong SR code firing patterns shown in Figures 3A for Left and Right levers is shown in Figure 3C in terms of % of total cells recorded that make up the patterns. The most important finding with respect to the MIMO model derivation of strong and weak SR codes is that strong SR codes are comprised primarily of Trial Type (TT) cells in the FCT categories which fire specifically not only during the Sample phase SR, but also when the opposite Nonmatch lever is pressed for a correct NR on that same trial (inserts in Figure 3C) irrespective of duration of delay [26].
The fact that TT cells basically encode the correct sequence of events in the trial and do not fire during other events, is why they are termed ‘Trial Type’ and effectively convey the appropriate information for doing the trial correctly when a particular SR lever is presented. The functional significance of this feature is that TT cell firing in the Nonmatch phase of the task at the NR is automatic. Hence if a TT cell fires during the SR it will also likely fire during the response on the opposite lever during the Nonmatch phase (Figures 3B&C) which will constitute a correct performance of the DNMS task. Therefore, it is highly significant that the MIMO model selectively detects when “appropriate” TT cells fire during the SR and as shown above in the closed loop paradigm, and this can be confirmed by coupling the detected SR firing to the trial delay to facilitate performance in the DNMS task (Figures 2C&D). A further verification of the significance of FCTs for effective ensemble encoding of task specific information is revealed by the evolution of FCT presence during task training. Figure 3D shows that as the number of days to criterion performance on the task increases with respect to the duration of interposed delay intervals (left, Training), the number of FCTs also increases such that in well trained animals nearly the entire population of neurons recorded qualify as FCTs (Figure 3D, Neural Recording). Thus the appearance of FCTs is directly related to 1) the detection of strong SR codes by MIMO model, 2) participation of the most appropriate FCTs the TT cells (Figure 3C) and 3) the training history of the animal with respect to task difficulty in terms of trials with longer delay durations (Figure 3D).
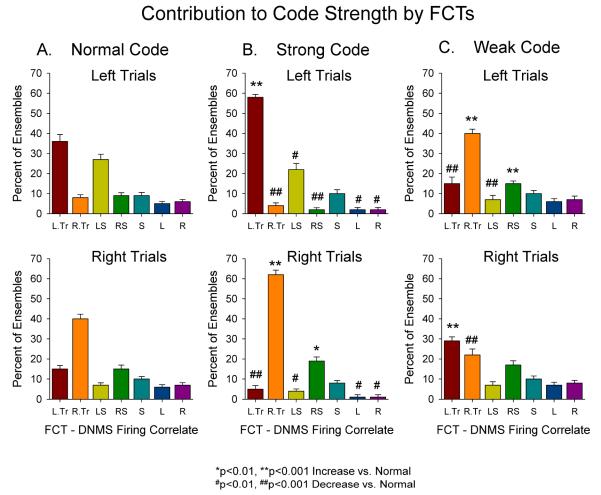
The predominance of this contribution of FCTs to the MIMO code is shown in Figure 4 where statistical representation of the 3 basic code types are shown for the same types of FCTs across animals (n=23) and sessions (n=10/animal) as a function of the average % of cells that provide significant number of coefficients to the MIMO model. It is clear that the differential firing of TT cells is the primary factor differentiating the types of codes associated with performance levels by the MIMO model shown in Figure 2D. The Normal code shown in Figure 4A is the configuration of FCT contributions exemplified by the map in Figure 2B (Right Normal) in which TT cells for both levers contribute type of trials but in a reduced manner relative to Strong code trials (Figure 4B). As shown in Figure 2B this makes the pattern of ensemble firing less distinct, which is demonstrated in Figure 4B not only by the significant increase in TTs “appropriate” for that trial type (*’s) but also the reduced participation of TTs and other FCTs whose activity is “inappropriate” for signaling that type of trial (#’s in Figure 4B). Finally, the change in the distribution for trials with Weak codes confirms the latter fact that when errors occur there is a disproportionate increase in the number of inappropriate TTs and FCTs that contribute to the code providing a basis for why the inappropriate lever is chosen in the nonmatch phase of the task.
Fig. 4.
Contribution of FCTs to Normal, Strong and Weak Codes. A. Percent of FCTs relative to total cells recorded that fired on normal SR code trials. Percent of total cells represented by each FCT is shown for Left (top) and Right (top) trials in which normal strength SR codes corresponding to Control (blue) curve in Figure 2D. DNMS firing correlates of FCTs: L.Tr – Left Trial-type; R.Tr – Right Trial-type; LS – Left Sample (conjunctive); RS – Right Sample (conjunctive); S – Sample; L – Left; R – Right. As in Figure 3C, trial type (TT) and conjunctive cells for the appropriate lever SR were the major contributors to the code strength. B. FCT contributions to strong SR code trials for the same DNMS sessions shown in A and correspond to the Strong code performance curve shown in Figure 2D (orange) is an extension of the individual session plot shown in Figure 3C. C. The same FCT contributions to weak SR code trials shows an increase in the firing of “inappropriate” FCTs (particularly TT cells) involved with encoding the opposite trial type SR. The number of animals was 23 and 10 sessions each to give a total of 230 sessions per calculation of each code strength. Significance Symbols: *F(1,390)>6.5, p<0.01; **F(1,390)>11.3, p<0.001 increase relative to Normal; #F(1,390)>6.4, p<0.01; ##F(1,390)>11.7, p<0.001 decrease relative to Normal.
Closing the Loop with MIMO Model Controlled Electrical Stimulation of Hippocampal Ensembles
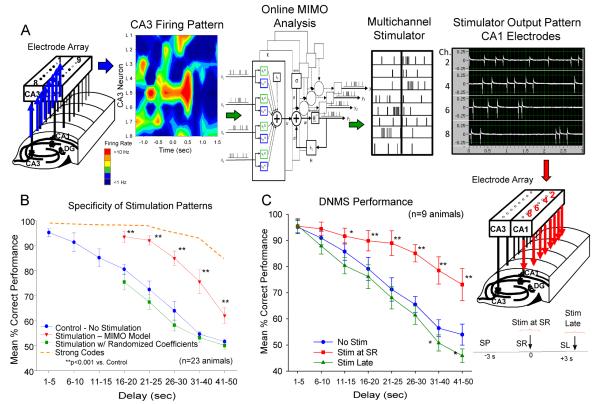
The ability to apply the MIMO model of hippocampal ensemble processing to closed-loop regulation of performance in the well characterized DNMS task provided the necessary basis to further demonstrate its effectiveness by utilizing the predicted CA1 output to stimulate those same regions electrically with the same pattern (Figure 2A). This demonstration reported recently in Berger et al [16] and shown in Figure 5A illustrates the capacity for MIMO based stimulation to provide appropriately patterned activation of CA1 when such connectivity is compromised [17;20;45;46]. To implement this procedure the CA1 output predictions of the MIMO model (Figure 2A&C) are transformed into simultaneous multichannel electrical stimulus pulses (1.0 ms biphasic pulses 20-100 μA) delivered to the same CA1 electrode locations in the bilateral ensemble recording arrays as shown in Figure 5A. Stimulation patterns are therefore identical to the SR firing patterns recorded from the respective CA1 electrodes delivered online to both hemispheres as a function of inputs to the MIMO model from the matching sets of CA3 electrodes on the same array (Figure 5A). Stimulation intensities for each CA1 location are adjusted to produce indications of extracellular current flow (i.e. evoked field potentials) at adjacent electrodes on the array [47]. MIMO model generated stimulation trains are 1.5-3.0 s in duration and timed to arrive at the appropriate CA1 loci within 10-50 ms of the CA3 input patterns associated with the SR. Thus, when CA3 firing predicts a strong SR code in CA1 via the MIMO model (Figure 3A), stimulus pulses are delivered to CA1 electrodes in the same temporal firing pattern as the predicted CA1 output pattern used to adjust DNMS delay duration in the closed-loop procedure [16].
Fig. 5.
MIMO model generated electrical stimulation of CA1 facilitates DNMS performance. A: MIMO Model Electrical Stimulation of CA1. Patterns of CA3 cell firing in hippocampal array (left: color contour map) constitute inputs for online MIMO model prediction of CA1 SR code firing patterns indicated by “tick” marks (CA1 output). The corresponding MIMO output pattern is fed to a programmable multichannel stimulator for generating 1.5-3.0 seconds trains of bipolar stimulation pulses in the same strong SR code pattern and delivered to the same CA1 electrodes in each hippocampal array [18]. Actual stimulator output for 4 channels (photo display) illustrates different stimulus intensities (pulse amplitude) delivered to different CA1 locations. Time differential between CA3 recorded input and delivery of associated CA1 stimulation output pattern by MIMO model was 50 ms. B: Improved DNMS Performance by MIMO Stimulation Patterns. Mean DNMS performance (% correct ±SEM) across animals (n=23) on trained (20-30 sec) and extended (40-60 sec) delay durations with interposed MIMO generated CA1 strong SR code stimulation (Stim MIMO model) vs. trials on which stimulation was not delivered (No Stim, F(1,731) = 11.50, p<0.001). Dashed orange curve indicates level of performance on closed-loop strong SR code trials without stimulation (Figure 2D) for comparison. Trials on which stimulation was generated from scrambled MIMO model CA1 coefficients are also shown (Scrambled Coefficients, vs. No Stim, F(1,731) = 2.12, p>0.05, vs. MIMO Model Stimulation, F(1,731) = 10.70, p<0.001; Figure 3B). Asterisks (*p<0.01, **p<0.001) indicate significant difference in DNMS performance compared to control (No Stim) trials. C: DNMS Performance. Separate group of animals (n=9) tested with MIMO model generated SR code stimulation (Stim at SR) vs. performance when the same exact stimulation pattern was delayed and delivered 3.0 sec after occurrence of the SR (Stim Late vs. No Stim: F(1,731) = 3.17, p>0.05). Asterisks (*p<0.01, **p<0.001) indicate significant difference in DNMS performance compared to control (No Stim.) trials.
The effects MIMO model stimulation are shown in Figure 5B as the significant (F(1,731) = 11.50, p<0.001) increase in accuracy of DNMS performance on stimulation trials at delays of 16-50s (Stim at SR) in comparison to performance on trials with the same delays without stimulation (No Stim). Figure 5B also shows comparisons with performance on closed-loop regulated (strong SR codes) trials which were more effective than the MIMO model stimulation of CA1 significant (F(1,731) = 15.72, p<0.001), but both procedures significantly improved performance at the same delays (> 16 s) relative to No-Stim trials. The specificity of the facilitating effect of MIMO stimulation patterns was tested directly by delivering stimulus pulses of the same intensity to different CA1 locations and in different temporal sequences by randomly distributing or “scrambling” MIMO model generated coefficients (Figure 5B, stim w/ scrambled coefficients) in the same manner as described previously [16]. This produced no significant changes (F(1,731) = 2.12, n.s.) from control (non-stimulated) DNMS performance, in the same manner as scrambled coefficients in the closed-loop paradigm. Finally specificity of the stimulation-induced facilitation of SR encoding was determined directly by merely delaying delivery of successful SR code stimulation patterns until ≥ 3.0 s after the occurrence of the SR (Figure 5C, Stim Late), which produced no significant (F(1,731) = 3.17, n.s.) change from control performance.
Cumulative MIMO Stimulation Increases SR Code Strength on Non-stimulation Trials
The above demonstrations indicate the pattern specificity of hippocampal ensemble SR codes and show that the same codes delivered as electrical stimulation pulses are capable of reversing and enhancing performance on trials that do not show indications of strong SR codes (Figure 2D, Remaining trials). An important factor related to delivery of effective stimulation in neural prostheses [16] is the ability to modify the underlying neural substrate in a manner that provides improved performance over time such that stimulation is no longer necessary. The plasticity of hippocampal neural networks is well known and in particular the Schaeffer collateral CA3-CA1 connections exhibit an extraordinary capacity for synaptic potentiation [8;48-50]. Because of this potential for alteration in synaptic efficacy, MIMO electrical stimulation was delivered randomly on longer delay (> 16 s) trials for several sessions and performance on Stimulated and Non-stimulated trials tracked over the same time period. Figure 6A shows the change in performance over the time course of delivery of MIMO stimulation (240 trials) on trials that did not receive stimulation (Non-stim, filled triangles) compared to the more rapid change on Stim trials (open triangles) over the same time period. It is clear that performance increased in a linear manner but that the rate of change in performance for Non-stim trials was significantly slower (F(1,476) = 21.53, p<0.01) than for Stim trials. This was reflected also by alterations in performance after MIMO stimulation was terminated. Even though mean performance declined back toward baseline for those nonstimulated trials, the time course was significantly longer (Figure 6A, Post MIMO decline) than required to reach maximum levels during MIMO stimulation. These changes were also reflected in the delay curves shown in Figure 6C in which performance as a function of delay on Non-stim trials shows a similar increase (Trls 180, 240) and then decline (Trl 800) associated with the presence or absence respectively of Stim trials within the session. As a further confirmation of the dependence of DNMS performance on MIMO derived SR code strength, Figure 6B plots a derived measure based on frequency of different MIMO coefficient values correlated with neuron firing in the ensemble (Figure 2A) as a function of Pre (Trl 0), During (Trl 240) or Post (Trl 800) cumulative MIMO stimulation shown in Figure 6A. After performance on Non-stim trials reached a maximum at 240 trials of cumulative MIMO stimulation (Figure 6A, Non-stim), the distribution of SR code strength on the same trials also shifted (X2(80)=231.3, p<0.001) toward stronger SR codes for both left and right SRs as highlighted by the blue shaded regions which emphasize reduction in bars associated with frequency of occurrence of code strengths <2.0 or >−2.0. These alterations in SR code strength relative to pre MIMO stim levels (Trl 0) persisted for at least one week after stimulation was terminated as shown in Figure 6B (Trl 800) which correlated with the corresponding slow decrease in performance depicted in Figures 6A (decline) and 6C (Trls 800) over the same time period.
Repeated MIMO Stimulation Provokes Recruitment of Hippocampal Trial Type Cells
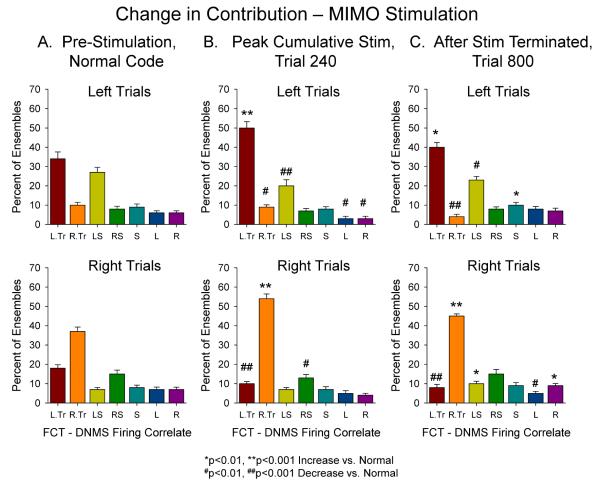
The final demonstration of MIMO sensitivity to hippocampal ensemble encoding of DNMS task information was demonstrated over the same trials in which MIMO stimulation changed the frequency of firing of FCTs associated with alterations in SR code strength on Non-stim trials as shown in Figure 6B. Figure 7B shows that the changes in performance and SR code strength produced by cumulative MIMO stimulation (Figure 6) were associated with increased percentage of FCTS cells firing relative to the same distribution prior to repeated MIMO stimulation trials (Figure 7A). This change in distribution of FCTs contributing to the MIMO code after 240 trials at the peak of cumulative MIMO stimulation (Figure 7B), is similar to that shown in Figure 4B for FCT contributions on trials categorized as Strong code signified by the same increase in appropriate and decrease in inappropriate TT contributions relative to normal code trials (Figures 4A&7A). Finally, when cumulative MIMO stimulation was terminated there was a reduction in the appropriate FCT contributions to MIMO codes as shown in Figure 7C relative to the peak of the stimulation period (Figure 7B) however even after 800 trials codes on nonstimulated trials remained elevated with respect to pre-stimulation levels (Figure 7A) consistent with the maintained increase in performance shown in Figures 6A&C.
Fig. 7.
Modulation of contribution of appropriate FCTs to SR codes on non-stimulated trials following cumulative sessions with intermittent MIMO stimulation trials. A. Non-stimulated control trials prior to onset of MIMO stimulation (Pre-stimulation) shows frequency distribution of FCTs contributing to SR code strengths which is similar to that shown in Figure 4A. B. Increased FCT contribution to SR code strength on non-stimulated trials after Trl 240 shown in Figure 6A. The distributions resemble that of strong SR code trials shown in Figure 4B due to increased contribution by TT cells for the appropriate trial type. Changes in percent of code strength firing by non-TT FCTs reflects possible increased convergent influence on other hippocampal TT cells. C. After termination of cumulative MIMO stimulation for 560 trials (Trl 800), the distribution of FCTs is altered toward that of normal codes (A), but with significantly less contribution of TT cells for the inappropriate trial type. This may reflect participation of more appropriate TTs (Figure 4B) as a result of residual aftereffects of cumulative MIMO stimulation. Significance Symbols: *F(1,390)>6.5, p<0.01; **F(1,390)>11.3, p<0.001 increase relative to Normal; #F(1,390) >6.4, p<0.01; ##F(1,390)>11.7, p<0.001 decrease relative to Normal.
IV. DISCUSSION
MIMO Extraction of Task-Specific Information
The above results provide evidence that hippocampal encoding of behaviorally relevant events can be facilitated online by employing a nonlinear MIMO model to extract ensemble firing patterns that occur on successful trials (Figures 2&3). The effectiveness of electrical stimulation distributed to the same locations in the same patterns (Figures 5&6) during similar task circumstances, supports the functional nature of the MIMO model extracted SR codes. Several recent investigations have reported relationships between multineuron firing in cortical ensembles and behavioral events [51-55] but few have attempted to substitute electrical stimulation for the correlated neuronal discharges [46;56-59] as performed here. Unlike other forms of effective brain stimulation [60-62], the beneficial effects to task performance demonstrated here required that electrical pulses be delivered in the same temporal sequence as the recorded nonlinear task-specific firing patterns of the same neural ensembles [16;17;20;28]. In addition, the lack of effect following several control procedures; i.e. online closed-loop control of performance (Figure 2), mimicking of strong SR code influence when delivered as electrical stimulation to the same regions (Figure 4), potentiation effects of repeated stimulation on a daily basis (Figures 5&6), strongly attests to the functional significance of SR code firing patterns extracted in real time by the MIMO model as critical for enhancing task performance.
Validation of MIMO Generated Stimulation Effects
The specificity of the MIMO stimulation patterns to enhance DNMS performance was determined by several control procedures reported previously [16], the most precise of which was to deliver stimulation patterns with the same intensities but scrambled (i.e. randomly assigned) model coefficients (Methods) which resulted in different stimulation patterns across the same electrode locations than that predicted by the MIMO model. The effects of scrambled MIMO stimulation did not improve DNMS performance which differed significantly from stimulation based on MIMO strong SR code patterns. As a final confirmation of pattern specificity of MIMO stimulation, the same highly effective strong SR code patterns were delivered 3.0-6.0 s after the SR in what constituted the delay interval of the trial and there was no effect on performance (Figure 5C). These specific control procedures validate the precise nature of the stimulation delivered and rule out other non-physiological explanations such as the presence of stimulation on some trials serving as a behavioral “cue” for correct encoding [63].
Correspondence of MIMO Detected Patterns to the Nature of Hippocampal Ensemble Coding of Task-Related Events
A major factor underlying the success of MIMO model detection of appropriate SR codes was the employment of the closed loop procedure to change the parameters of the DNMS task online as shown in Figure 2C&D and to extend this to delivering the effective pattern via electrical stimulation at the time of the SR (Figure 5). This procedure was subsequently used to demonstrate that repeated stimulation of this type leads to improved performance and sustained strong SR code generation when stimulation was terminated (Figures 6&7). These procedures illustrate the direct connection between the firing pattern of hippocampal neurons and successful encoding of task-relevant information. However, the fact that ensemble firing patterns can now be related to established characteristics of hippocampal cell types (Figures 3,4,7 and [36]) make the MIMO model an effective tool for understanding how hippocampus encodes information critical for retrieval and application at a future time-thereby providing a physiological basis for the type of memory processes that have been implicated in brain structures for centuries [7;64-66]. Linking the MIMO derived strong code patterns to the synchronous activation of appropriate hippocampal TT cells (Figures 6&7) makes the nature of the strong SR code decipherable in terms of associations across ensuing delays that normally impair retrieval of information because such synchronous firing was not robust or specific enough. The nature of FCT participation in SR code strengths shown in Figures 4&7 is clearly related to 1) the number of appropriate FCTs that fire and 2) the large percentage of appropriate TT cells that are active. In the case of weak SR codes the relationship is similar to the comparison shown in Figure 6 with fewer appropriate TT cells and less contribution from other FCTs (Figure 4C) compared to strong SR code trials (Figure 4B). This and the fact that strong SR code trials showed sensitivity to extended delays which did produce delay-dependent deficits (Figure 2D), and decayed over time when not provoked by closed-loop controlled MIMO stimulation (Figure 6), clearly implicates natural hippocampal FCT architecture (Figures 3C, 4 and 7) as the basis for successful memory encoding and retrieval in this short-term memory task.
Reconstruction of Successful Hippocampal Ensemble Firing: A Model for Cortical Prostheses
These demonstrations and previous results [16] provide a strong foundation for extending these procedures and principles to characterization of memory processing in a) other brain regions, b) different behavioral contexts, as well as c) situations requiring more complex cognitive processing [4;12;67-70]. It is clear that several aspects of the studies described here demonstrate the feasibility of the MIMO model for implementation in hippocampal as well as other types of cortical prostheses [56;71-74]. New results showing that repetition of MIMO model electrical stimulation patterns can enhance cognitive efficiency over time and can persist after stimulation is terminated suggests that cortical prostheses can be implemented in a manner consistent with ensemble information processing specific to the brain region the prosthesis is designed to replace. The fact that MIMO stimulation produced changes in hippocampal ensemble processing similar to that which evolves naturally with training on longer delay intervals (Figure 3D) validates the inherent nature of ensemble information retrieval as requiring task specific encoding by FCTs as shown in Figure 7. These studies provide the first evidence that such processes can be facilitated by repetitive MIMO stimulation which can detect when such activation will be the most effective in potentiating underlying synaptic processes to facilitate performance even when stimulation is not present (Figure 6). The fact that such changes in performance are accompanied by improved task-specific encoding in hippocampal ensembles not only provides a basis for future prosthetic devices, but also establishes principles by which memory encoding in neural systems can be characterized to gain further understanding of circumstances in which dementia is a major impairment.
ACKNOWLEDGEMENT
The authors appreciate the efforts of Michael Moran, Vernell Collins, Shahina Kozhisseri, Christina Dyson, Francis Miller, and Chad Collins.
This work was supported by The Defense Advanced Research Projects Agency (government contract N66601-09-C-2080 to S.A.D. and N66601-09-C-2081 to T.W.B.). The views, opinions, and/or findings contained in this article are those of the author and should not be interpreted as representing the official views or policies, either expressed or implied, of the Defense Advanced Research Projects Agency or the Department of Defense. This work was also supported in part by grants NSF EEC-0310723 to USC (T.W.B.), NIH/NIBIB grant No. P41-EB001978 to the Biomedical Simulations Resource at USC (V.Z.M. and T.W.B.) and NIH R01DA07625 (S.A.D.).
BIOGRAPHIES
Robert Hampson (M’09) is an associate professor at Wake Forest University School of Medicine in the Department of Physiology and Pharmacology. He received his Ph.D. degree from Wake Forest University in 1988 in physiology. His main interests are in learning and memory: in particular deciphering the neural code utilized by the hippocampus and other related structures to encode behavioral events and cognitive decisions. He has published extensively in the areas of cannabinoid effects on behavior and electrophysiology, and the correlation of behavior with multineuron activity patterns, particularly applying linear discriminant analysis to neural data to decipher population encoding and representation.
Dong Song (S’02-M’04) is a research assistant professor in the Department of Biomedical Engineering, University of Southern California. He received the B.S. degree in biophysics from the University of Science and Technology of China in 1994, and the Ph.D. degree in biomedical engineering from the University of Southern California in 2003. His research interests include nonlinear systems analysis, cortical neural prosthesis, electrophysiology of the hippocampus, and development of novel modeling techniques incorporating both parametric and nonparametric modeling methods. He is a member of the American Statistical Association, the Biomedical Engineering Society, and the Society for Neuroscience.
Rosa H. M. Chan received B.Eng (1st Hon.) degree in Automation and Computer-Aided Engineering from the Chinese University of Hong Kong in 2003. She was later awarded the Croucher Scholarship and Sir Edward Youde Memorial Fellowship for Overseas Studies in 2004. She received her Ph.D. degree in Biomedical Engineering in 2011 at University of Southern California, where she received her M.S. degrees in Biomedical Engineering, Electrical Engineering, and Aerospace Engineering. Dr. Chan is currently an Assistant Professor in the Department of Electronic Engineering at City University of Hong Kong. Her research interests include computational neuroscience and development of neural prosthesis.

Andrew J. Sweatt is an assistant professor in the Department of Physiology & Pharmacology at Wake Forest University School of Medicine. He earned the B.A. degree in Natural Sciences from the Johns Hopkins University in 1974, the M.S. degree in Biological Oceanography from the University Of Rhode Island in 1978, and the Ph.D. degree in Zoology from Duke University in 1983. His published work has been in the areas of retinal, corneal, and neural cell biology, with recent focus on brain amino acid metabolism. Current interests are in cellular mechanisms underlying the role of the hippocampus in short-term memory.
Mitchell R. Riley is a graduate student in the Neuroscience Program at Wake Forest University School of Medicine. He received his Bachelor of Science degree in Athletic Training/Sports Medicine from Appalachian State University in 2009 and is currently working toward the Ph.D. in Neuroscience. His research interests include learning, memory, and cognitive decline, with a focus on translational models. He is a member of the Society for Neuroscience and has presented work on pharmacological modulation of hippocampal function at the Society’s annual meeting.

Anushka V. Goonawardena received his B.S. Ph.D. in Biomedical Science from the University of Aberdeen (Scotland, U.K.) in 2004 and 2009, respectively. The majority of work on his doctorate as well as his postdoctoral fellowship (2009-2011) was performed in the laboratories of Dr. Robert Hampson and Dr. Sam Deadwyler of Wake Forest School of Medicine in Winston-Salem, NC. His interests are in hippocampal neurophysiological mechanisms of learning and memory, effects of drugs of abuse on memory and pharmacological modulation of sleep cycle. He is currently a Research Associate with Stanford Research Institute..
Gregory A. Gerhardt received his Ph.D. in chemistry in 1983 from the University of Kansas. He received postdoctoral training in pharmacology, neuroscience, and psychiatry at the University of Colorado Health Sciences Center in Denver from 1983-1985. He is currently a professor in the Anatomy and Neurobiology, Neurology, and Psychiatry departments at the University of Kentucky (UK) Chandler Medical Center, Lexington, Kentucky. He is the director of the Morris K. Udall Parkinson’s Disease Research Center of Excellence and director of the Center for Sensor Technology (CenSeT), both at UK. He is also the editor in chief, Americas and Australasia, of the Journal of Neuroscience Methods. His laboratory develops microelectrode recording methods to study dynamics of neurotransmitter release in the CNS and develop neuronal interface devices.
Vasilis Z. Marmarelis received his PhD in Engineering Science from Caltech in 1976. He is Professor of Biomedical Engineering at USC and co-Director of the Biomedical Simulations Resource, a research center funded by NIH since 1985. He served as Department Chairman from 1990 to 1996. His research interests are: (1) dynamic nonlinear modeling of biomedical systems; (2) neural information processing; (3) modeling of physiological autoregulation; (4) multimodal ultrasound tomography for diagnostic imaging. He recently authored the monograph “Nonlinear Dynamic Modeling of Physiological Systems” and has published more than 100 journal papers and book chapters. He is a Fellow of AIMBE and IEEE.

Theodore W. Berger (SM’05-F’10) holds the David Packard Chair of Engineering in the Viterbi School of Engineering at the University of Southern California. He is a Professor of Biomedical Engineering and Neuroscience, and Director of the Center for Neural Engineering. Dr. Berger received his Ph.D. from Harvard University in 1976; conducted postdoctoral research at the University of California, Irvine from 1977-1978, at The Salk Institute from 1978-1979, and joined the Departments of Psychology (later the Department of Neuroscience) and Psychiatry at the University of Pittsburgh in 1979. Dr. Berger has published over 200 journal articles and book chapters, and over 100 refereed conference proceedings papers. He is the co-editor of a book published by the MIT Press on Toward Replacement Parts for the Brain: Implantable Biomimetic Electronics as Neural Prostheses.
Samuel A. Deadwyler (M’09) is a professor and former Vice Chair (1989-2005) in the Department of Physiology and Pharmacology, Wake Forest University School of Medicine (WFUSM) where he has been since 1978. He has been funded by the National Institutes of Health (NIH) continuously since 1974, recipient of a NIH Senior Research Scientist award from 1987-2008 and a MERIT award from 1990-2000. He has published extensively in the area of neural mechanisms of learning and memory. His current research interests include mechanisms of information encoding in hippocampus and frontal cortex also funded by DARPA to design and implement neural prostheses in primate brain.
Contributor Information
Robert E. Hampson, Department of Physiology of Wake Forest School of Medicine, Winston-Salem, NC 27157.
Dong Song, Department of Biomedical Engineering, Viterbi School of Engineering, and the Biomedical Simulations Resource, University of Southern California, Los Angeles, CA USA ( berger@bmsrs.usc.edu)..
Rosa H.M. Chan, Department of Biomedical Engineering, Viterbi School of Engineering, and the Biomedical Simulations Resource, University of Southern California, Los Angeles, CA USA ( berger@bmsrs.usc.edu)..
Andrew J. Sweatt, Department of Physiology of Wake Forest School of Medicine, Winston-Salem, NC 27157
Mitchell R. Riley, Department of Physiology of Wake Forest School of Medicine, Winston-Salem, NC 27157
Anushka V. Goonawardena, Department of Physiology of Wake Forest School of Medicine, Winston-Salem, NC 27157
Vasilis Z. Marmarelis, Department of Biomedical Engineering, Viterbi School of Engineering, and the Biomedical Simulations Resource, University of Southern California, Los Angeles, CA USA ( berger@bmsrs.usc.edu)..
Greg A. Gerhardt, Center for Microelectrode Technology, University of Kentucky, Lexington, KY, USA ( gregg@uky.edu).
Theodore W. Berger, Department of Biomedical Engineering, Viterbi School of Engineering, and the Biomedical Simulations Resource, University of Southern California, Los Angeles, CA USA ( berger@bmsrs.usc.edu)..
Sam A. Deadwyler, Department of Physiology of Wake Forest School of Medicine, Winston-Salem, NC 27157.
REFERENCES
- [1].Zierhut K, Bogerts B, Schott B, Fenker D, Walter M, Albrecht D, Steiner J, Schutze H, Northoff G, Duzel E, Schiltz K. The role of hippocampus dysfunction in deficient memory encoding and positive symptoms in schizophrenia. Psychiatry Res. 2010 Sep;183:187–194. doi: 10.1016/j.pscychresns.2010.03.007. [DOI] [PubMed] [Google Scholar]
- [2].Broome BM, Jayaraman V, Laurent G. Encoding and decoding of overlapping odor sequences. Neuron. 2006 Aug;51:467–482. doi: 10.1016/j.neuron.2006.07.018. [DOI] [PubMed] [Google Scholar]
- [3].Davachi L. Item, context and relational episodic encoding in humans. Curr. Opin. Neurobiol. 2006 Dec;16:693–700. doi: 10.1016/j.conb.2006.10.012. [DOI] [PubMed] [Google Scholar]
- [4].Eichenbaum H, Fortin NJ. The neurobiology of memory based predictions. Philos. Trans. R. Soc. Lond B Biol. Sci. 2009 May;364:1183–1191. doi: 10.1098/rstb.2008.0306. [DOI] [PMC free article] [PubMed] [Google Scholar]
- [5].Fenton AA, Kao HY, Neymotin SA, Olypher A, Vayntrub Y, Lytton WW, Ludvig N. Unmasking the CA1 ensemble place code by exposures to small and large environments: more place cells and multiple, irregularly arranged, and expanded place fields in the larger space. J. Neurosci. 2008 Oct;28:11250–11262. doi: 10.1523/JNEUROSCI.2862-08.2008. [DOI] [PMC free article] [PubMed] [Google Scholar]
- [6].Leutgeb S, Leutgeb JK, Moser EI, Moser MB. Fast rate coding in hippocampal CA3 cell ensembles. Hippocampus. 2006;16:765–774. doi: 10.1002/hipo.20201. [DOI] [PubMed] [Google Scholar]
- [7].Duncan K, Curtis C, Davachi L. Distinct memory signatures in the hippocampus: intentional States distinguish match and mismatch enhancement signals. J. Neurosci. 2009 Jan;29:131–139. doi: 10.1523/JNEUROSCI.2998-08.2009. [DOI] [PMC free article] [PubMed] [Google Scholar]
- [8].Isaac JT, Buchanan KA, Muller RU, Mellor JR. Hippocampal place cell firing patterns can induce long-term synaptic plasticity in vitro. J. Neurosci. 2009 May;29:6840–6850. doi: 10.1523/JNEUROSCI.0731-09.2009. [DOI] [PMC free article] [PubMed] [Google Scholar]
- [9].Eichenbaum H, Yonelinas AP, Ranganath C. The medial temporal lobe and recognition memory. Annu. Rev. Neurosci. 2007;30:123–152. doi: 10.1146/annurev.neuro.30.051606.094328. [DOI] [PMC free article] [PubMed] [Google Scholar]
- [10].Klausberger T, Somogyi P. Neuronal diversity and temporal dynamics: the unity of hippocampal circuit operations. Science. 2008 Jul;321:53–57. doi: 10.1126/science.1149381. [DOI] [PMC free article] [PubMed] [Google Scholar]
- [11].Manns JR, Eichenbaum H. Evolution of declarative memory. Hippocampus. 2006;16:795–808. doi: 10.1002/hipo.20205. [DOI] [PubMed] [Google Scholar]
- [12].Romero-Granados R, Fontan-Lozano A, Delgado-Garcia JM, Carrion AM. From learning to forgetting: behavioral, circuitry, and molecular properties define the different functional states of the recognition memory trace. Hippocampus. 2010 May;20:584–595. doi: 10.1002/hipo.20669. [DOI] [PubMed] [Google Scholar]
- [13].Nakashiba T, Buhl DL, McHugh TJ, Tonegawa S. Hippocampal CA3 output is crucial for ripple-associated reactivation and consolidation of memory. Neuron. 2009 Jun;62:781–787. doi: 10.1016/j.neuron.2009.05.013. [DOI] [PMC free article] [PubMed] [Google Scholar]
- [14].Lebedev MA, O’Doherty JE, Nicolelis MA. Decoding of temporal intervals from cortical ensemble activity. J. Neurophysiol. 2008 Jan;99:166–186. doi: 10.1152/jn.00734.2007. [DOI] [PubMed] [Google Scholar]
- [15].Ross RS, Eichenbaum H. Dynamics of hippocampal and cortical activation during consolidation of a nonspatial memory. J. Neurosci. 2006 May;26:4852–4859. doi: 10.1523/JNEUROSCI.0659-06.2006. [DOI] [PMC free article] [PubMed] [Google Scholar]
- [16].Berger TW, Hampson RE, Song D, Goonawardena A, Marmarelis VZ, Deadwyler SA. A cortical neural prosthesis for restoring and enhancing memory. Journal of Neural Engineering. 2011 doi: 10.1088/1741-2560/8/4/046017. [DOI] [PMC free article] [PubMed] [Google Scholar]
- [17].Song D, Chan RH, Marmarelis VZ, Hampson RE, Deadwyler SA, Berger TW. Nonlinear dynamic modeling of spike train transformations for hippocampal-cortical prostheses. IEEE Trans. Biomed. Eng. 2007 Jun;54:1053–1066. doi: 10.1109/TBME.2007.891948. [DOI] [PubMed] [Google Scholar]
- [18].Song D, Chan RH, Marmarelis VZ, Hampson RE, Deadwyler SA, Berger TW. Nonlinear modeling of neural population dynamics for hippocampal prostheses. Neural Netw. 2009 Nov;22:1340–1351. doi: 10.1016/j.neunet.2009.05.004. [DOI] [PMC free article] [PubMed] [Google Scholar]
- [19].Kesner RP, Hunsaker MR, Warthen MW. The CA3 subregion of the hippocampus is critical for episodic memory processing by means of relational encoding in rats. Behav. Neurosci. 2008 Dec;122:1217–1225. doi: 10.1037/a0013592. [DOI] [PubMed] [Google Scholar]
- [20].Hampson RE, Song D, Chan RHM, Sweatt AJ, Fuqua J, Gerhardt GA, Shin D, Marmarelis VZ, Berger TW, Deadwyler SA. A nonlinear model for hippocampal cognitive prostheses: Memory facilitation by hippocampal ensemble stimulation. IEEE Transactions on Neural Systems and Rehabilitation Engineering. 2012 doi: 10.1109/TNSRE.2012.2189163. [DOI] [PMC free article] [PubMed] [Google Scholar]
- [21].Deadwyler SA, Hampson RE. Temporal coupling between subicular and hippocampal neurons underlies retention of trial-specific events. Behav. Brain Res. 2006 Nov;174:272–280. doi: 10.1016/j.bbr.2006.05.038. [DOI] [PubMed] [Google Scholar]
- [22].Deadwyler SA, Hampson RE. Differential but complementary mnemonic functions of the hippocampus and subiculum. Neuron. 2004;42:465–476. doi: 10.1016/s0896-6273(04)00195-3. [DOI] [PubMed] [Google Scholar]
- [23].Paxinos G, Watson C. The Rat Brain in Stereotaxic Coordinates. 3 ed. Academic Press; San Diego: 1997. [DOI] [PubMed] [Google Scholar]
- [24].Deadwyler SA, Goonawardena AV, Hampson RE. Short-term memory is modulated by the spontaneous release of endocannabinoids: evidence from hippocampal population codes. Behav. Pharmacol. 2007 Sep;18(5-6):571–580. doi: 10.1097/FBP.0b013e3282ee2adb. [DOI] [PubMed] [Google Scholar]
- [25].Hampson RE, Simeral JD, Deadwyler SA. Distribution of Spatial and Nonspatial Information in Dorsal Hippocampus. Nature. 1999;402:610–614. doi: 10.1038/45154. [DOI] [PubMed] [Google Scholar]
- [26].Goonawardena AV, Robinson L, Riedel G, Hampson RE. Recruitment of hippocampal neurons to encode behavioral events in the rat: Alterations in cognitive demand and cannabinoid exposure. Hippocampus. 2010 Sep;20:1083–1094. doi: 10.1002/hipo.20706. [DOI] [PMC free article] [PubMed] [Google Scholar]
- [27].Zanos TP, Hampson RE, Deadwyler SE, Berger TW, Marmarelis VZ. Boolean modeling of neural systems with point-process inputs and outputs. Part II: Application to the rat hippocampus. Ann. Biomed. Eng. 2009 Aug;37:1668–1682. doi: 10.1007/s10439-009-9716-z. [DOI] [PMC free article] [PubMed] [Google Scholar]
- [28].Zanos TP, Courellis SH, Berger TW, Hampson RE, Deadwyler SA, Marmarelis VZ. Nonlinear modeling of causal interrelationships in neuronal ensembles. IEEE Trans. Neural Syst. Rehabil. Eng. 2008 Aug;16:336–352. doi: 10.1109/TNSRE.2008.926716. [DOI] [PMC free article] [PubMed] [Google Scholar]
- [29].Marmarelis VZ. Identification of nonlinear biological systems using Laguerre expansions of kernels. Ann. Biomed. Eng. 1993 Nov;21:573–589. doi: 10.1007/BF02368639. [DOI] [PubMed] [Google Scholar]
- [30].Truccolo W, Eden UT, Fellows MR, Donoghue JP, Brown EN. A point process framework for relating neural spiking activity to spiking history, neural ensemble, and extrinsic covariate effects. J. Neurophysiol. 2005 Feb;93:1074–1089. doi: 10.1152/jn.00697.2004. [DOI] [PubMed] [Google Scholar]
- [31].Brown EN, Barbieri R, Ventura V, Kass RE, Frank LM. The time-rescaling theorem and its application to neural spike train data analysis. Neural Comput. 2002 Feb;14:325–346. doi: 10.1162/08997660252741149. [DOI] [PubMed] [Google Scholar]
- [32].Marmarelis VZ, Zhao X. On the relation between Volterra models and feedforward artificial neural networks. In: Marmarelis VZ, editor. Advanced Methods of Physiological System Modeling. III. Plenum; New York: 1994. pp. 243–259. [Google Scholar]
- [33].Song D, Chan RH, Marmarelis VZ, Hampson RE, Deadwyler SA, Berger TW. Statistical selection of multiple-input multiple-output nonlinear dynamic models of spike train transformation. Conf. Proc. IEEE Eng Med. Biol. Soc. 2007;2007:4727–4730. doi: 10.1109/IEMBS.2007.4353395. [DOI] [PubMed] [Google Scholar]
- [34].Zanos TP, Courellis SH, Hampson RE, Deadwyler SA, Marmarelis VZ, Berger TW. A multi-input modeling approach to quantify hippocampal nonlinear dynamic transformations. Conf. Proc. IEEE Eng Med. Biol. Soc. 2006;1:4967–4970. doi: 10.1109/IEMBS.2006.260575. [DOI] [PubMed] [Google Scholar]
- [35].Hampson RE, Deadwyler SA. Cannabinoids reveal the necessity of hippocampal neural encoding for short-term memory in rats. J. Neurosci. 2000 Dec;20(23):8932–8942. doi: 10.1523/JNEUROSCI.20-23-08932.2000. [DOI] [PMC free article] [PubMed] [Google Scholar]
- [36].Hampson RE, Simeral JD, Berger TW, Song D, Chan RHM, Deadwyler SA. Cognitively relevant recording in hippocampus: Beneficial feedback of ensemble codes in a closed loop paradigm. In: Vertes RP, Stackman RW, editors. Electrophysiological Recording Techniques. Humana Press; New York: 2011. pp. 215–240. [Google Scholar]
- [37].Simeral JD, Hampson RE, Deadwyler SA. Behaviorally relevant neural codes in hippocampal ensembles: Detection on single trials. In: Baudry M, Bi X, Schreiber S, editors. Synaptic Plasticity: From Basic Mechanisms to Clinical Applications. MIT Press; Cambridge, MA: 2005. pp. 459–476. [Google Scholar]
- [38].Hampson RE, Deadwyler SA. Pitfalls and problems in the analysis of neuronal ensemble recordings during performance of a behavioral task. In: Nicolelis M, editor. Methods for Simultaneous Neuronal Ensemble Recordings. Academic Press; New York: 1999. pp. 229–248. [Google Scholar]
- [39].Deadwyler SA, Hampson RE. Endocannabinoids modulate encoding of sequential memory in the rat hippocampus. Psychopharmacology (Berl) 2008 Jan;198:577–586. doi: 10.1007/s00213-007-1055-x. [DOI] [PMC free article] [PubMed] [Google Scholar]
- [40].Marmarelis VZ, Orme ME. Modeling of neural systems by use of neuronal modes. IEEE Trans. Biomed. Eng. 1993 Nov;40:1149–1158. doi: 10.1109/10.245633. [DOI] [PubMed] [Google Scholar]
- [41].Wessberg J, Stambaugh CR, Kralik JD, Beck PD, Laubach M, Chapin JK, Kim J, Biggs SJ, Srinivasan MA, Nicolelis MA. Real-time prediction of hand trajectory by ensembles of cortical neurons in primates. Nature. 2000 Nov;408:361–365. doi: 10.1038/35042582. [DOI] [PubMed] [Google Scholar]
- [42].Wixted JT. Dual-process theory and signal-detection theory of recognition memory. Psychol. Rev. 2007 Jan;114:152–176. doi: 10.1037/0033-295X.114.1.152. [DOI] [PubMed] [Google Scholar]
- [43].Reynolds JR, Donaldson DI, Wagner AD, Braver TS. Item- and task-level processes in the left inferior prefrontal cortex: positive and negative correlates of encoding. Neuroimage. 2004 Apr;21:1472–1483. doi: 10.1016/j.neuroimage.2003.10.033. [DOI] [PubMed] [Google Scholar]
- [44].Shrager Y, Kirwan CB, Squire LR. Activity in both hippocampus and perirhinal cortex predicts the memory strength of subsequently remembered information. Neuron. 2008 Aug;59:547–553. doi: 10.1016/j.neuron.2008.07.022. [DOI] [PMC free article] [PubMed] [Google Scholar]
- [45].Chapin JK. Using multi-neuron population recordings for neural prosthetics. Nat. Neurosci. 2004 May;7:452–455. doi: 10.1038/nn1234. [DOI] [PubMed] [Google Scholar]
- [46].Moritz CT, Perlmutter SI, Fetz EE. Direct control of paralysed muscles by cortical neurons. Nature. 2008 Dec;456:639–642. doi: 10.1038/nature07418. [DOI] [PMC free article] [PubMed] [Google Scholar]
- [47].Deadwyler SA. Evoked potentials in the hippocampus and learning. In: Adelman G, editor. Encyclopedia of Neuroscience. Birkhauser; Boston, MA: 1987. pp. 411–412. [Google Scholar]
- [48].Frank LM, Brown EN, Stanley GB. Hippocampal and cortical place cell plasticity: implications for episodic memory. Hippocampus. 2006;16:775–784. doi: 10.1002/hipo.20200. [DOI] [PubMed] [Google Scholar]
- [49].Morris RG. Elements of a neurobiological theory of hippocampal function: the role of synaptic plasticity, synaptic tagging and schemas. Eur. J. Neurosci. 2006 Jun;23:2829–2846. doi: 10.1111/j.1460-9568.2006.04888.x. [DOI] [PubMed] [Google Scholar]
- [50].Buzsaki G, Chrobak JJ. Synaptic plasticity and self-organization in the hippocampus. Nat. Neurosci. 2005 Nov;8:1418–1420. doi: 10.1038/nn1105-1418. [DOI] [PubMed] [Google Scholar]
- [51].Hargreaves EL, Yoganarasimha D, Knierim JJ. Cohesiveness of spatial and directional representations recorded from neural ensembles in the anterior thalamus, parasubiculum, medial entorhinal cortex, and hippocampus. Hippocampus. 2007;17:826–841. doi: 10.1002/hipo.20316. [DOI] [PubMed] [Google Scholar]
- [52].Durstewitz D, Vittoz NM, Floresco SB, Seamans JK. Abrupt transitions between prefrontal neural ensemble states accompany behavioral transitions during rule learning. Neuron. 2010 May;66:438–448. doi: 10.1016/j.neuron.2010.03.029. [DOI] [PubMed] [Google Scholar]
- [53].Lee E, Oliveira-Ferreira AI, de WE, Gerritsen H, Bakker MC, Kalwij JA, van GT, Buster WH, Pennartz CM. Ensemble recordings in awake rats: achieving behavioral regularity during multimodal stimulus processing and discriminative learning. J. Exp. Anal. Behav. 2009 Jul;92:113–129. doi: 10.1901/jeab.2009.92-113. [DOI] [PMC free article] [PubMed] [Google Scholar]
- [54].Ganguly K, Carmena JM. Emergence of a stable cortical map for neuroprosthetic control. PLoS. Biol. 2009 Jul;7:e1000153. doi: 10.1371/journal.pbio.1000153. [DOI] [PMC free article] [PubMed] [Google Scholar]
- [55].Howard JD, Plailly J, Grueschow M, Haynes JD, Gottfried JA. Odor quality coding and categorization in human posterior piriform cortex. Nat. Neurosci. 2009 Jul;12:932–938. doi: 10.1038/nn.2324. [DOI] [PMC free article] [PubMed] [Google Scholar]
- [56].Rebesco JM, Miller LE. Stimulus-driven changes in sensorimotor behavior and neuronal functional connectivity application to brain-machine interfaces and neurorehabilitation. Prog. Brain Res. 2011;192:83–102. doi: 10.1016/B978-0-444-53355-5.00006-3. [DOI] [PubMed] [Google Scholar]
- [57].Rigosa J, Weber DJ, Prochazka A, Stein RB, Micera S. Neuro-fuzzy decoding of sensory information from ensembles of simultaneously recorded dorsal root ganglion neurons for functional electrical stimulation applications. J. Neural Eng. 2011 Aug;8:046019. doi: 10.1088/1741-2560/8/4/046019. [DOI] [PubMed] [Google Scholar]
- [58].Itskov PM, Vinnik E, Diamond ME. Hippocampal representation of touch-guided behavior in rats: persistent and independent traces of stimulus and reward location. PLoS. One. 2011;6:e16462. doi: 10.1371/journal.pone.0016462. [DOI] [PMC free article] [PubMed] [Google Scholar]
- [59].Murphey DK, Maunsell JH. Electrical microstimulation thresholds for behavioral detection and saccades in monkey frontal eye fields. Proc. Natl. Acad. Sci. U. S. A. 2008 May;105:7315–7320. doi: 10.1073/pnas.0710820105. [DOI] [PMC free article] [PubMed] [Google Scholar]
- [60].Falowski SM, Sharan A, Reyes BA, Sikkema C, Szot P, Van EJ. Bockstaele, “An Evaluation of Neuroplasticity and Behavior Following Deep Brain Stimulation of the Nucleus Accumbens in an Animal Model of Depression. Neurosurgery. 2011 May; doi: 10.1227/NEU.0b013e3182237346. [DOI] [PMC free article] [PubMed] [Google Scholar]
- [61].Gale JT, Martinez-Rubio C, Sheth SA, Eskandar EN. Intra-operative behavioral tasks in awake humans undergoing deep brain stimulation surgery. J. Vis. Exp. 2011 doi: 10.3791/2156. [DOI] [PMC free article] [PubMed] [Google Scholar]
- [62].Lega BC, Halpern CH, Jaggi JL, Baltuch GH. Deep Brain Stimulation in the Treatment of Refractory Epilepsy: Update on Current Data and Future Directions. Neurobiol. Dis. 2009 Jul; doi: 10.1016/j.nbd.2009.07.007. [DOI] [PubMed] [Google Scholar]
- [63].Cavanaugh J, Alvarez BD, Wurtz RH. Enhanced performance with brain stimulation: attentional shift or visual cue? J. Neurosci. 2006 Nov;26:11347–11358. doi: 10.1523/JNEUROSCI.2376-06.2006. [DOI] [PMC free article] [PubMed] [Google Scholar]
- [64].Churchwell JC, Morris AM, Musso ND, Kesner RP. Prefrontal and hippocampal contributions to encoding and retrieval of spatial memory. Neurobiol. Learn. Mem. 2010 Mar;93:415–421. doi: 10.1016/j.nlm.2009.12.008. [DOI] [PubMed] [Google Scholar]
- [65].Lipton PA, Eichenbaum H. Complementary roles of hippocampus and medial entorhinal cortex in episodic memory. Neural Plast. 2008;2008:258467. doi: 10.1155/2008/258467. [DOI] [PMC free article] [PubMed] [Google Scholar]
- [66].Ross RS, Slotnick SD. The hippocampus is preferentially associated with memory for spatial context. J. Cogn Neurosci. 2008 Mar;20:432–446. doi: 10.1162/jocn.2008.20035. [DOI] [PubMed] [Google Scholar]
- [67].Machens CK, Romo R, Brody CD. Functional, but not anatomical, separation of “what” and “when” in prefrontal cortex. J. Neurosci. 2010 Jan;30:350–360. doi: 10.1523/JNEUROSCI.3276-09.2010. [DOI] [PMC free article] [PubMed] [Google Scholar]
- [68].Boettiger CA, D’Esposito M. Frontal networks for learning and executing arbitrary stimulus-response associations. J. Neurosci. 2005 Mar;25:2723–2732. doi: 10.1523/JNEUROSCI.3697-04.2005. [DOI] [PMC free article] [PubMed] [Google Scholar]
- [69].Narayanan NS, Laubach M. Methods for studying functional interactions among neuronal populations. Methods Mol. Biol. 2009;489:135–165. doi: 10.1007/978-1-59745-543-5_7. [DOI] [PMC free article] [PubMed] [Google Scholar]
- [70].Paz R, Vaadia E. Learning-induced improvement in encoding and decoding of specific movement directions by neurons in the primary motor cortex. PLoS. Biol. 2004 Feb;2:E45. doi: 10.1371/journal.pbio.0020045. [DOI] [PMC free article] [PubMed] [Google Scholar]
- [71].Hwang EJ, Andersen RA. Cognitively driven brain machine control using neural signals in the parietal reach region. Conf. Proc. IEEE Eng Med. Biol. Soc. 2010;2010:3329–3332. doi: 10.1109/IEMBS.2010.5627277. [DOI] [PubMed] [Google Scholar]
- [72].Aggarwal V, Tenore F, Acharya S, Schieber MH, Thakor NV. Cortical decoding of individual finger and wrist kinematics for an upper-limb neuroprosthesis. Conf. Proc. IEEE Eng Med. Biol. Soc. 2009;2009:4535–4538. doi: 10.1109/IEMBS.2009.5334129. [DOI] [PMC free article] [PubMed] [Google Scholar]
- [73].Marzullo TC, Lehmkuhle MJ, Gage GJ, Kipke DR. Development of closed-loop neural interface technology in a rat model: combining motor cortex operant conditioning with visual cortex microstimulation. IEEE Trans. Neural Syst. Rehabil. Eng. 2010 Apr;18:117–126. doi: 10.1109/TNSRE.2010.2041363. [DOI] [PMC free article] [PubMed] [Google Scholar]
- [74].Ganguly K, Carmena JM. Emergence of a stable cortical map for neuroprosthetic control. PLoS. Biol. 2009 Jul;7:e1000153. doi: 10.1371/journal.pbio.1000153. [DOI] [PMC free article] [PubMed] [Google Scholar]


