

Abstract
Context
The Star Excursion Balance Test (SEBT) is a widely accepted method of assessing dynamic postural stability. The Y Balance Test (YBT) is a commercially available device for measuring balance that uses 3 (anterior, posteromedial, and posterolateral) of the 8 SEBT directions and has been advocated as a method for assessing dynamic balance. To date, no studies have compared reach performance in these tests in a healthy population.
Objective
To determine whether any differences exist between reach distance performance for the anterior, posteromedial, and posterolateral directions of the SEBT and the YBT.
Design
Descriptive laboratory study.
Setting
University motion analysis laboratory.
Patients or Other Participants
A total of 20 healthy active male participants (age = 22.50 ± 3.05 years, height = 1.78 ± 0.82 m, weight = 79.48 ± 11.32 kg, body mass index = 24.96 ± 2.56 kg/m2).
Intervention(s)
Participants carried out 3 trials in each reach direction on each leg on the SEBT and the YBT a minimum of 1 week apart.
Main Outcome Measure(s)
The means of the 3 trials in each direction on each leg on both tests were calculated. Data were collected after 4 practice trials in each direction. Paired t tests and Bland-Altman plots were used to compare reach distances between the SEBT and the YBT.
Results
Participants reached farther in the anterior direction on the SEBT than on the YBT. No differences were observed in the posteromedial and posterolateral directions.
Conclusions
Differing postural-control strategies may be used to complete these tasks. This finding has implications for the implementation and interpretation of these dynamic balance tests.
Key Words: postural stability, balance, assessment, rehabilitation
Key Points
Differences in anterior reach distance were noted between the Star Excursion Balance Test and the Y Balance Test in a sample of healthy, active men.
No differences were noted in posteromedial or posterolateral reach distances between the tests.
Postural-control strategies for completing these tests may vary.
The perception and execution of musculoskeletal control and movement are mediated primarily by the central nervous system1 and involve the integration of 3 main subsystems: somatosensory, vestibular, and visual.2 Balance performance and its measurement are influenced by these subsystems. The Star Excursion Balance Test (SEBT) is a valid and reliable outcome measure of dynamic balance developed by Gray.3 A range of indications for the clinical use of the test in athletic and pathologic populations has previously been described, including screening,4,5 injury identification,6,7 training,8–10 and rehabilitation.11 Most of the literature describes 8 reach directions using a grid formed by applying adhesive athletic tape or a tape measure to a level floor with lines spaced 45° apart. The directions are anterior (A), medial, lateral, posterior, anteromedial, anterolateral, posteromedial (PM), and posterolateral (PL). An individual is required to move from a starting position of 2-legged stance to single-legged stance while maximally reaching along set multidirectional lines with the opposite leg and touching down lightly on the tape with the distal end of the reach foot, without compromising equilibrium. These reaching tasks are designed to challenge postural control, strength, range of motion, and proprioceptive abilities.12
A number of limitations are associated with the SEBT owing to the lack of a definitive published protocol outlining its administration. The touch-down aspect of the test allows for the individual to be supported by the ground, and the actual amount of pressure allowed through the foot is difficult to quantify and control. This may lead to variations in the administration and interpretation of the test protocol. In addition, for the test to be carried out in its entirety (4 practice trials and 3 test trials in each of the 8 directions on each side, giving a total of 112 reach excursions)13 can prove time consuming for the clinician. Hertel et al12 were the first to propose redundancy in measuring all 8 directions in a sample with chronic ankle instability and purported the use of the A, medial, and PM directions in identifying functional deficits. The clinical application of the SEBT led to the development of the Y Balance Test (YBT). Plisky et al14 used a Y or “peace sign,” incorporating the A, PM, and PL directions in the preseason screening of high school basketball players, which in turn led to the development of the YBT. It involves the individual standing on an elevated central plastic footplate 1 in (2.54 cm) off the ground and pushing a rectangular reach indicator block with the foot along a 1.5-m length of plastic tubing in each of the 3 directions. The reach distance is recorded as the point at which the reach indicator block is pushed closest to the stance leg. The purported benefits of the YBT are that it takes less time to complete and has a standard protocol and high interrater (0.99–1.00) and intrarater reliability (0.85–0.91).15
Both the SEBT and YBT involve similar movements that are deemed to measure and challenge dynamic balance. Despite the similarity between the tests, no researchers to date have evaluated performance in both tests in the same group of participants. The increasing popularity of the YBT in the clinical setting for diagnosis, screening, and rehabilitation means that it is imperative to establish if any differences exist in its application and performance when compared with performance on the similar reach directions of the SEBT. Therefore, the purpose of our study was to compare the A, PM, and PL reach distance performance of healthy participants in these 2 dynamic balance tests. We hypothesized that participants would attain the same reach distance in the respective directions of the SEBT and YBT.
METHODS
Participants
Ethical approval was obtained from the University College Dublin Human Research Ethics Committee. We recruited 20 healthy male participants (age = 22.50 ± 3.05 years, height = 1.78 ± 0.82 m, weight = 79.48 ± 11.32 kg, body mass index = 24.96 ± 2.56 kg/m2) from the local university population. Inclusion criteria for the study required volunteers to be between 18 and 30 years of age and active participants in sporting activity 3 or more times per week with no history of lower limb injury in the past 3 months, neurologic or balance disorder, or lower limb fracture. Before formal testing began, each participant read an information leaflet and signed a consent form.
Protocol
Participants reported to the laboratory in shorts and T-shirts for 2 test sessions spaced a minimum of 7 days apart. Their height, weight, and limb length in supine lying (anterosuperior iliac spine to the center of the ipsilateral medial malleolus) were measured. They were then randomized to conduct either the SEBT or YBT at the initial session and undertook the other test at the second session. The SEBT reach directions were evaluated by affixing 3 tape measures to the laboratory floor, 1 oriented anterior to the apex and 2 aligned at 135° to this in the PM and PL directions (Figure 1).16 The YBT was evaluated using a commercially available device (Y Balance Test, Move2Perform, Evansville, IN; Figure 2). In order to ensure comparison between the tests, the A, PM, and PL directions of the SEBT were used. Order of the test leg and direction were also randomized at each test session. All testing was conducted barefoot to eliminate additional balance and stability from the shoes.17 As in the YBT, the anterior borders of the participant's feet were placed at the convergence of the reach direction lines of the SEBT at the second toe. The test was demonstrated by a member of the research team before the participant completed 4 practice trials in each direction on each leg. Completing these practice trials has previously been reported to decrease the learning effect without hindering an individual's ability to perform the test.13 After the test trials were completed, each participant was given a 2-minute rest period and then conducted 3 test trials in each direction. Test sessions were undertaken at the same time of day to minimize diurnal variation in postural stability.18 A trial was classified as invalid if the participant removed his hands from his hips, did not return to the starting position, applied sufficient weight through the reach foot so as to gain an increase in reach distance (SEBT), placed the reach foot on the ground on either side of the line or tube, raised or moved the stance foot during the test, or kicked the plate with the reach foot to gain more distance (YBT). If an invalid trial occurred, the data were discarded, and the participant repeated the trial.
Figure 1.

Star Excursion Balance Test anterior reach direction.
Figure 2.

Y Balance Test anterior reach direction.
Statistical Analysis
Reach distances were normalized to limb length by calculating the maximized reach distance (%MAXD) using the formula (excursion distance/limb length) × 100 = % MAXD.13 This normalization method accounts for limb-length differences in individuals and allows comparisons between the right and left limbs and between participants. Means and standard deviations were calculated for both legs. Paired-samples t tests were conducted to compare the reach distances for each leg and between tests (version 18.0; PASW Statistics, IBM Corporation, Armonk, NY). Because 6 t tests were calculated, a Bonferroni correction was used (0.05/12), and therefore, an α level of P < .004 was set for all comparisons. Effect sizes for test differences were calculated by obtaining the difference between mean SEBT and YBT values and dividing by the pooled standard deviation. The strength of the effect sizes was interpreted using guidelines described by Cohen,19 with values less than 0.2 interpreted as weak, 0.21 to 0.79 as moderate, and greater than 0.8 as strong. Pearson correlations and Bland-Altman assessments for agreement were used to compare SEBT and YBT performance.20 Where heteroscedasticity (increasing differences with increasing mean difference) was observed, the data were log transformed.
RESULTS
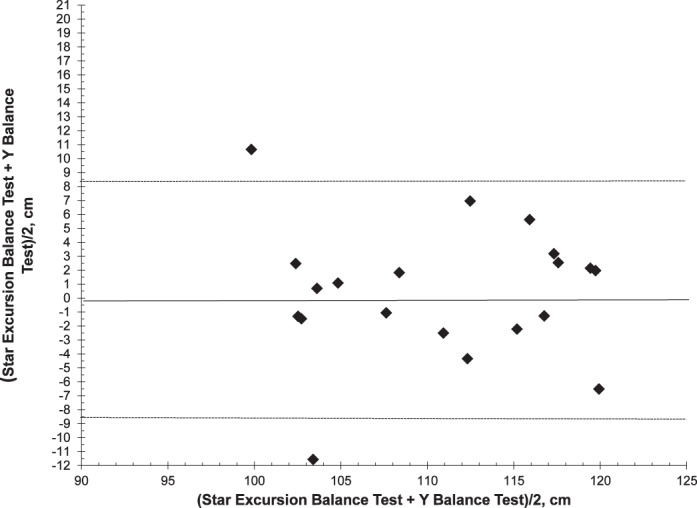
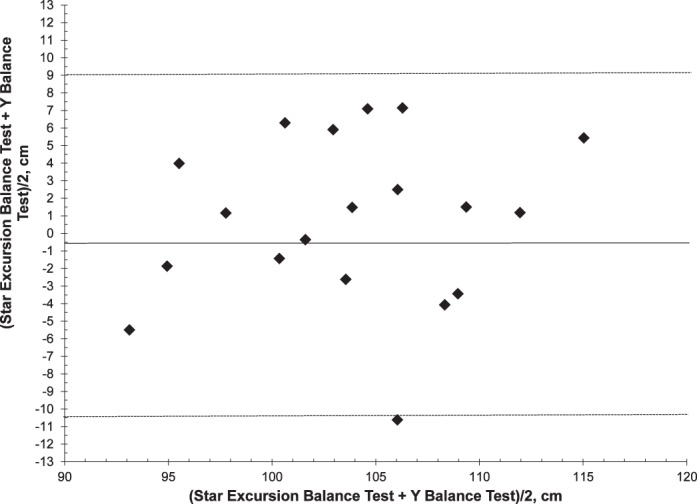
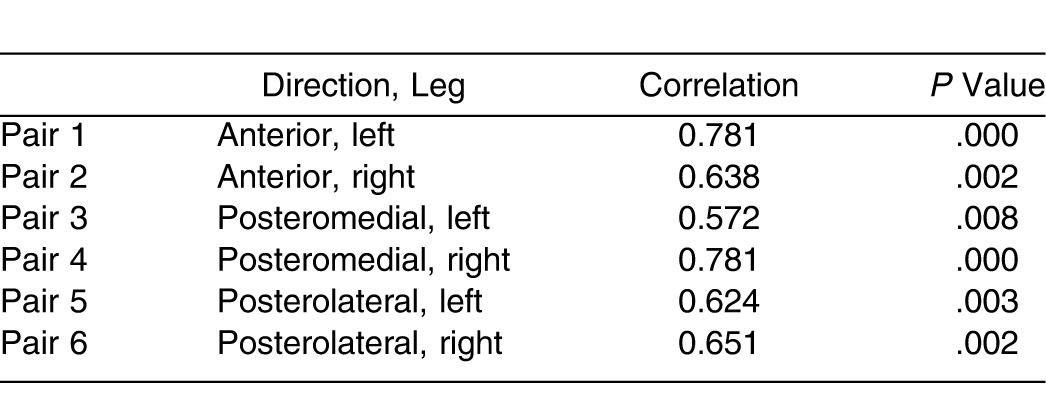
Differences were observed between the SEBT and YBT in the A reach direction on both legs (Table 1). Participants reached further in the SEBT than in the YBT on both the left (P = .0002) and right legs (P = .003). No other differences were noted in the PM and PL reach directions or between left and right legs in either test. Effect size calculations indicated that results were strong for the left leg and moderate for the right leg in the A direction and weak for both legs in the PM and PL directions. The Bland-Altman analysis showed that the 95% limit of agreement between SEBT and YBT performance in the anterior direction was 5.08 (% limb length) for the left leg (5.08 [–4.69 to 14.85]), demonstrating that SEBT reach excursions were, on average, greater than YBT values (Figure 3). Log-transformed anterior-direction reaches on the right leg (4.59 [–7.41 to 16.60]) showed good agreement, with an SEBT score 3% higher than the YBT score (Figure 4). Posteromedial excursions for both left (0.93 [–11.55 to 13.42]) and right (0.34 [–9.09 to 9.78]) displayed a slight bias, with SEBT scores slightly higher and scores for the right leg having less bias and variability (Figures 5 and 6). Posterolateral excursions for both left (0.03 [–10.88 to 10.94]) and right (log transformed −0.76 [–12.70 to 11.18]) legs indicated minimal bias (Figures 7 and 8). Paired-samples correlations are presented in Table 2.
Table 1.
Reach Distances for Star Excursion Balance Test (SEBT) and Y Balance Test (YBT) and Effect-Size (ES) Calculations
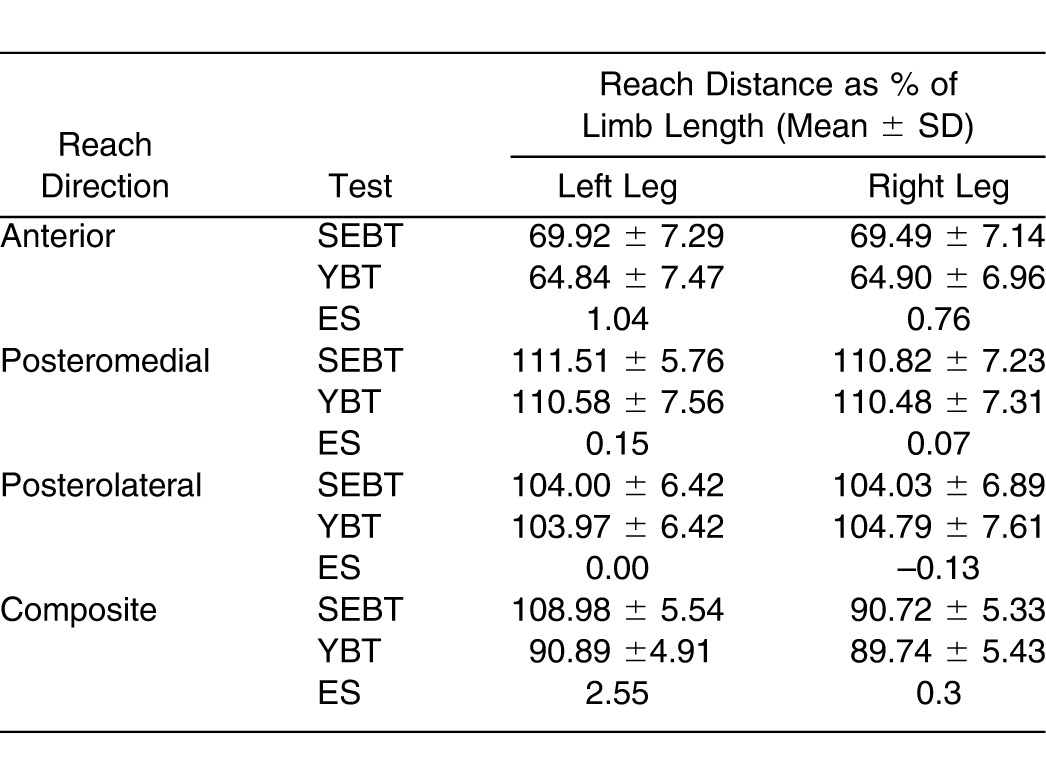
Figure 3.
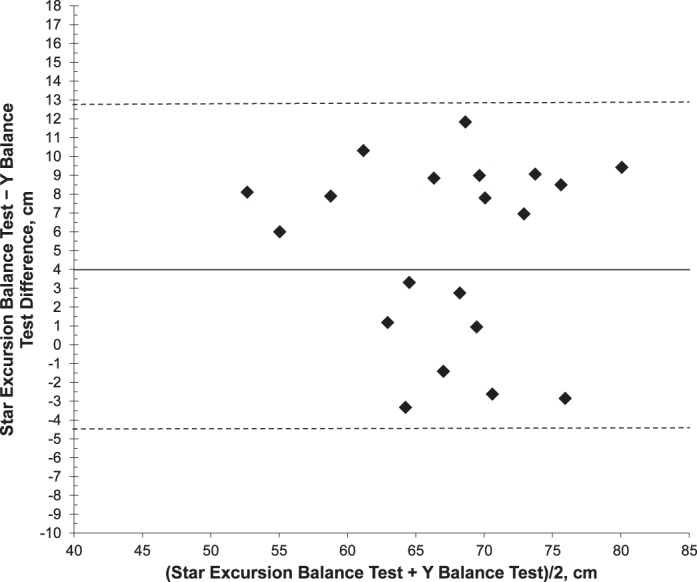
Ninety-five percent limits of agreement for anterior reach with left leg (5.08 [–4.69 to 14.85]).
Figure 4.
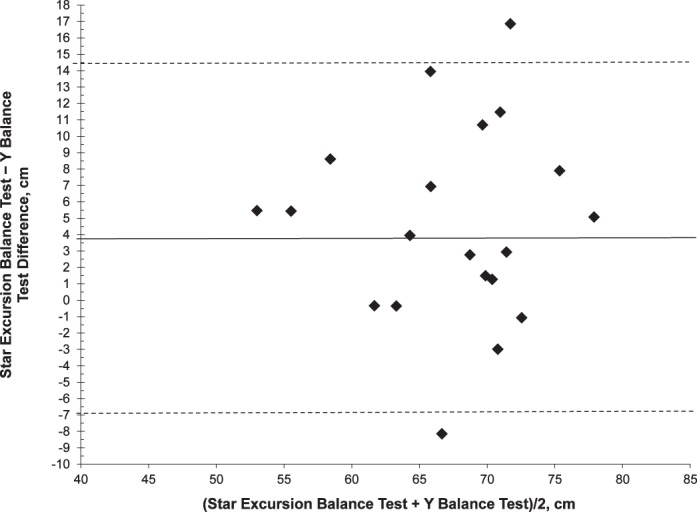
Log-transformed 95% limits of agreement for anterior reach with right leg (4.59 [–7.41 to 16.60]).
Figure 5.
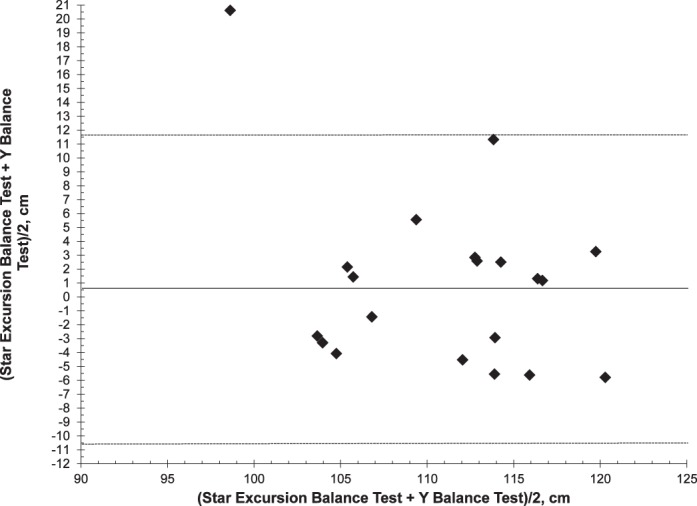
Ninety-five percent limits of agreement for posteromedial reach with left leg (0.93 [–11.55 to 13.42]).
Figure 6.
Ninety-five percent limits of agreement for posteromedial reach with right leg (0.34 [–9.09 to 9.78]).
Figure 7.
Ninety-five percent limits of agreement for posterolateral reach with left leg (0.03 [–10.88 to 10.94]).
Figure 8.
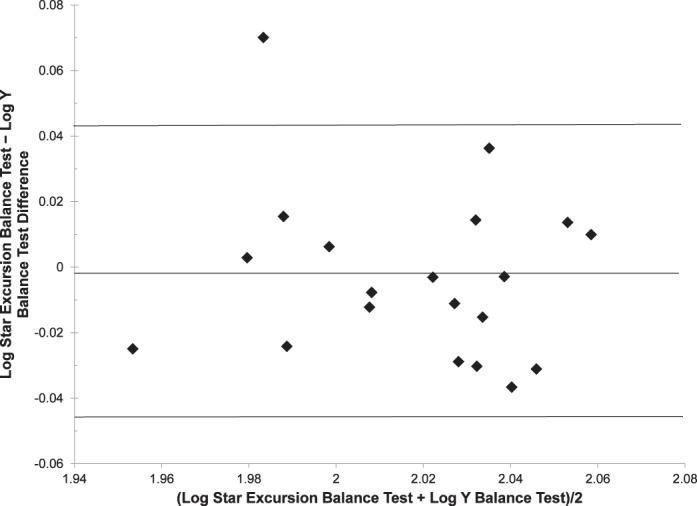
Log-transformed 95% limits of agreement for posteromedial reach with right leg (−0.76 [–12.70 to 11.18]).
Table 2.
Star Excursion Balance Test and Y Balance Test: Paired-Samples Correlations (N = 20)
DISCUSSION
The principle finding in this investigation was that healthy participants achieved a longer reach distance in the A direction of the SEBT compared with the YBT. Previous authors have reported differences in SEBT reach distances similar to those of the balance tasks we observed after neuromuscular training8,9 and fatigue protocols21 and in injured groups.7,21 These differences have implications for the implementation and interpretation of the YBT. We observed no differences in the other 2 reach directions. These findings may be due to differences in postural-control strategies in completing the dynamic balance tasks.
Postural control may be classified as either static (attempting to maintain a base of support with minimal movement) or dynamic (attempting to maintain a stable base of support while completing a prescribed movement).21 This is a complex process that requires central processing of sensory inputs from visual, vestibular, and somatosensory pathways, as well as a resultant efferent response that controls the precise recruitment of specific motor units.22 The central nervous system generates a “blueprint for movement,” which is delivered to pattern generators at a spinal level, resulting in the patterned activation of α and γ motoneuron systems.23 Feedback and feed-forward control mechanisms play vital roles in the control of movement and the execution of tasks such as the SEBT and YBT. The stimulation of mechanoreceptors located in the periphery (ie, skin, ligaments, muscles, and joints) provides afferent feedback via spinal pathways regarding joint movement and position in various body segments during movement.24,25 The pattern of motoneuron activation is fine tuned by feedback from these mechanoreceptors, which act either monosynaptically or via inhibitory interneurons and provide a corrective response to the action.26 In contrast, feed-forward controls have previously been described as anticipatory actions occurring before the sensory detection occurs.27,28 The mechanism of feedback and feed-forward control may vary between the SEBT and YBT, resulting in differences in reach distances in the A direction. The YBT requires the participant to stand in an elevated position on a central footplate while pushing a sliding block. He or she receives constant proprioceptive feedback throughout the reach excursion from the plantar surface of the reach foot. In the SEBT, the participant places downward pressure through the reach foot only at the end of the reach excursion and, therefore, does not receive a similar level of afferent information throughout the movement, potentially relying on a feed-forward control strategy until contact is made with the tape measure. The postural-control strategy used during the SEBT may mean that the individual does not have the same level of inhibition throughout the movement and, thus, reaches further. An external focus of attention facilitates automaticity in motor control and promotes movement efficiency compared with an internal focus.29 Contact with the sliding block may have induced a more internal focus, thereby resulting in a negative influence on the A direction. In addition, pressure is allowed with the ground by the reach leg, albeit minimally, and actually provides a point of support. In the YBT, the individual may remain in a narrower stance as a result of the feedback received throughout the movement and therefore not reach as far. In upright stance, a stiffening strategy, characterized by decreased amplitude and increased frequency of postural adjustments and leaning back away from the direction of the postural threat, has previously been reported,30,31 resulting in a feeling of less stability when standing on an elevated surface.32 Sabin et al33 recently reported reduced reach distances when performing the SEBT on an unstable surface. The elevated stance-leg position of the YBT, although at a relatively low height, may be perceived as a barrier to reaching further.
Several possible explanations for A reach differences are based on feedback mechanisms. The visual system provides the body with visual cues for use as reference points in orienting the body in space. It is generally agreed that, under normal conditions, the somatosensory and visual subsystems are the primary mediators of balance and postural awareness.25 In the A reach direction, participants receive visual feedback from the reach leg as they move and can observe the scored reach distance on each trial. In the PM and PL directions, visual awareness is reduced, and therefore, the inability of the participants to see their scores may not limit their reach as in the A direction. However, this places an increased demand on somatosensory feedback strategies, meaning that, during the YBT, participants were able to reach similar distances as on the SEBT owing to their contact with the sliding block. Another potential reason for similar reach distances observed in the PM and PL directions relates to the placement of the reach foot on the sliding block of the YBT. Participants were instructed to not place the foot on top of the tubing and in all cases placed the plantar surface of the reach foot on the medial side of the sliding block. This may have resulted in their maintaining support closer to their center of gravity during the YBT than when they reached along the tape measures of the SEBT, again allowing them to reach similar distances in the PM and PL directions. In the A direction, the foot was placed on the lateral side of the sliding block, thus displacing the center of gravity and subsequently reducing reach distances compared with the SEBT.
These factors may also account for the significant differences and relatively large limits of agreement in the A direction, which indicate poor agreement between the tests in this study. Although this poor agreement would have practical implications for the use of these tests together as part of a screening protocol or clinical assessment outcome, it is unlikely that the tests would be used concurrently in these situations. Similarly, previous investigators measuring SEBT performance have indicated that side-to-side differences like those we observed between the SEBT and YBT in the A direction predict lower limb injury4 and indicate deficiency in conditions such as chronic ankle instability6 and anterior cruciate ligament injury.7 Therefore, caution should be exerted when interpreting reach distances from both tests in the A direction in the same individual or group. Based on our findings, the posterolateral direction is the test with the least bias, which may make it more feasible for comparison between the tests. There is a paucity in the literature of studies investigating the relationship between the YBT and injury screening and assessment. Owing to its practicality and ease of use in a clinical setting, further research is warranted.
Finally, the differentiation between the levels of the elevated stance foot on the central footplate and the lower reach foot during the YBT compared with the level base for the SEBT may influence the individual's postural-control strategy. However, the former may be more applicable to everyday situations in which postural control is required on uneven surfaces. The role this strategy may have in the completion of these tests warrants further investigation.
CONCLUSIONS
A difference in A reach-direction distance was observed between the SEBT and YBT, with no differences noted in the PM and PL directions. Postural-control strategies used in completing the tests appear to influence reach performance. The results of this study have implications for both researchers and clinicians in interpreting and implementing these dynamic balance tests. Reach values and research established for the SEBT in athletic, healthy, and injured populations may not be transferrable to YBT performance. We are also the first to report on such values for the YBT in a healthy athletic male group. It is important to note that differences exist between these assessment tools; however, we did not establish if one test is more clinically appropriate than the other. Further research on the postural-control strategies and kinematic demands associated with these tests may indicate which conditions may be best screened or diagnosed using which test and therefore have implications for assessment and rehabilitation.
REFERENCES
- 1.Lephart SM, Pincivero DM, Rozzi SL. Proprioception of the ankle and knee. Sports Med. 1998;25(3):149–55. doi: 10.2165/00007256-199825030-00002. [DOI] [PubMed] [Google Scholar]
- 2.Tyldesley B, Grieve J. Muscles, Nerves and Movement: In Human Occupation. Hoboken, NJ: Wiley-Blackwell; 2002. [Google Scholar]
- 3.Gray G. Lower Extremity Functional Profile. Adrian, MI: Wynn Marketing; 1995. [Google Scholar]
- 4.Sato K, Mokha M. Does core strength training influence running kinetics, lower-extremity stability, and 5000-M performance in runners? J Strength Cond Res. 2009;23(1):133–140. doi: 10.1519/JSC.0b013e31818eb0c5. [DOI] [PubMed] [Google Scholar]
- 5.Batson G. Validating a dance-specific screening test for balance: preliminary results from multisite testing. Med Probl Perform Art. 2010;25(3):110–115. [PubMed] [Google Scholar]
- 6.Sefton JM, Hicks-Little CA, Hubbard TJ, et al. Sensorimotor function as a predictor of chronic ankle instability. Clin Biomech (Bristol, Avon) 2009;24(5):451–458. doi: 10.1016/j.clinbiomech.2009.03.003. [DOI] [PubMed] [Google Scholar]
- 7.Herrington L, Hatcher J, Hatcher A, et al. A comparison of Star Excursion Balance Test reach distances between ACL deficient patients and asymptomatic controls. Knee. 2009;16(2):149–152. doi: 10.1016/j.knee.2008.10.004. [DOI] [PubMed] [Google Scholar]
- 8.McLeod TC, Armstrong T, Miller M, Sauers JL. Balance improvements in female high school basketball players after a 6-week neuromuscular-training program. J Sport Rehabil. 2009;18(4):465–481. doi: 10.1123/jsr.18.4.465. [DOI] [PubMed] [Google Scholar]
- 9.Eisen TC, Danoff JV, Leone JE, Miller TA. The effects of multiaxial and uniaxial unstable surface balance training in college athletes. J Strength Cond Res. 2010;24(7):1740–1745. doi: 10.1519/JSC.0b013e3181e2745f. [DOI] [PubMed] [Google Scholar]
- 10.Filipa A, Byrnes R, Paterno MV, Myer GD, Hewett TE. Neuromuscular training improves performance on the Star Excursion Balance Test in young female athletes. J Orthop Sports Phys Ther. 2010;40(9):551–558. doi: 10.2519/jospt.2010.3325. [DOI] [PMC free article] [PubMed] [Google Scholar]
- 11.Hale SA, Hertel J, Olmsted-Kramer LC. The effect of a 4-week comprehensive rehabilitation program on postural control and lower extremity function in individuals with chronic ankle instability. J Orthop Sports Phys Ther. 2007;37(6):303–311. doi: 10.2519/jospt.2007.2322. [DOI] [PubMed] [Google Scholar]
- 12.Hertel J, Braham RA, Hale SA, Olmsted-Kramer LC. Simplifying the Star Excursion Balance Test: analyses of subjects with and without chronic ankle instability. J Orthop Sports Phys Ther. 2006;36(3):131–137. doi: 10.2519/jospt.2006.36.3.131. [DOI] [PubMed] [Google Scholar]
- 13.Robinson RH, Gribble PA. Support for a reduction in the number of trials needed for the Star Excursion Balance Test. Arch Phys Med Rehabil. 2008;89(2):364–370. doi: 10.1016/j.apmr.2007.08.139. [DOI] [PubMed] [Google Scholar]
- 14.Plisky PJ, Rauh MJ, Kaminski TW, Underwood FB. Star Excursion Balance Test as a predictor of lower extremity injury in high school basketball players. J Orthop Sports Phys Ther. 2006;36(12):911–919. doi: 10.2519/jospt.2006.2244. [DOI] [PubMed] [Google Scholar]
- 15.Plisky PJ, Gorman PP, Butler RJ, et al. The reliability of an instrumented device for measuring components of the Star Excursion Balance Test. N Am J Sports Phys Ther. 2009;4(2):92–99. [PMC free article] [PubMed] [Google Scholar]
- 16.Fitzgerald D, Trakarnratanakul N, Smyth B, Caulfield B. Effects of a wobble board-based therapeutic exergaming system for balance training on dynamic postural stability and intrinsic motivation levels. J Orthop Sports Phys Ther. 2010;40(1):11–19. doi: 10.2519/jospt.2010.3121. [DOI] [PubMed] [Google Scholar]
- 17.Gribble PA, Hertel J. Effect of lower-extremity muscle fatigue on postural control. Arch Phys Med Rehabil. 2004;85(4):589–592. doi: 10.1016/j.apmr.2003.06.031. [DOI] [PubMed] [Google Scholar]
- 18.Gribble PA, Tucker WS, White PA. Time-of-day influences on static and dynamic postural control. J Athl Train. 2007;42(1):35–41. [PMC free article] [PubMed] [Google Scholar]
- 19.Cohen J. Statistical Power Analysis for the Behavioral Sciences. Mahwah, NJ: Lawrence Erlbaum Associates; 1988. [Google Scholar]
- 20.Bland JM, Altman DG. Statistical methods for assessing agreement between two methods of clinical measurement. Lancet. 1986;1(8476):307–310. [PubMed] [Google Scholar]
- 21.Gribble PA, Hertel J, Denegar CR, Buckley WE. The effects of fatigue and chronic ankle instability on dynamic postural control. J Athl Train. 2004;39(4):321–329. [PMC free article] [PubMed] [Google Scholar]
- 22.Lephart SM, Pincivero DM, Giraldo JL, Fu FH. The role of proprioception in the management and rehabilitation of athletic injuries. Am J Sports Med. 1997;25(1):130–137. doi: 10.1177/036354659702500126. [DOI] [PubMed] [Google Scholar]
- 23.Kandel ER, Schwartz JH, Jessell T. Principles of Neural Science. New York, NY: McGraw Hill; 2000. [Google Scholar]
- 24.Dietz V. Human neuronal control of automatic functional movements: interaction between central programs and afferent input. Physiol Rev. 1992;72(1):33–69. doi: 10.1152/physrev.1992.72.1.33. [DOI] [PubMed] [Google Scholar]
- 25.Riemann BL, Lephart SM. The sensorimotor system, part II: the role of proprioception in motor control and functional joint stability. J Athl Train. 2002;37(1):80–84. [PMC free article] [PubMed] [Google Scholar]
- 26.Latash M. Neurophysiological Basis of Movement. Champaign, IL: Human Kinetics; 1998. [Google Scholar]
- 27.Johansson H. Role of knee ligaments in proprioception and regulation of muscle stiffness. J Electromyogr Kinesiol. 1991;1(3):158–179. doi: 10.1016/1050-6411(91)90032-Z. [DOI] [PubMed] [Google Scholar]
- 28.Ghez C, Hening W, Gordon J. Organization of voluntary movement. Curr Opin Neurobiol. 1991;1(4):664–671. doi: 10.1016/s0959-4388(05)80046-7. [DOI] [PubMed] [Google Scholar]
- 29.Wulf G, Shea C, Lewthwaite R. Motor skill learning and performance: a review of influential factors. Med Educ. 2010;44(1):75–84. doi: 10.1111/j.1365-2923.2009.03421.x. [DOI] [PubMed] [Google Scholar]
- 30.Adkin AL, Frank JS, Carpenter MG, Peysar GW. Fear of falling modifies anticipatory postural control. Exp Brain Res. 2002;143(2):160–170. doi: 10.1007/s00221-001-0974-8. [DOI] [PubMed] [Google Scholar]
- 31.Carpenter MG, Frank JS, Silcher CP, Peysar GW. The influence of postural threat on the control of upright stance. Exp Brain Res. 2001;138(2):210–218. doi: 10.1007/s002210100681. [DOI] [PubMed] [Google Scholar]
- 32.Huffman JL, Horslen BC, Carpenter MG, Adkin AL. Does increased postural threat lead to more conscious control of posture? Gait Posture. 2009;30(4):528–532. doi: 10.1016/j.gaitpost.2009.08.001. [DOI] [PubMed] [Google Scholar]
- 33.Sabin MJ, Ebersole KT, Martindale AR, Price JW, Broglio SP. Balance performance in male and female collegiate basketball athletes: influence of testing surface. J Strength Cond Res. 2010;24(8):2073–2078. doi: 10.1519/JSC.0b013e3181ddae13. [DOI] [PubMed] [Google Scholar]