Abstract
Objective
To identify the most precise and consistent variables using joint repositioning for identifying joint position recognition (JPR) deficits in individuals with chronic ankle instability (CAI).
Data Sources
We conducted a computerized search of the relevant scientific literature from January 1, 1965, to July 31, 2010, using PubMed Central, CINAHL, MEDLINE, SPORTDiscus, and Web of Science. We also conducted hand searches of all retrieved studies to identify relevant citations. Included studies were written in English, involved human participants, and were published in peer-reviewed journals.
Study Selection
Studies were included in the analysis if the authors (1) had examined JPR deficits in patients with CAI using active or passive repositioning techniques, (2) had made comparisons with a group or contralateral limb without CAI, and (3) had provided means and standard deviations for the calculation of effect sizes.
Data Extraction
Studies were selected and coded independently and assessed for quality by the investigators. We evaluated 6 JPR variables: (1) study comparisons, (2) starting foot position, (3) repositioning method, (4) testing range of motion, (5) testing velocity, and (6) data-reduction method. The independent variable was group (CAI, control group or side without CAI). The dependent variable was errors committed during joint repositioning. Means and standard deviations for errors committed were extracted from each included study.
Data Synthesis
Effect sizes and 95% confidence intervals were calculated to make comparisons across studies. Separate meta-analyses were calculated to determine the most precise and consistent method within each variable. Between-groups comparisons that involved active repositioning starting from a neutral position and moving into plantar flexion or inversion at a rate of less than 5°/s as measured by the mean absolute error committed appeared to be the most sensitive and precise variables for detecting JPR deficits in people with CAI.
Key Words: proprioception, kinesthesia, deafferentation
Key Points
Level 3 evidence suggested that people with chronic ankle instability (CAI) display consistent deficits in joint position recognition when compared with people without CAI.
Consistent level 3 evidence existed to provide a grade B strength of recommendation for the use of joint position recognition as a tool to identify proprioceptive deficits in people with CAI.
Specific variables used during joint position recognition testing are more consistent and produce more robust results in individuals with CAI.
More rigorous study design is necessary to further elucidate proprioceptive deficits associated with joint position recognition in people with CAI.
Ankle sprains are the most common injuries associated with physical activity and athletic participation,1,2 accounting for approximately 60% of all injuries that occur during interscholastic and intercollegiate sports.1–5 An estimated 23 000 ankle sprains occur daily in the United States.6 Although ankle sprains often are viewed as mild injuries, they represent a substantial public health problem.7,8 Sprains to the ankle and foot are the reason for 1.6 million physician office visits and more than 8000 hospitalizations each year.9 The primary predisposing factor for an ankle sprain is a history of previous sprain,10 and approximately 30% of people who have a first-time ankle sprain develop recurrent ankle instability; however, this number has been reported to be as high as 70%.11–13 Residual symptoms of ankle sprains combined with repeated bouts of subsequent instability have been termed chronic ankle instability (CAI).14
Deafferentation of the lateral ankle ligaments has been proposed as a contributing factor to developing CAI.15 Subsequently, kinesthetic alterations of the ankle and surrounding structures, such as joint position recognition (JPR), have been investigated systematically over the past 30 years.16 These kinesthetic alterations have been studied extensively using measures such as passive JPR, active JPR, and ankle-joint angle-replication error. The theoretical premise in this type of assessment is that people with CAI have an impaired ability to detect the position of the foot relative to the body due to altered input from damaged mechanoreceptors in the lateral ligaments of the ankle.15,17 These JPR deficits might be an important contributor to recurrent ankle injury, given that people with CAI have been seen to be in a more inverted position in the transition from an unloaded to a loaded foot during walking,18–20 jogging,19 and landing from a jump.21 In a recent systematic review of this literature, Munn et al16 revealed that deficits associated with active and passive JPR appear to be present in people with CAI. The authors calculated unstandardized mean differences between groups or limbs with 95% confidence intervals (CIs) and pooled the results across studies to examine whether the mean differences indicated JPR deficits in people with CAI. When combining all measures across studies, the authors revealed deficits in both active and passive repositioning. However, they did not provide any indication about optimal measurement strategies for detecting deficits in people with CAI. To date, no one has conducted a systematic review to examine which measurement variables of JPR appear to be most sensitive to detecting afferent alterations in people with CAI.
Therefore, the purpose of our systematic review was to determine the most precise and consistent JPR variables for identifying proprioceptive deficits in individuals with CAI. Specific variables that we evaluated were (1) study comparisons, (2) starting foot position, (3) repositioning method, (4) testing range of motion (ROM), (5) testing velocities, and (6) data-reduction method. We hypothesized that specific methodologic considerations for best detecting JPR deficits in people with CAI would emerge. We also hypothesized that, overall, people with CAI would present with deficits in JPR.
METHODS
Evidence Acquisition
Search Strategy and Study Selection
In July 2011, we performed a computerized search of PubMed Central (January 1, 1965, to July 31, 2010); EBSCO Host, including CINAHL, MEDLINE, and SPORTDiscus (January 1, 1965, to July 31, 2010); and Web of Science (1965–2010) to identify citations concerning the utility of JPR for determining proprioceptive deficits in individuals with CAI. Searches were limited to studies that involved humans, were written in English, and were reported in peer-reviewed journals. A hand search for relevant citations also was performed on all retrieved studies. We independently selected studies for initial review.
Criteria for inclusion required that authors (1) examined JPR deficits in patients with CAI using active or passive repositioning techniques or both; (2) made comparisons with a group or contralateral limb without CAI; and (3) provided means and standard deviations for the calculation of effect sizes. Due to the various definitions of CAI, we chose to include studies in which participants with CAI were identified as having at least a history of recurrent ankle sprains with repeated episodes of the ankle giving way after an initial sprain. Each included study then was coded independently by each investigator to identify the following: (1) comparisons of the limb with CAI with either a matched limb without CAI or control group without CAI, (2) the starting foot position for testing clearly described, (3) the repositioning method used (active or passive), (4) the testing ROM used, (5) the testing velocities indicated, and (6) the data-reduction method.
Assessment of Methodologic Quality
We assessed study quality using the modified checklist of Downs and Black,22 which encompasses components of the Strengthening the Reporting of Observational Studies in Epidemiology (STROBE) statement.23 The checklist was modified, as cited,16 to include only questions relevant to nonrandomized studies. This checklist includes 16 questions for a total of 17 points that can be awarded based on methodologic quality. We independently performed the quality assessment; any discrepancies between authors in the assessment were resolved by mutual agreement. In addition, a sensitivity analysis using the 1-study-removed method for the effect of study-design quality also was performed.
Data Extraction and Analysis
The following are the variables of interest with the levels for each variable defined. For analysis of each variable, the individual effect sizes for JPR measures within studies were calculated using a bias-corrected Hedges g24 with 95% CIs and the P value of the z-distribution of the effect size and were reported as Hedges g (lower CI, upper CI, and P value of the z-distribution) generated around each point measure. We then input each of the variables into separate analyses. These were used to make methodologic distinctions among various studies.
Study comparison refers to the comparison design within each study. The 2 levels coded for the study comparisons variable were (1) side-to-side comparisons17,25–28 and (2) matched-participants comparisons.17,26,28–33 Side-to-side comparisons were those that included the uninvolved limb of the participant with CAI as the control limb for comparison. Matched-participants comparisons involved a matched-control individual without CAI for comparison.
The starting foot position variable refers to the initial position in which the foot was placed at test initiation. The 7 levels coded for starting foot position were (1) 10° of dorsiflexion,33 (2) 0° (neutral),17,25,26,28,30,31,33 (3) 10° of plantar flexion,33 (4) 15° of plantar flexion,28,32 (5) 20° of plantar flexion,27,33 (6) 30° of plantar flexion,33 and (7) 42° of plantar flexion.29 Frontal-plane position for all testing positions was neutral.
Repositioning method refers to the type of repositioning that was used. The 2 levels coded within repositioning method were (1) active repositioning17,26,27,29,31,32 and (2) passive repositioning.17,25,28–30,32,33 In studies in which active repositioning was used, the participant generated the force needed to reposition the foot into the correct angle. In studies in which passive repositioning was used, participants orally identified when they believed the foot was repositioned into the reference angle.
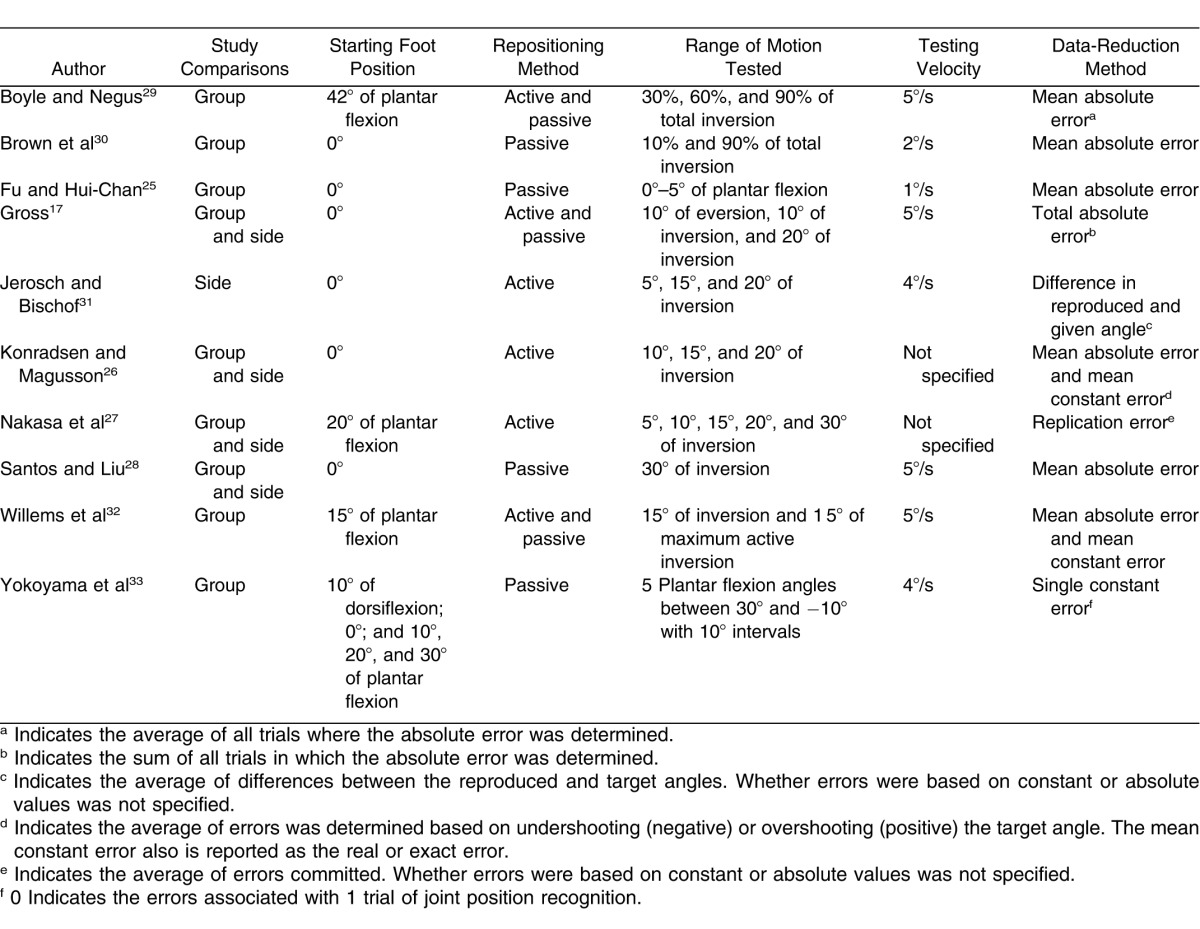
Testing ROM refers to the direction and arc of motion into which the foot was moved. Many researchers used multiple arcs of motion. We coded 9 separate levels for testing ROM and defined them as 4 major directions with subcategories. The major directions were inversion, indicating the foot was testing into inversion; plantar flexion, indicating the foot was tested into plantar flexion; dorsiflexion, indicating the foot was tested into dorsiflexion; and frontal, indicating the foot was tested in both the inversion and eversion directions without reported separation of the data within these trials. All 4 major directions were subcategorized into EARLY, indicating the first one-third of ROM was tested; MID, indicating the middle one-third of ROM was tested; END, indicating the last one-third of ROM was tested; or ALL, indicating multiple ROMs were testing within the indicated direction. Testing ROM was coded as (1) Inversion-MID,26,29,32 (2) Inversion-END,28,29 (3) Inversion-ALL,27,29,31,32 (4) Dorsiflexion-END,33 (5) Dorsiflexion-ALL,30 (6) Plantar flexion-EARLY,25 (7) Plantar flexion-ALL,30 (8) Frontal-EARLY, and (9) Frontal-ALL.17
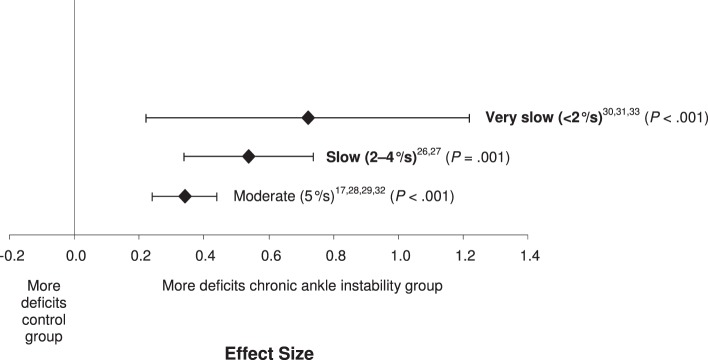
Testing velocities refer to the velocity of the mechanical testing arm (for passive reposition) or the velocity allowed by the testing arm (for active repositioning). We coded testing velocities into 3 variables collapsed across ranges of velocities reported as (1) less than 2°/s,25 (2) 2 to 4°/s,30,31,33 and (3) 5°/s.17,28,29,32 In 2 investigations, the authors26,27 used only active repositioning and reported no specific testing velocity for repositioning. The results of these 2 investigations were not included in the analysis of this variable.
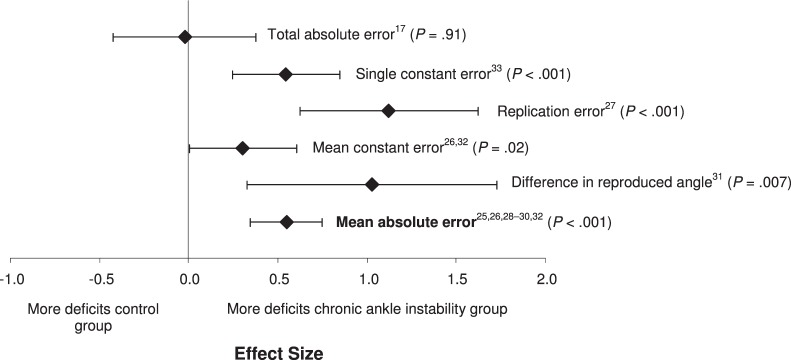
Data-reduction method refers to the handling of collected data. We identified 6 separate levels of data reduction across included studies. (1) Average absolute error was defined as the average absolute value across trials of errors between the target and repositioning angles.25,26,28–30,32 (2) Total absolute error was defined as the sum of errors across several motions.17 (3) Mean constant error was defined as the actual difference between the target and repositioning angle across multiple trials. These measures consider the positive and negative values of the differences and represent whether the participants overshot (positive) or undershot (negative) the target. Across multiple investigations, the constant error was referred to as real error or exact error.25–32 (4) The difference between the reproduced and the given angle31 was used in 1 investigation, but we could not determine whether the absolute or constant error was calculated. (5) Replication error27 was defined as the difference between the target and repositioned angle, but no details associated with positive, negative, or absolute values were specified. (6) Single measure33 was defined as recording of only a single repositioning error measure. In this study, only 1 measurement of the actual difference between the target and repositioning angle was performed for each ankle repositioning direction.
Meta-Analysis
Separate meta-analyses were performed for each of the 6 variables. For each meta-analysis, a random-effects model was used. We chose this model specifically because the effect sizes and CIs analyzed in each meta-analysis were generated from independent studies in which authors used different classifications of CAI.24 Based on the included studies, potential unidentified moderating variables influenced the effect sizes. The random-effects model provides a more conservative estimate of effect size and CIs than the fixed-effect model does.24 Because all included studies were retrospective, the random-effects model afforded the opportunity to provide a more reasonable interpretation of the size and variability around effects and to generalize the results of the analyses to the broader population of people with CAI.24 Individual measures across the multiple variables were pooled from the included studies using a bias-corrected Hedges g24 and 95% CIs to examine the magnitude and precision of the difference between the limbs and groups in people with and without CAI. In most studies, investigators made multiple comparisons between groups or limbs. Each comparison was treated independently within the statistical analyses of the measurement variables. All effect sizes, 95% CIs, and P values of the Z distribution were calculated in Comprehensive Meta-Analysis (version 2.0; BioStat, Englewood, NJ). Hedges g is a standardized effect; it creates a unitless measure that also is corrected to represent an effect that exists on a parametric distribution. Across the variables, the standardized effects were pooled into the coded variables using meta-analyses conducted in Comprehensive Meta-Analysis. A positive effect size indicated more JPR errors in the CAI condition (limb, group) than the condition without CAI. To interpret the strength of the effect sizes, we used the guidelines of Cohen.34 We interpreted values as weak if they were less than 0.40, moderate if they were from 0.41 to 0.69, and strong if they were 0.70 or larger.34 The α level was set at .05. In addition to the statistical comparison, we performed a qualitative assessment of subgroup effect sizes and CIs for each.
Assessment of Publication Bias
To assess the robustness of the observed overall effects of the moderators on JPR in people with CAI, we used the Orwin fail-safe N test. The fail-safe N test was used to determine how many studies with trivial effects would need to be identified to nullify the pooled effect size of the included studies. To assess the likelihood of publication bias, we generated a funnel plot of all measures included in the study. In addition, we used the trim-and-fill method to impute potentially missing studies, allowing for an additional assessment of publication bias.
Level of Evidence
We used the Oxford Centre for Evidence-Based Medicine Levels of Evidence taxonomy, which was developed by Phillips et al,35 to characterize the quality, quantity, and consistency of the included studies. With this taxonomy, we determined the quality of the evidence for the included studies and generated the strength of recommendation.
RESULTS
Evidence Synthesis
Study Selection
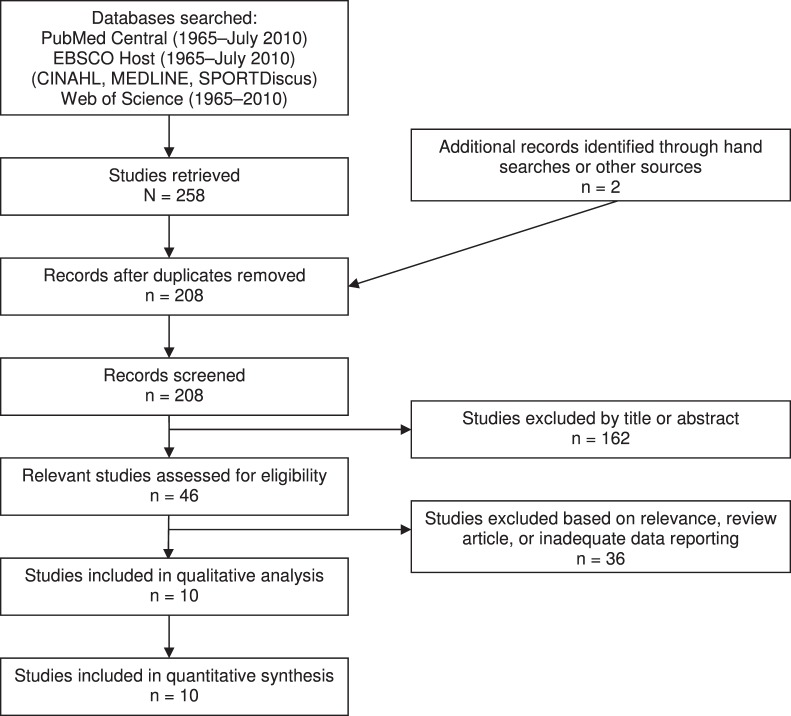
The computerized literature search using all databases yielded 258 articles. After the removal of 52 duplicate results across all databases, the final search results included 206 relevant articles to be reviewed. Two additional articles were identified through a hand search. The literature search resulted in 10 relevant studies. A complete list of search terms, Boolean operators used, and results are presented in Table 1. Figure 1 depicts study selection and inclusion. Reasons for rejection included irrelevant methods or outcome measures, previous review articles, or inadequate reporting of data.
Table 1.
Search Strategy
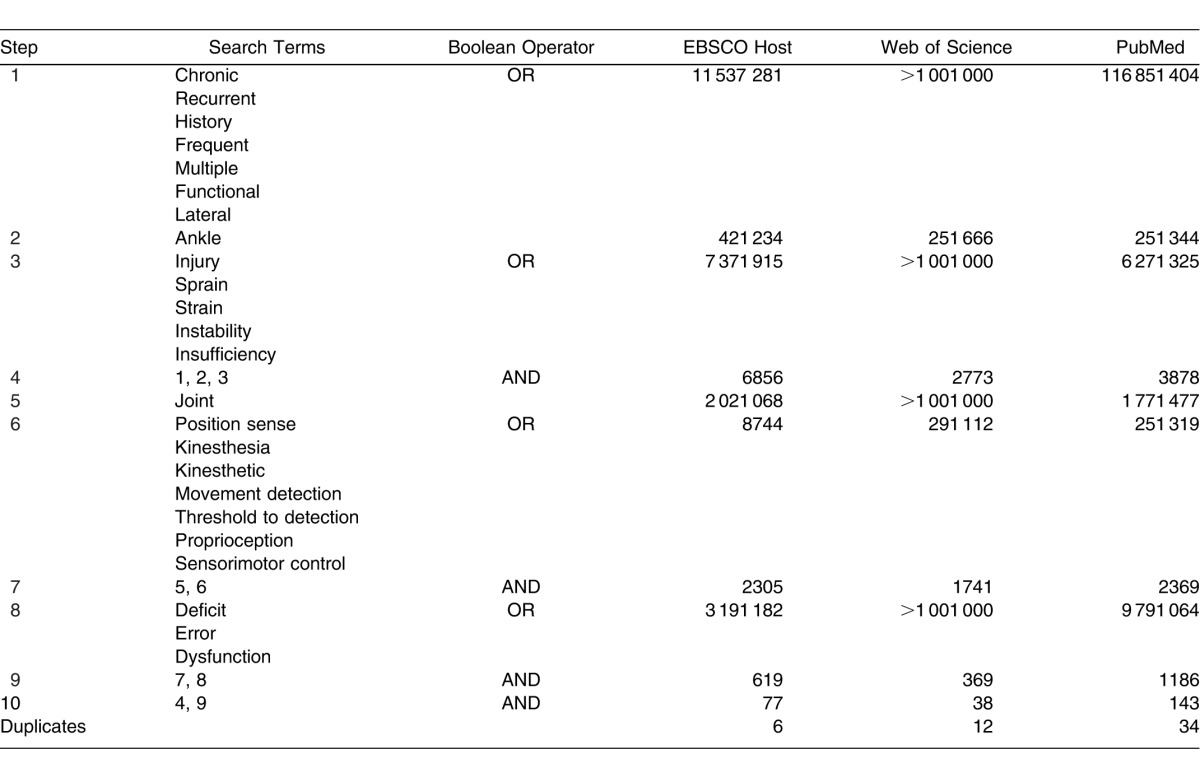
Figure 1.
Flow chart illustrating study-selection process.
Methodologic Quality and Study Characteristics
The average methodologic quality of the included studies was 9.8 out of a possible 17 (range, 7–12). Analysis of the individual influences of each methodologic-quality score for included studies (7, 8, 10, 11, and 12) revealed that quality of study design did not influence the overall pooled result (Q4 = 8.3, P = .08). All studies were retrospective case-control designs, indicating level 3 evidence according to the Oxford Centre for Evidence-Based Medicine.35 Study characteristics are provided in Table 2. A breakdown of the variables within each included study is presented in Table 3.
Table 2.
Specific Characteristics for Each of the Included Studies
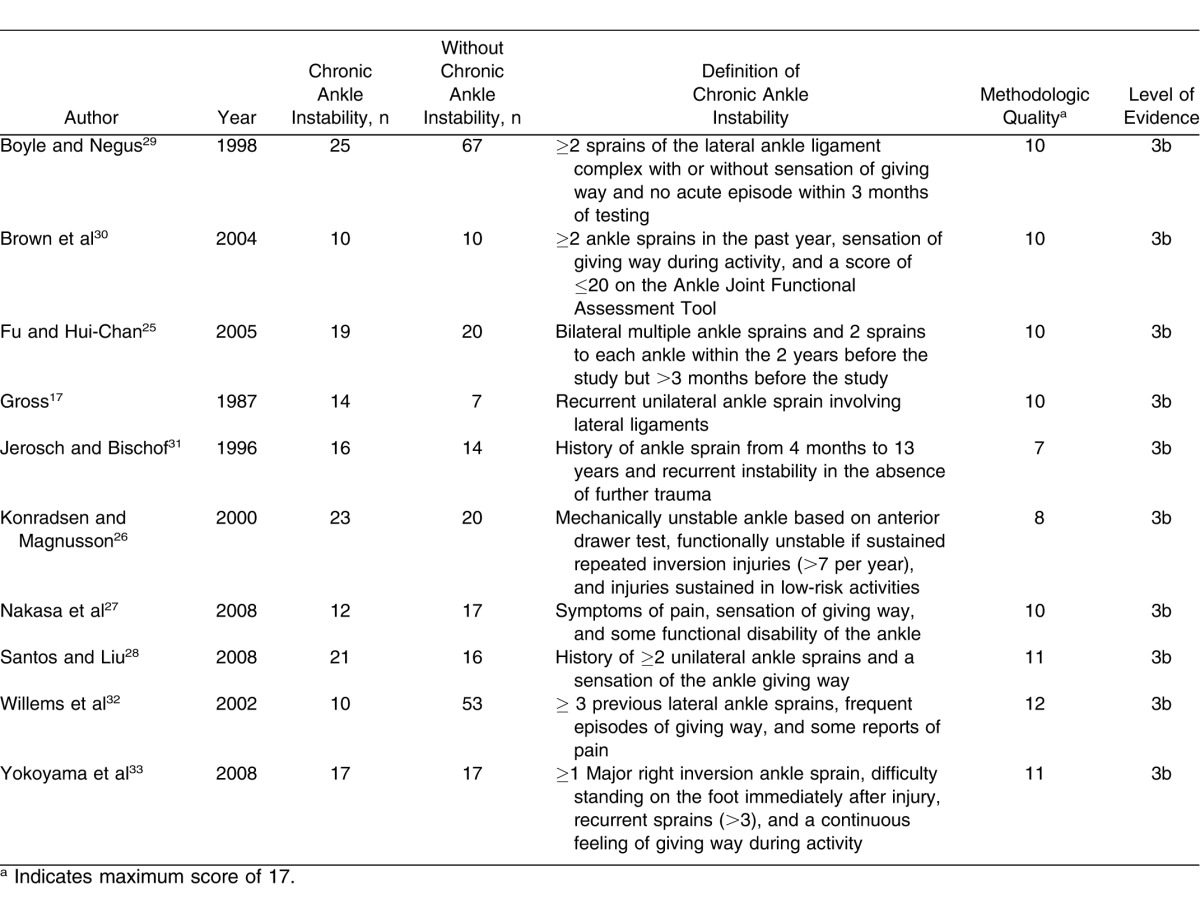
Table 3.
Descriptions of the Variables for Each of the Included Studies
Overall Summary Effect
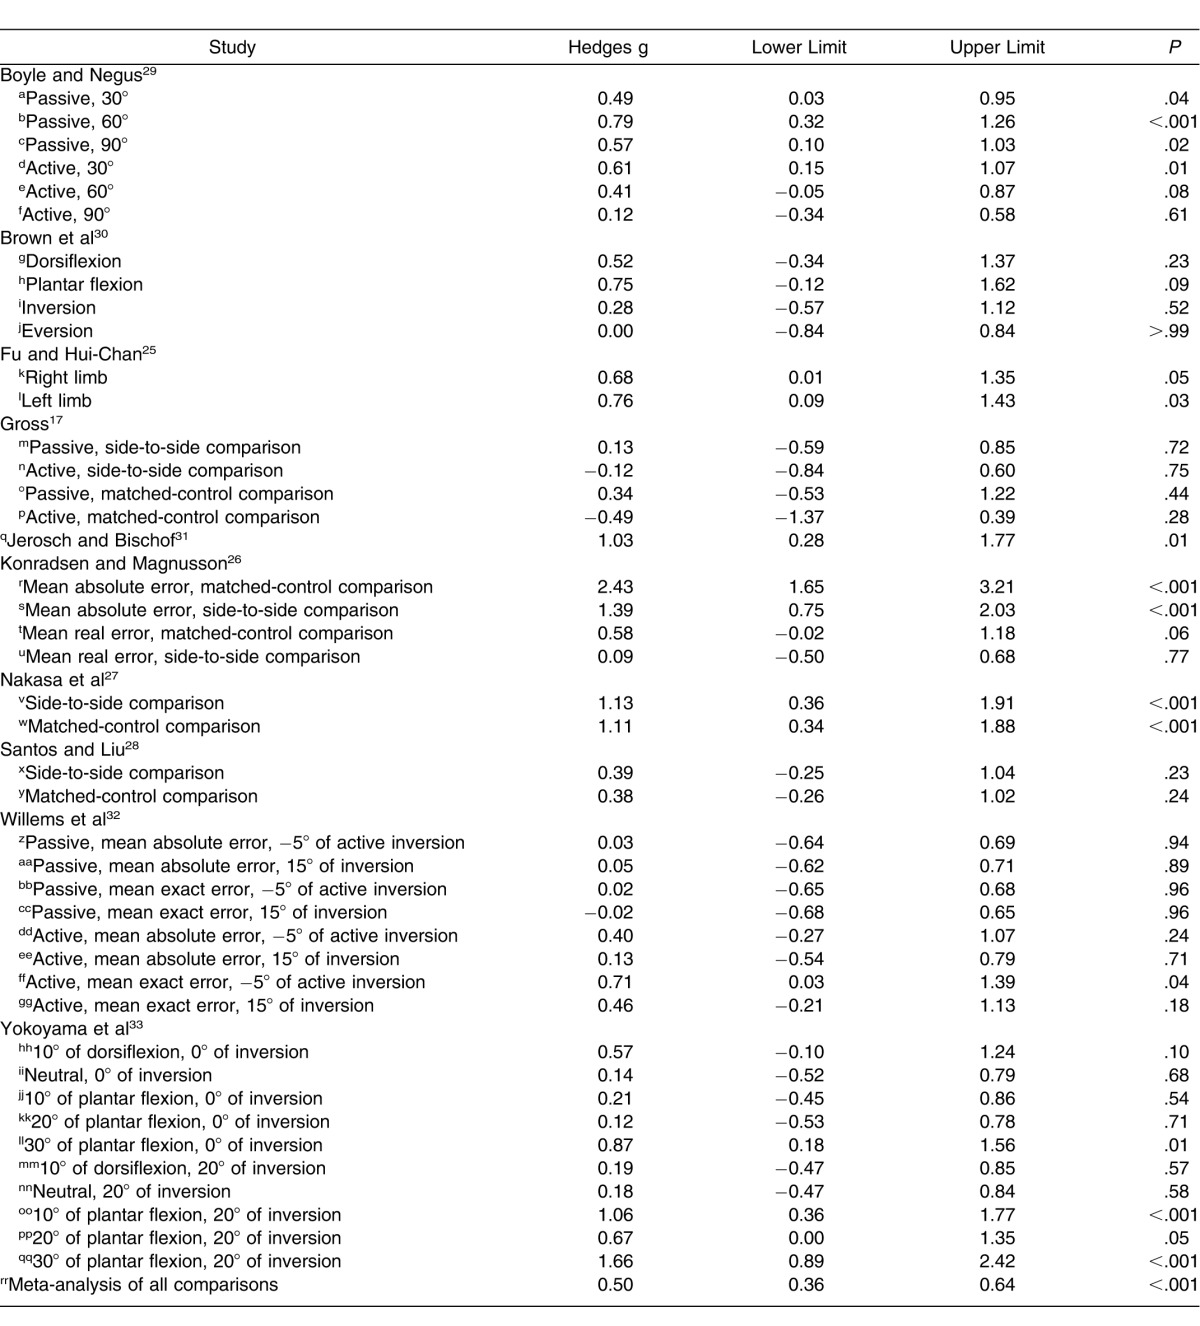
Across the multiple studies and the 6 variables examined, the overall effect of 0.50 (95% CI = 0.36, 0.64; P < .001) indicated that the condition of CAI, regardless of between-limbs or between-groups comparisons, demonstrated a moderate deficit in JPR in favor of CAI. The forest plot containing the individual effect sizes and the cumulative effect is presented in Figure 2 and Table 4.
Figure 2.
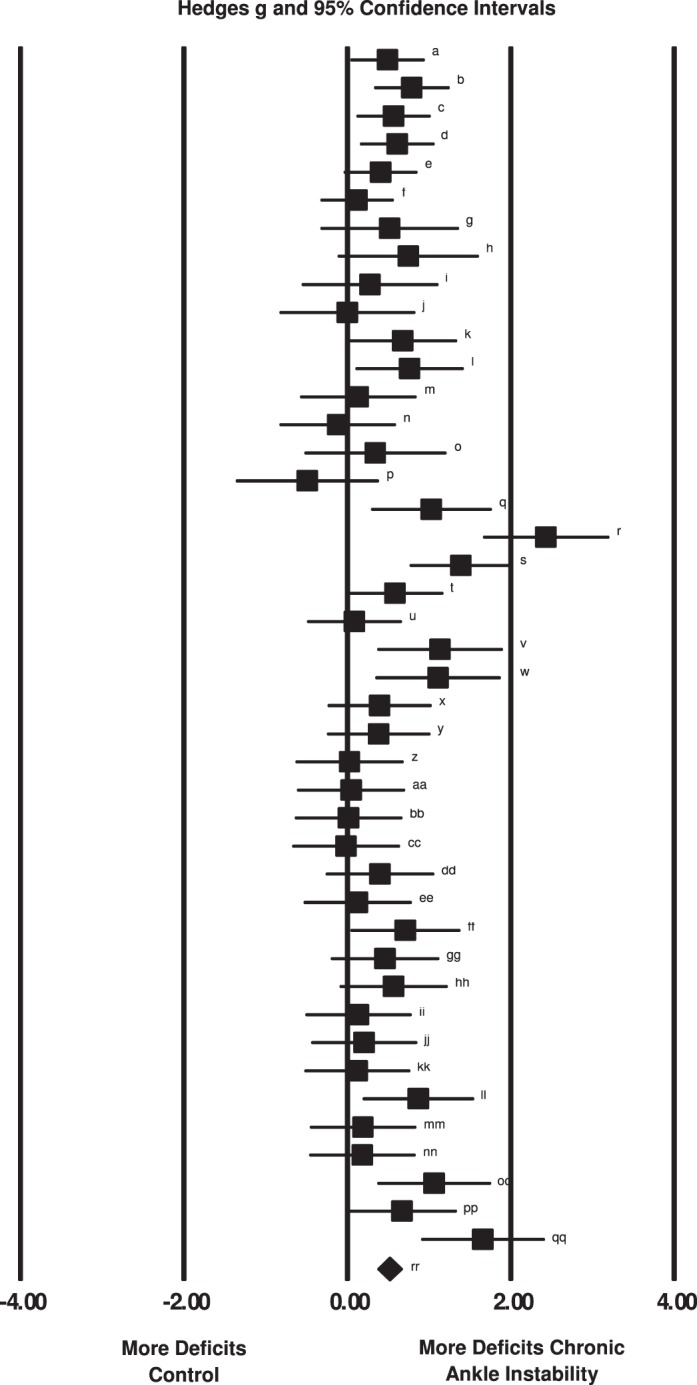
Summary of Hedges g effect sizes and 95% confidence intervals for each comparison within all 10 included studies. Summary meta-analysis indicated that individuals with chronic ankle instability demonstrated joint reproduction deficits when compared with control participants or limbs. The characteristics of the included comparisons are presented in Table 4.
Table 4.
Characteristics of Included Comparisons (Lowercase Letters Correspond to Those in Figure 2)
Summary Effects for Individual Study Variables
Three variables (study comparisons, starting foot position, repositioning method) had no differences among individual variable levels. For the 3 remaining variables (testing ROM, testing velocity, data-reduction method), we found differences among individual variable levels.
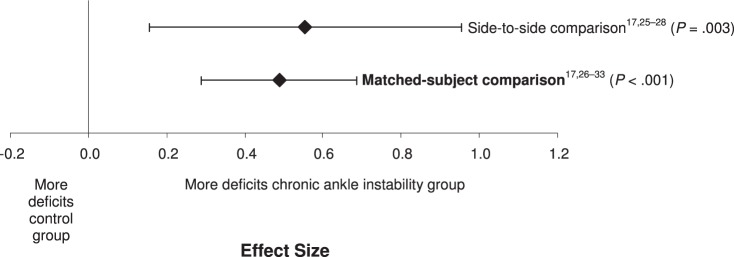
We found no difference between the 2 levels of study comparisons (Q1 = 0.11, P = .74) (Figure 3). Based on these findings, we concluded that either test might be useful. Both levels of study comparison (side to side, matched participants) demonstrated moderately positive effects with CIs that did not encompass zero for the identification of JPR deficits associated with CAI. The matched-participants design (effect size [95% CI] = 0.49 [0.33, 0.64], P < .001) demonstrated an effect, with narrower CIs for identifying JPR deficits that was similar to the effect for side-to-side design (effect size [95% CI] = 0.56 [0.19, 0.92], P = .003). Both designs demonstrated that people with CAI had greater errors than either a side or group without CAI.
Figure 3.
Summary analysis of the standardized difference between groups for the study comparison variable. The variable level in bold indicates our recommendation for the strongest and most consistent method for identifying proprioceptive deficits in individuals with chronic ankle instability.
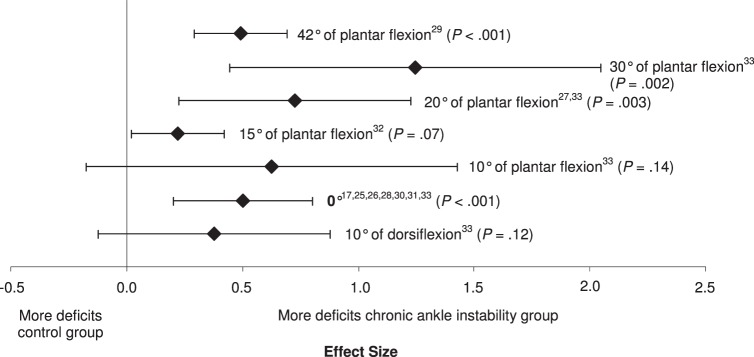
We found no differences among the subgroups for starting foot position (Q6 = 9.67, P = .14; Figure 4). Five of the 7 starting positions that were investigated (0°, 15°, 20°, 30°, and 42° of plantar flexion) resulted in small to large effect sizes with CIs that did not encompass zero and resulted in differences between CAI and no CAI. The smallest of the effect sizes that were different was 15° of plantar flexion (effect size [95% CI] = 0.24 [0.02, 0.46], P = .03). The initial position of 30° of plantar flexion demonstrated the strongest effect for identifying deficits with wide CIs that did not encompass zero (effect size [95% CI] = 1.24 [0.47, 2.02], P = .002); however, 0° was also different with narrow 95% CIs (effect size [95% CI] = 0.5 [0.2, 0.8], P < .001). The 2 effects that were not different, 10° of dorsiflexion (effect size [95% CI] = 0.40 [−0.10, 0.90], P = .12) and 10° of plantar flexion (effect size [95% CI] = 0.60 [−0.20, 1.40], P = .14), demonstrated moderate effect sizes with CIs that encompassed zero.
Figure 4.
Summary analysis of the standardized difference between groups for the starting foot position variable. The variable level in bold indicates our recommendation for the strongest and most consistent method for identifying proprioceptive deficits in individuals with chronic ankle instability.
We found no difference within the 2 subgroups of repositioning method (Q1 = 1.0, P = .32; Figure 5). Both active and passive repositioning demonstrated moderate effects with narrow CIs that demonstrated differences between CAI and no CAI. The active method (effect size [95% CI] = 0.57 [0.29, 0.86], P < .001) was slightly stronger than the passive method (effect size [95% CI] = 0.46 [0.32, 0.60], P < .001), but the passive method had narrower CIs. The lower limits of the active and passive CIs were almost identical; however, the upper limit of the active repositioning method crossed into the large effect size, whereas the upper limit of the passive repositioning method remained moderate.
Figure 5.
Summary analysis of the standardized difference between groups for the repositioning method variable. The variable levels in bold indicate our recommendations for the strongest and most consistent methods for identifying proprioceptive deficits in individuals with chronic ankle instability.
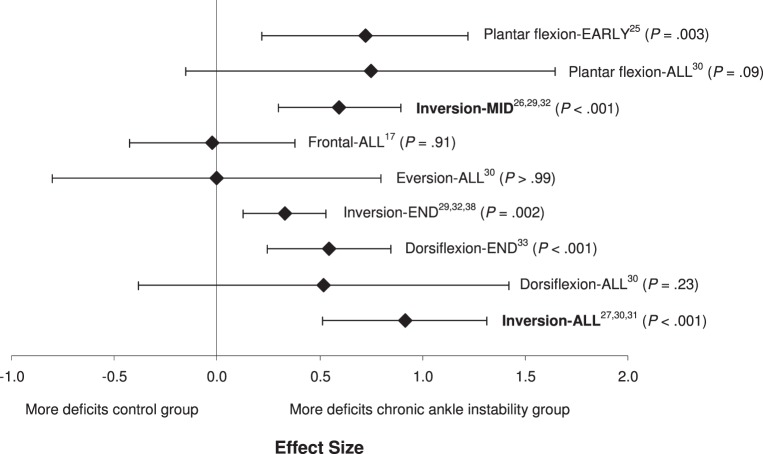
We found a difference among the subgroups of testing ROM (Q8 = 16.4, P = .04; Figure 6). Five of the 9 assessed ROMs demonstrated small to moderate effects, with CIs that did not encompass zero and resulted in differences between the conditions of CAI. Inversion-ALL (effect size [95% CI] = 0.92 [0.52, 1.31], P < .001) and Inversion-MID (effect size [95% CI] = 0.60 [0.28, 0.91], P < .001) demonstrated deficits in JPR for people with CAI: large or moderate to large effect sizes, respectively, and CIs that did not cross zero. When multiple ROMs for dorsiflexion, frontal-plane motion, and plantar flexion were tested and data were combined, identified deficits were the most inconsistent.
Figure 6.
Summary analysis of the standardized difference between groups for the ranges of motion tested variable. The variable levels in bold indicate our recommendations for the strongest and most consistent methods for identifying proprioceptive deficits in individuals with chronic ankle instability.
We found a difference among the 3 subgroups of testing velocity (Q3 = 8.48, P = .04; Figure 7). All 3 velocity categories resulted in small to large effect sizes, with CIs that did not cross zero, and demonstrated deficits in JPR in people with CAI. The strongest effect was identified for the slowest testing velocity (<2°/s), with the effects weakening as testing velocity increased (effect size [95% CI] = 0.72 [0.25, 1.19], P = .002). However, the precision of the measure, as indicated by the width of the CIs, increased as testing velocity increased.
Figure 7.
Summary analysis of the standardized difference between groups for the testing velocities variable. The variable levels in bold indicate our recommendations for the strongest and most consistent methods for identifying proprioceptive deficits in individuals with chronic ankle instability.
We found differences among the 6 data-reduction methods (Q5 = 15.91, P = .007; Figure 8). Five of the 6 data-reduction methods that we examined demonstrated small to large effect sizes, with CIs that did not encompass zero, and resulted in differences in discriminating between CAI conditions. The replication error (effect size [95% CI] = 1.12 [0.57, 1.67], P < .001) and the difference in the reproduced and the given angles (1.02 [0.28, 1.77], P = .006) had the largest effect sizes of any of the measures. The mean absolute error resulted in a moderate effect size but had the most precise CI of any of the measures examined (effect size [95% CI] = 0.55 [0.34, 0.75], P < .001). The total-errors method had the weakest effect and also the widest CIs that also encompassed zero (effect size [95% CI] = −0.02 [−0.42, 0.37], P = .91).
Figure 8.
Summary analysis of the standardized difference between groups for the data-reduction methods variable. The variable level in bold indicates our recommendation for the strongest and most consistent method for identifying proprioceptive deficits in individuals with chronic ankle instability.
Publication Bias
The likelihood of publication bias was assessed with a funnel plot (Figure 9). Based on the relative symmetry and even distribution of studies within the funnel plot, it is unlikely that publication bias played an important role in the results of the meta-analyses. Further analysis using the trim-and-fill method also indicated that publication bias was not a likely influence on the overall result. Results of the Orwin fail-safe N test indicated that a range of 169 to 381 additional studies (based on a trivial effect range of Hedges g of 0.10 to 0.05) would be needed to nullify the overall summary effect. Based on these results, the effect of bias introduced across the studies probably was trivial. If all relevant studies beyond those that we analyzed were included, the effect size probably would remain unchanged.
Figure 9.
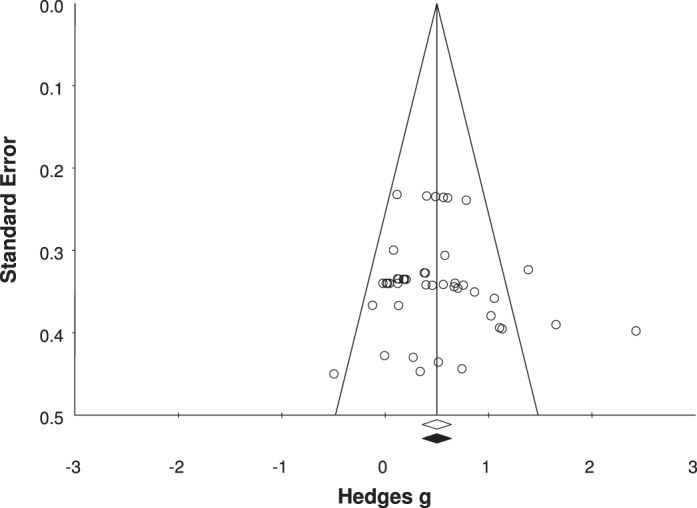
Funnel plot analysis for publication bias.
Sensitivity Analysis
The sensitivity analysis we used to test the stability of the cumulative effect across included studies revealed effect sizes that ranged from 0.46 to 0.52. The lowest lower confidence limit was 0.34, and the highest upper confidence limit was 0.66. All P values for the Z distribution were less than .01. This indicated that 1 particular study did not substantially influence the overall cumulative effect.
DISCUSSION
The purpose of our systematic review was to identify the most precise and consistent JPR variables for identifying proprioceptive deficits in individuals with CAI. Overall, we did not find one particular variable that was more indicative of CAI than the rest. Instead, all 6 variables yielded important differences between participants with and without CAI. The JPR deficits appear to be present across all 6 variables in people with CAI. We are the first to demonstrate that regardless of (1) between-groups or between-limbs comparisons, (2) starting foot position, (3) repositioning method, (4) testing ROM, (5) testing velocity, and (6) data-reduction method, moderate to large deficits appear to be detected consistently in both active and passive JPR in people with CAI. Because all studies included were retrospective, no causal link can be drawn between the deficits noted and the condition of CAI. In the following sections, we discuss the implications of the results and present guidelines for future investigations for identifying JPR deficits in people with CAI.
Between-Groups Versus Within-Group Comparisons
Based on the meta-analysis for this testing variable, both the side-to-side comparison in the CAI group and the between-groups comparison of the CAI group to a matched-control group displayed very large effect sizes with narrow CIs, indicating that the limb or group with CAI had JPR deficits. The pooled effect of the matched-control group studies17,26,28–33 made up comparisons of 151 patients with CAI matched to 124 control participants without CAI. For the side-to-side comparison,17,25–28 86 limbs had CAI and 84 limbs did not have CAI. However, when we looked at the pooled effect sizes for the 2 comparisons, the matched-control group comparison (effect size = 0.49) was similar to the between-limbs comparison (effect size = 0.56). Although both effect sizes were moderate, with CIs that did not cross zero, central changes within the sensorimotor system that occurred due to ankle sprains might be a mediating factor to explain the larger CIs and lower precision for the between-limbs comparison than the between-groups comparison. Evidence exists to suggest that postural-control alterations are present bilaterally in people with unilateral CAI.36 Central changes also might occur in the afferent recognition of limb position in people with unilateral CAI. Based on the available evidence from the 10 studies included in these analyses, both types of testing appear to be reasonable for detecting moderate JPR deficits. However, based on the more precise effect noted in the between-groups comparisons, we recommend that future researchers explore differences between groups rather than between limbs.
Starting Foot Position
The meta-analysis of this testing variable indicates that the neutral position between plantar flexion and dorsiflexion offers the most consistent estimate of JPR deficits in people with CAI. Whereas we found no difference among the measures used across the studies, the neutral position17,25,26,28,30,31,33 was the most common testing position. Based on the qualitative analysis of the range of testing positions from 42° of plantar flexion29 to neutral,33 all demonstrated that people with CAI had JPR deficits with the exception of 10° of plantar flexion. Although 30° of plantar flexion (effect size = 1.25) and 20° of plantar flexion (effect size = 0.73) demonstrated the largest deficits in JPR deficits related to CAI, the neutral position had the most precise CIs. The studies in which researchers used the neutral position comprised the largest number of limbs with CAI and limbs or control participants without CAI. Taking into account the pooled effect size (0.51), the moderate effect with very narrow CIs indicates a real difference between CAI and no-CAI conditions. The magnitude of the real difference continued to increase as participants were moved into the midrange to end range of plantar flexion. This is important to consider because the most common mechanism of injury described for ankle sprains is a combination of inversion and plantar flexion. All other ranges reported were either small to moderate effects or had CIs that crossed zero, indicating a lack of sensitivity and precision for the measurement variable to discriminate between people with and without CAI. Based on the available evidence, the neutral position appears to be the most consistent starting position to use when examining JPR deficits in people with CAI. The addition of plantar flexion in the starting position at the middle to terminal ROMs should continue to be investigated systematically.
Repositioning Method
The meta-analysis on this testing variable indicated that both active17,26,27,29,31,32 and passive17,25,28–30,32,33 repositioning methods can identify JPR deficits in people with CAI. These findings agree with what Munn et al16 found in their meta-analysis of sensorimotor deficits. Active ROM (effect size = 0.57) produced a larger effect than did passive ROM (effect size = 0.46). The moderate effect sizes with CIs that did not cross zero for both types of comparisons indicated that a true difference between no-CAI and CAI conditions exists in these 2 repositioning methods. Although both active and passive repositioning resulted in consistently moderate effects, active repositioning might be the superior method for detecting deficits in people with CAI as indicated by the potential for large effect sizes and CIs. The active repositioning method might take into account the contextual relationship within the sensorimotor pathways that the passive technique does not, namely musculotendinous receptors. The contributing factors associated with the differences between passive and active regarding the magnitude of the effect and size of the CIs need to be explored systematically.
Testing Range of Motion
From the meta-analysis of this measurement variable, plantar flexion and inversion appear to be the 2 ROMs most capable of detecting JPR deficits in people with CAI. The largest effect sizes with the most precision were associated with both inversion and plantar flexion throughout the entire range available in both directions. Dorsiflexion and eversion did not result in large effects; however, end-range dorsiflexion demonstrated a moderate effect with fairly narrow CIs. The finding that plantar-flexion and inversion JPR were most affected was clinically intuitive. These are the 2 motions most commonly associated with ankle sprains.14 Although JPR testing has been performed consistently in a controlled laboratory environment, JPR within these 2 ROMs might be more important to address clinically during rehabilitation of people with CAI. That being said, an important caveat associated with the included studies is that inversion and plantar flexion were the most common ROMs assessed. Deficits in eversion or dorsiflexion in people with CAI might be present, but a paucity of evidence exists to suggest that they do. At this time, it is unclear what types of interventions would best improve JPR deficits or that JPR is a factor in recurrence of ankle sprains. These 2 issues should be explored systematically in the future. Based on the evidence available, the early to midrange of plantar flexion and the midrange of inversion appear to be most affected in people with CAI.
Testing Velocity
Based on the meta-analysis for this measurement variable, the largest effect for detecting JPR deficits in people with CAI was from a velocity less than 2°/s. Although a smaller effect (0.54), the 2°/s to 4°/s testing velocities had narrower CIs that were fully encompassed by the less than 2°/s testing velocity. The range of velocities used,25,32 from less than 2°/s (effect size = 0.72) to 5°/s (effect size = 0.34), demonstrated moderate to large effect sizes with CIs that did not cross zero, indicating deficits in people with CAI. The JPR deficits, regardless of a specific velocity used, appear to be real in people with CAI. One important note on this issue is that Refshauge et al37 found that as movement velocity increased, threshold-to-movement detection decreased. Although they produce substantially greater errors in JPR in both no-CAI and CAI groups, the slower velocities might be necessary to find the largest JPR deficits in people with CAI. As velocity increases, other receptors away from the ankle joint structures, such as muscle spindles, might be called into play and might cloud the ability to detect true joint-receptor deficits of people with CAI. Although the consistency of the measure appears to increase as velocity increases, the ability to discriminate between people with and without CAI appears to decrease. Based on the available evidence, the movement velocity that produces the largest true effects in detecting JPR deficits in people with CAI appears to exist at less than 5°/s.
Data-Reduction Method
Based on the meta-analysis for this measurement variable, most methods of data reduction appear to offer insight into JPR deficits associated with CAI. The only effect size that was small with very wide CIs was the total differences variable.17,29 This indicates that subtle alterations in JPR can be detected using these methods of data reduction. Based on the effect sizes and widths of CIs, examining either the replication error or the differences between the given and reproduced angles might provide the greatest insight into these deficits. However, what remains unclear is whether people with CAI have a tendency to overshoot or undershoot the target angle. The data-reduction method that demonstrated the greatest precision (narrowest CI) was the mean absolute error. The mean absolute error was the most common data-reduction method used across studies. The pooled effect size was moderate but had the potential to yield large effects. Although the replication error and the difference in the reproduced and given angles produced the largest effect sizes, how the investigators reduced the data to generate these variables is unclear. Based on the available evidence, the technique of data reduction that might be most consistent and beneficial in identifying JPR deficits in people with CAI is the mean absolute error method.
Limitations
Our systematic review had several limitations. First, due to the varied inclusion criteria for CAI across the assessed studies, the heterogeneity of participant demographics might limit the ability to apply these findings to a very well-defined population with CAI. However, because this clinical phenomenon is most commonly a self-reported condition, we believe that the heterogeneity of inclusion criteria, coupled with moderate to large effect sizes and narrow CIs across the measurement domains, provides an indication that JPR deficits do exist in this self-reported condition. Second, the methodologic quality across studies was very low. The evidence we presented is level 3, meaning that no causal link can be established between JPR deficits and CAI. Higher-quality studies are needed to determine whether JPR deficits are the cause or the result of CAI. Third, we examined only 1 type of laboratory measure that has been used to assess proprioceptive deficits in people with CAI. We did not include other measures, such as threshold to detection, in this review. The variables we specified in this review can be generalized only to methods that use active or passive joint repositioning at the ankle. Fourth, within each measurement variable, multiple measures with varied instrumentation constitute the dependent variables of interest. As a result, we cannot specify any one type of JPR testing that would be better than another. However, from this systematic review, we can make recommendations based on the level 3 evidence about how to progress in this line of study in the future.
The assessment of proprioceptive deficits in people with CAI does not present immediate clinical relevance. Several issues are inherent to the methods that limit the face value of the results from these types of studies. Specifically, testing velocity is typically far slower than the angular velocity associated with an ankle sprain. In addition, the test positions usually involve postures and positions that are not related to the mechanism of injury other than the orientation of the talocrural and subtalar joints. With these clinical limitations in mind, we still do not know how subtle deficits in proprioception translate to substantial reductions in functional capacity in people with CAI.36,38 Based on this systematic review, deficits in JPR can be detected between people with and without CAI. The effect that these deficits have on the functional capacity of people with this condition is not fully understood. The clinical relevance of JPR deficits might be elucidated when combined with patient-oriented and clinician-oriented assessment tools in future studies. Future researchers investigating proprioceptive deficits in those with CAI should continue to assess JPR.
CONCLUSIONS
We make several recommendations for future researchers. Based on level 3 evidence, we recommend that investigators studying JPR deficits associated with CAI should use the following measurement variables:
-
1.
Compare JPR measures between groups with and without CAI.
-
2.
During testing, the starting position of the foot should be between neutral and 30° of plantar flexion.
-
3.
The active repositioning method is the most appropriate to use; however, passive repositioning has its benefits and can be explored further.
-
4.
Early to midrange plantar flexion and the full range of inversion are the 2 directions that should be used. A combination of the 2 has not been explored, but we recommend investigating it systematically.
-
5.
The repositioning velocity for testing should be less than 5°/s. Larger effects become more apparent as testing velocity decreases.
-
6.
The most consistent data-reduction method for JPR testing is the calculation of the mean absolute error across at least 2 test trials.
Level 3 evidence suggested that people with CAI display consistent JPR deficits when compared with people without CAI. Due to the consistency of the findings across the measurement variables, the strength of recommendation35 that JPR should be considered as a tool for identifying kinesthetic deficits in people with CAI is B. Further study at higher levels of evidence is warranted in the investigation of proprioceptive deficits associated with JPR in people with CAI.
REFERENCES
- 1.Fernandez WG, Yard EE, Comstock RD. Epidemiology of lower extremity injuries among U.S. high school athletes. Acad Emerg Med. 2007;14(7):641–645. doi: 10.1197/j.aem.2007.03.1354. [DOI] [PubMed] [Google Scholar]
- 2.Hootman JM, Dick R, Agel J. Epidemiology of collegiate injuries for 15 sports: summary and recommendations for injury prevention initiatives. J Athl Train. 2007;42(2):311–319. [PMC free article] [PubMed] [Google Scholar]
- 3.Almeida SA, Williams KM, Shaffer RA, Brodine SK. Epidemiological patterns of musculoskeletal injuries and physical training. Med Sci Sports Exerc. 1999;31(8):1176–1182. doi: 10.1097/00005768-199908000-00015. [DOI] [PubMed] [Google Scholar]
- 4.Fong DT, Hong Y, Chan LK, Yung PS, Chan KM. A systematic review on ankle injury and ankle sprain in sports. Sports Med. 2007;37(1):73–94. doi: 10.2165/00007256-200737010-00006. [DOI] [PubMed] [Google Scholar]
- 5.Powell JW, Barber-Foss KD. Injury patterns in selected high school sports: a review of the 1995–1997 seasons. J Athl Train. 1999;34(3):277–284. [PMC free article] [PubMed] [Google Scholar]
- 6.Kannus P, Renstrom P. Treatment for acute tears of the lateral ligaments of the ankle: operation, cast, or early controlled mobilization. J Bone Joint Surg Am. 1991;73(2):305–312. [PubMed] [Google Scholar]
- 7.Soboroff SH, Pappius EM, Komaroff AL. Benefits, risks, and costs of alternative approaches to the evaluation and treatment of severe ankle sprain. Clin Orthop Relat Res. 1984;183:160–168. [PubMed] [Google Scholar]
- 8.Verhagen RA, de Keizer G, van Dijk CN. Long-term follow-up of inversion trauma of the ankle. Arch Orthop Trauma Surg. 1995;114(2):92–96. doi: 10.1007/BF00422833. [DOI] [PubMed] [Google Scholar]
- 9.Praemer A, Furner S, Rice DP. Musculoskeletal Conditions in the United States. Rosemont, IL: American Academy of Orthopaedic Surgeons; 1999. [Google Scholar]
- 10.Beynnon BD, Murphy DF, Alosa DM. Predictive factors for lateral ankle sprains: a literature review. J Athl Train. 2002;37(4):376–380. [PMC free article] [PubMed] [Google Scholar]
- 11.Anandacoomarasamy A, Barnsley L. Long term outcomes of inversion ankle injuries. Br J Sports Med. 2005;39(3) doi: 10.1136/bjsm.2004.011676. e14. [DOI] [PMC free article] [PubMed] [Google Scholar]
- 12.Smith RW, Reischl SF. Treatment of ankle sprains in young athletes. Am J Sports Med. 1986;14(6):465–471. doi: 10.1177/036354658601400606. [DOI] [PubMed] [Google Scholar]
- 13.Peters JW, Trevino SG, Renstrom PA. Chronic lateral ankle instability. Foot Ankle. 1991;12(3):182–191. doi: 10.1177/107110079101200310. [DOI] [PubMed] [Google Scholar]
- 14.Hertel J. Functional anatomy, pathomechanics, and pathophysiology of lateral ankle instability. J Athl Train. 2002;37(4):364–375. [PMC free article] [PubMed] [Google Scholar]
- 15.Freeman MA, Dean MR, Hanham IW. The etiology and prevention of functional instability of the foot. J Bone Joint Surg Br. 1965;47(4):678–685. [PubMed] [Google Scholar]
- 16.Munn J, Sullivan SJ, Schneiders AG. Evidence of sensorimotor deficits in functional ankle instability: a systematic review with meta-analysis. J Sci Med Sport. 2010;13(1):2–12. doi: 10.1016/j.jsams.2009.03.004. [DOI] [PubMed] [Google Scholar]
- 17.Gross MT. Effects of recurrent lateral ankle sprains on active and passive judgments of joint position. Phys Ther. 1987;67(10):1505–1509. doi: 10.1093/ptj/67.10.1505. [DOI] [PubMed] [Google Scholar]
- 18.Delahunt E, Monaghan K, Caulfield B. Altered neuromuscular control and ankle joint kinematics during walking in subjects with functional instability of the ankle joint. Am J Sports Med. 2006;34(12):1970–1976. doi: 10.1177/0363546506290989. [DOI] [PubMed] [Google Scholar]
- 19.Drewes LK, McKeon PO, Paolini G, et al. Altered ankle kinematics and shank-rear-foot coupling in those with chronic ankle instability. J Sport Rehabil. 2009;18(3):375–388. doi: 10.1123/jsr.18.3.375. [DOI] [PubMed] [Google Scholar]
- 20.Monaghan K, Delahunt E, Caulfield B. Ankle function during gait in patients with chronic ankle instability compared to controls. Clin Biomech (Bristol, Avon) 2006;21(2):168–174. doi: 10.1016/j.clinbiomech.2005.09.004. [DOI] [PubMed] [Google Scholar]
- 21.Delahunt E, Monaghan K, Caulfield B. Changes in lower limb kinematics, kinetics, and muscle activity in subjects with functional instability of the ankle joint during a single leg drop jump. J Orthop Res. 2006;24(10):1991–2000. doi: 10.1002/jor.20235. [DOI] [PubMed] [Google Scholar]
- 22.Downs SH, Black N. The feasibility of creating a checklist for the assessment of the methodological quality both of randomised and non-randomised studies of health care interventions. J Epidemiol Community Health. 1998;52(6):377–384. doi: 10.1136/jech.52.6.377. [DOI] [PMC free article] [PubMed] [Google Scholar]
- 23.von Elm E, Altman DG, Egger M, et al. The Strengthening the Reporting of Observational Studies in Epidemiology (STROBE) statement: guidelines for reporting observational studies. J Clin Epidemiol. 2008;61(4):344–349. doi: 10.1016/j.jclinepi.2007.11.008. [DOI] [PubMed] [Google Scholar]
- 24.Borenstein M, Hedges LV, Higgins JPT, Rothstein HR. Introduction to Meta-Analysis. Chichester, UK: Wiley & Sons Ltd; 2009. pp. 25–30. [Google Scholar]
- 25.Fu AS, Hui-Chan CW. Ankle joint proprioception and postural control in basketball players with bilateral ankle sprains. Am J Sports Med. 2005;33(8):1174–1182. doi: 10.1177/0363546504271976. [DOI] [PubMed] [Google Scholar]
- 26.Konradsen L, Magnusson P. Increased inversion angle replication error in functional ankle instability. Knee Surg Sports Traumatol Arthrosc. 2000;8(4):246–251. doi: 10.1007/s001670000124. [DOI] [PubMed] [Google Scholar]
- 27.Nakasa T, Fukuhara K, Adachi N, Ochi M. The deficit of joint position sense in the chronic unstable ankle as measured by inversion angle replication error. Arch Orthop Trauma Surg. 2008;128(5):445–449. doi: 10.1007/s00402-007-0432-6. [DOI] [PubMed] [Google Scholar]
- 28.Santos MJ, Liu W. Possible factors related to functional ankle instability. J Orthop Sports Phys Ther. 2008;38(3):150–157. doi: 10.2519/jospt.2008.2524. [DOI] [PubMed] [Google Scholar]
- 29.Boyle J, Negus V. Joint position sense in the recurrently sprained ankle. Aust J Physiother. 1998;44(3):159–163. doi: 10.1016/s0004-9514(14)60375-5. [DOI] [PubMed] [Google Scholar]
- 30.Brown C, Ross SE, Mynark R, Guskiewicz KM. Assessing functional ankle instability with joint position sense, time to stabilization, and electromyography. J Sport Rehabil. 2004;13(2):122–134. [Google Scholar]
- 31.Jerosch J, Bischof M. Proprioceptive capabilities of the ankle in stable and unstable joints. Sports Exerc Injury. 1996;2(4):167–171. [Google Scholar]
- 32.Willems T, Witvrouw E, Verstuyft J, Vaes P, De Clercq D. Proprioception and muscle strength in subjects with a history of ankle sprains and chronic instability. J Athl Train. 2002;37(4):487–493. [PMC free article] [PubMed] [Google Scholar]
- 33.Yokoyama S, Matsusaka N, Gamada K, Ozaki M, Shindo H. Position-specific deficit of joint position sense in ankles with chronic functional instability. J Sports Sci Med. 2008;7(4):480–485. [PMC free article] [PubMed] [Google Scholar]
- 34.Cohen J. Statistical Power Analysis for the Behavioral Sciences. 2nd ed. Hillsdale, NJ: Lawrence Erlbaum Associates Inc; 1988. [Google Scholar]
- 35.Phillips B, Ball C, Sackett D, et al. Oxford Centre for Evidence-Based Medicine Levels of Evidence. 2008 Apr; http://www.cebm.net/index.aspx?o=1025. Accessed. [Google Scholar]
- 36.Hertel J. Sensorimotor deficits with ankle sprains and chronic ankle instability. Clin Sports Med. 2008;27(3):353–370. doi: 10.1016/j.csm.2008.03.006. vii. [DOI] [PubMed] [Google Scholar]
- 37.Refshauge KM, Raymond J, Kilbreath SL, Pengel L, Heijnen I. The effect of ankle taping on detection of inversion-eversion movements in participants with recurrent ankle sprain. Am J Sports Med. 2009;37(2):371–375. doi: 10.1177/0363546508324309. [DOI] [PubMed] [Google Scholar]
- 38.Hoch MC, McKeon PO. Integrating contemporary models of motor control and health in chronic ankle instability: a review of the literature. Athl Train Sports Health Care. 2010;2(2):82–88. [Google Scholar]


