

Abstract
MicroRNAs (miRNAs) are endogenously expressed small RNAs that regulate expression of mRNAs at the post-transcriptional level. The consequence of miRNA regulation is hypothesized to reduce the expression variation of target genes. However, it is possible that mutations in miRNAs and target sites cause rewiring of the miRNA regulatory networks resulting in increased variation in gene expression. By examining variation in gene expression patterns in human populations and between human and other primate species, we find that miRNAs have stabilized expression of a small number of target genes during primate evolution. Compared with genes not regulated by miRNAs, however, genes regulated by miRNAs overall have higher expression variation at the population level, and they display greater variation in expression among human ethnic groups or between human and other primate species. By integrating expression data with genotypes determined in the HapMap 3 and the 1000 Genomes Projects, we found that expression variation in miRNAs, genetic variants in miRNA loci, and mutations in miRNA target sites are important sources of elevated expression variation of miRNA target genes. A reasonable case can be made that natural selection is driving this pattern of variation.
“Canalization” is a term that was coined to describe the ability of living organisms to buffer against phenotypic variation, despite ubiquitous environmental or genotypic perturbations (Waddington 1942, 1953, 1956). MicroRNAs (miRNAs) have recently been postulated to be regulators of gene expression canalization (Hornstein and Shomron 2006; Cui et al. 2007; Li et al. 2009; Wu et al. 2009). Several lines of evidence allow tests of this idea, and here we consider the role of miRNAs in canalization of gene expression in humans.
MiRNAs are endogenously expressed, single-stranded RNAs that are ∼22 nucleotides (nt) long and regulate mRNA abundance post-transcriptionally (Ambros 2003; Wienholds and Plasterk 2005; Zamore and Haley 2005; Carthew 2006; Kim and Nam 2006; Sevignani et al. 2006). In animals, miRNAs bind complementary sequences of target mRNAs to cause degradation (Bagga et al. 2005; Guo et al. 2010) and/or translation repression (Olsen and Ambros 1999; Doench et al. 2003). One miRNA usually targets more than 100 genes (Enright et al. 2003; Stark et al. 2003; John et al. 2004; Rajewsky and Socci 2004; Brennecke et al. 2005; Grun et al. 2005; Lewis et al. 2005). A gene may, in turn, be regulated by multiple miRNAs (Enright et al. 2003; Lewis et al. 2003, 2005; John et al. 2004; Rajewsky 2006). Given the large number of miRNAs annotated in the human genome, 30%–80% of human genes are predicted to be influenced by miRNAs (Enright et al. 2003; Stark et al. 2003; John et al. 2004; Rajewsky and Socci 2004; Brennecke et al. 2005; Grun et al. 2005; Lewis et al. 2005; Friedman et al. 2009). The comprehensive interactions between miRNAs and protein-coding genes are expected to be sufficiently tightly regulated as to comprise “wired” genetic networks (Hornstein and Shomron 2006). Basic modules inside the regulatory networks consist of coherent and incoherent feed-forward loops (Fig. 1A,B) that are hypothesized to reduce the stochastic noise in expression and translation of the target genes (Hornstein and Shomron 2006; Li et al. 2009; Wu et al. 2009). These proposed canalization effects of miRNA regulation are supported by systems biology simulations (Osella et al. 2011) and by observations that miRNA deletions and mutations are often associated with disease, cancer, or phenotypic abnormalities (Bartel 2004, 2009; He and Hannon 2004; Sokol and Ambros 2005; Calin and Croce 2006; Esquela-Kerscher and Slack 2006; Li et al. 2006; Ghildiyal and Zamore 2009), yet miRNA knockouts often result in only subtle phenotypic effects (Miska et al. 2007).
Figure 1.

Scheme for a canonical miRNA regulation network. The comprehensive interactions between miRNAs and transcription factors (TF) are expected to comprise “wired” genetic networks to regulate the expression of target genes. (A,B) Examples of incoherent and coherent feed-forward loops, respectively. In the incoherent feed-forward loop, the direct regulatory effect of a TF on the target gene is opposed to the indirect regulatory effect through miRNA regulation (A); and in the coherent feed-forward loops, the direct regulatory effect of a TF on the target gene is synergistic to the indirect regulatory effect through miRNA regulation (B). The consequence of miRNA regulatory effects is to reduce the stochastic noise in expression levels of target genes. (C,D) Distributions of expression levels (the x-axis is the number of molecules per cell) of two hypothetical target genes across cells (or individuals). (C) Expression levels of the target gene are tightly regulated due to miRNA targeting; (D) expression levels of a gene not targeted by miRNAs are highly variable across individuals. (E,F) Six sources of genetic variation in the miRNA regulatory networks. (E) The scheme of a miRNA precursor characterized by a hairpin structure. The sequence in black is the mature miRNA (guide strand) and position 2–8 of mature miRNA is the “seed” region (underlined). Perfect pairing between the seed of the mature miRNA and the target site is crucial for miRNA target recognition (F). Mutations associated with a miRNA precursor can be divided into four categories: (1) mutations in the “seed” alter the target recognition; (2) changes in the mature miRNA beyond the “seed” region potentially affect target recognition; (3) changes outside mature miRNAs can affect miRNA biogenesis and hence affect the abundance of the mature miRNA; and (4) changes in promoter regions of the miRNA precursor will cause the abundance of mature miRNA to be variable (E). Mutations in miRNA target pairing regions also affect miRNA binding: (5) Mutations in the seed pairing region of a miRNA will affect the target recognition and hence the expression level of the host genes; and (6) mutations in regions of 3′ UTR beyond seed pairing might affect the accessibility of a miRNA to the target site. In our model, genetic variation in the former four classes is defined as the “trans-regulatory” effect, and variation in the latter two classes is defined as the “cis-regulatory” effect. Both trans- and cis-regulatory effects in the miRNA regulatory networks contribute to the expression variation of the target genes.
Nevertheless, little is known about the canalization effects of miRNAs in natural populations. Many studies have documented extensive natural variation of gene expression, and the expression patterns of individual genes can be treated as quantitative phenotypes, i.e., eQTL (Stranger et al. 2005, 2007a,b; Blekhman et al. 2010; Idaghdour et al. 2010; Pickrell et al. 2010). Since one crucial function of miRNAs is to fine-tune (canalize) the expression levels of target genes (Bartel and Chen 2004; Hornstein and Shomron 2006; Li et al. 2009), the miRNA canalization framework predicts that protein-coding genes will have lower expression noise (or reduced variation across individuals in the population) when they are targeted by miRNAs (the model is presented in Fig. 1C,D). Previous studies, based on limited data, have reached mixed conclusions on this question. Cui et al. (2007) found that miRNA regulation reduces gene expression divergence between human and chimpanzee, while Zhang and Su (2008) observed higher variation of miRNA target genes in the brains of a European-American population.
In this study, we propose that at least six classes of genetic variation in miRNA targeting networks would affect gene expression levels. Mutations in a miRNA precursor can be divided into four categories based on their potential impacts on target recognition and miRNA biogenesis (Fig. 1E). Genetic variants in miRNA target sites in the 3′ UTRs affect miRNA target recognition, and mutations in other regions of 3′ UTRs potentially affect the accessibility of a target site to a miRNA (Fig. 1F). Here we investigate the regulatory effects of miRNAs on human gene expression by examining expression patterns of protein-coding genes across six high-throughput data sets. For each gene, we calculated the CV (coefficient of variation in expression) to quantify the extent of expression variation with the formula
This metric has several desirable properties to quantify variation of gene expression levels and has been well justified in previous studies (Meiklejohn et al. 2003; Kaern et al. 2005; Zhang and Su 2008).
To obtain an overview of the effect of miRNA targeting on gene expression variation, we first compare the variability in expression levels of miRNA target genes vs. non-target genes. Next, we dissect the trans-effects of miRNAs and cis-effects of miRNA target sites on gene expression variation. Finally, we explore the impact of miRNA regulation on human evolution.
Results
Empirically determined miRNA-correlated genes have elevated expression variation (CV) in human populations
The canonical miRNA regulation model postulates that miRNAs repress expression of target genes (Bartel 2009). Under this simple repression model, one expects a negative correlation between the expression levels of miRNAs and their respective target genes. Nevertheless, the miRNA wiring networks will generate complex expression patterns, causing either positive or negative correlations between miRNAs and target genes (Tang et al. 2010; Huang et al. 2011a). Wang et al. (2009) measured expression levels of miRNAs and mRNAs in lymphoblastoid cell lines of 90 European-American males. At an FDR of 0.01, the authors identified ∼7200 mRNA–miRNA significantly correlated pairs, including 981 mRNAs exclusively negatively correlated with at least one miRNA (denoted as neg), 1023 mRNAs exclusively positively correlated with one or more miRNAs (pos), 414 mRNAs that positively and negatively correlated with multiple miRNAs (negpos), and 11,754 genes that were not significantly correlated with any miRNA (non) (Wang et al. 2009).
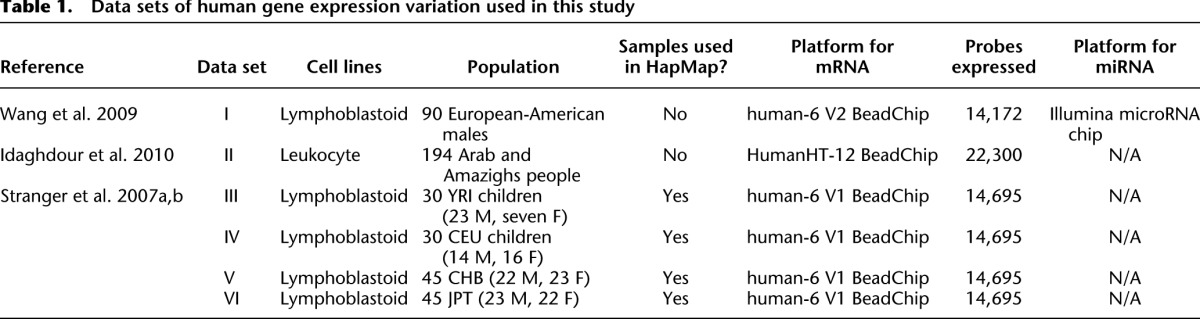
We conducted a CV analysis of the ∼14,000 mRNA transcripts that were expressed in the 90 European-American males (denoted as data set I; for details, see Table 1 and Methods). The CV values range from 0.37 to 26.30, with a median of 2.23 and a standard deviation of 1.70 (Supplemental Fig. S1A). Relative to transcripts with expression levels not associated with any miRNA, the CV is significantly higher in transcripts that are associated with miRNA expression—the median CV is 2.13, 2.54, 2.91, and 3.03 for the non, neg, pos, and negpos classes, respectively (P < 10−16 for all the three pairwise comparisons, Kolmogorov-Smirnov [KS] tests) (Supplemental Fig. S1B). Therefore, our CV analyses of the empirically correlated miRNA:mRNA pairs suggest that miRNA targeting is coupled with increased gene expression variability, and this observed pattern is contradictory to the hypothesized canalization effects of miRNAs.
Table 1.
Data sets of human gene expression variation used in this study
Direct target genes of miRNAs show higher expression variation
A potential pitfall in the above comparisons is that the expression correlation method tends to pick up mRNAs with high CVs while it neglects those with low expression variation. In other words, the higher expression variation of miRNA-correlated mRNAs might be caused by ascertainment bias but not biological factors. To exclude this possibility, we evaluated the expression variability of miRNA target genes based on in silico predictions and experimental validations.
Among the 366 putative miRNAs with expression detected by the miRNA microarrays (Wang et al. 2009), we remapped 287 of them on miRNAs annotated in miRBase V14 and V15 (Methods). We used four current in silico miRNA target prediction algorithms to identify conserved targets, including TargetScan based on conservation (TSs) (Lewis et al. 2005; Grimson et al. 2007; Friedman et al. 2009), Pictar (Krek et al. 2005), miRanda (John et al. 2004), and PITA (Kertesz et al. 2007). We also used the Context Score in the TargetScan package (TSt) to identify non-conserved miRNA targets of conserved miRNAs and targets of non-conserved miRNAs (Grimson et al. 2007; Baek et al. 2008).
With each of the five algorithms, we consistently found evidence that mRNAs targeted by miRNAs have significantly higher CVs than non-target transcripts in the 90 European-American males (Fig. 2A). The same pattern is also observed if we consider the 1078 target genes of coexpressed miRNAs that were experimentally verified by previous studies (P = 10−8, KS test) (Fig. 2A). The pattern is more pronounced if we combine the miRNA target determination methods—the coefficient of expression in variation (CV) of the 8902 high-confidence miRNA target transcripts is significantly higher than that of the 4833 non-target genes (the median CV is 2.32 vs. 2.05 for high-confidence vs. non-targets, P < 10−16, KS test; high-confidence targets are defined in Methods) (Fig. 2B). Interestingly, the 283 target genes determined by all six methods (five prediction algorithms plus experimental verification) have the highest expression variation in the 90 European-American males, with a median CV of 2.43, ∼18% higher than the median CV of the non-target genes (P = 10−10, KS test).
Figure 2.

Expression variability (CV) in the lymphoblastoid cells is significantly higher for genes that are targeted by the coexpressed 287 miRNAs, regardless of target determination methods. (A) The results for data set I (Wang et al. 2009); (TSs) TargetScan with conservation (PCT > 0.8); (TSt) context score (≤0.4 and percentile >85); (Verified) experimentally verified targets taken from TarBase, miR2Disease, and Hafner et al. (2010). (B) The results after combining miRNA target determination methods together. (High-confidence miRNA targets) Only targets determined by TSs (PCT > 0.8); (TSt) (≤0.4 and percentile >85), Pictar, or experimentally verified targets of the 287 coexpressed miRNAs; (Non-targets) transcripts that are not targeted by the 287 coexpressed miRNAs with any of the miRNA target determination methods (including the four aforementioned methods, PITA, and miRanda algorithms). Boxplots of CVs for targets (gray) and non-target transcripts (white) are presented.
Next, we expanded our analysis to another five large-scale gene expression data sets as summarized in Table 1. We assume that the same set of miRNAs in data set I (Wang et al. 2009) is also expressed in these lymphoblastoid/leukocyte cell samples. There is evidence that expression levels of miRNAs are highly variable in lymphoblastoid cells from different human individuals (Wang et al. 2009; Huang et al. 2011b); however, the expression patterns of miRNAs in terms of “present” and “absent” are highly conserved between lymphoblastoid cells from various sources (detailed comparisons are presented in the Supplemental Materials).
The second data set measures expression levels of ∼16,700 mRNA transcripts (22,300 microarray probes) in 194 healthy Arab and Amazigh individuals (Idaghdour et al. 2010). With each of the five miRNA target prediction methods, we also observe significantly higher CVs in transcripts that are targeted by the coexpressed miRNAs than in non-target transcripts (P < 10−16 in all the five comparisons) (Supplemental Fig. S2A). In each comparison, the expression variability (CV) of miRNA target transcripts is ∼10% higher than that of non-miRNA targets. For the 1504 microarray probes mapping on transcripts that are targeted by the coexpressed miRNAs with experimental evidence (for details, see Methods), we also observed ∼10% increase in variability of gene expression (P < 10−16, KS test) (Supplemental Fig. S2A). For the 8472 transcripts that are targeted by none of the 287 miRNAs, the median variability is 2.72, significantly lower than the corresponding value (3.24) of the high-confidence miRNA targets (P < 10−16, KS test) (data set II in Fig. 2B). Consistent with data set I, the 388 miRNA targets predicted with all five methods and confirmed by experimental verification have an even higher median expression variability of 3.36, the highest of all of the categories.
The third through sixth data sets are expression profiles of mRNAs from lymphoblastoid cell lines of four populations in the HapMap Project: YRI (Yoruba in Ibadan), CEU (CEPH Utah), CHB (Han Chinese in Beijing), and JPT (Japanese in Tokyo). Extensive expression studies have identified ∼15,000 mRNA transcripts that are expressed in these samples in previous studies (Stranger et al. 2005, 2007a,b). For each population, we observed the same pattern as in the data set I and II, i.e., the miRNA target genes determined by either in silico prediction or experimental verification, on average have higher variability than the non-targets (see Supplemental Fig. S2B–E for data sets III, IV, V, and VI). We also found that the CVs of the high-confidence target genes are significantly higher than those of the non-target genes in each of the four data sets (Fig. 2B).
Therefore, our gene expression variation comparisons based on various miRNA target determination methods also indicate that miRNA targeting is significantly associated with elevated expression variation.
Synergistic effects of miRNA regulation
Since the 3′ UTR of an mRNA often harbors multiple sites that are targeted by miRNAs, there is often a synergistic effect of miRNA targeting (Bartel 2009). miRNAs exert synergistic regulatory effects through two mechanisms: (1) biological synergism: a 3′ UTR having target sites to multiple miRNAs; and (2) mechanistic synergism: a 3′ UTR with multiple target sites (to either the same or different miRNAs) that are spaced less than ∼50 nt and the cooperative repression effects on these sites are greater than pairs of sites spaced far apart. In the miRNA target-prediction algorithms applied in the above section, we dichotomized mRNA transcripts by binning “miRNA target” vs. “non-target” and did not account for the cooperative effects of miRNAs or target sites. In the following, we show that the CV of target genes is also affected by synergistic effects of miRNA regulation.
To make our model simple, we neglected the possible nonlinear synergistic effects of target sites and assumed that the target sites have linear and additive repressive effects. We also combined miRNAs with the same “seed” (position 2–8 of a miRNA) (see Fig. 1E,F) into one distinct family. For each mRNA, we first identified the putative miRNA target sites predicted by TargetScan (Context Score ≤ 0.3) and grouped overlapping miRNA:mRNA pairings based on “seed” information. The number of distinct miRNA target sites within mRNA 3′ UTRs varies from 0 to 14 (the small number of mRNAs with >14 sites were binned into the class with 14). In each of the six data sets, we grouped mRNAs based on the number of target sites for the miRNAs that are expressed in the lymphoblastoid cells. We found a strong positive correlation between the number of miRNA-interacting sites and the median CV value of that transcript group, with a Pearson correlation coefficient (r) varying from 0.73 to 0.91 (Fig. 3A,B; Supplemental Fig. S3). Because Context Score (TSt) identifies both the conserved and non-conserved miRNA target sites, we next separately considered these patterns for conserved miRNA target sites. Not surprisingly, the number of conserved target sites in each transcript is generally smaller than the number of sites predicted by the context score, which varies from 0 to 5 (based on a TargetScan PCT score cutoff of 0.8; a small number of mRNAs have more than five sites, and they were binned into five). Nevertheless, we still observed a strong positive correlation between the number of conserved miRNA target sites and gene expression variability (Pearson r between 0.61 and 0.90 across the six data sets; four are statistically significant, and two are marginally significant, probably due to the small number of classes) (Fig. 3C,D; Supplemental Fig. S3). In short, the synergistic miRNA targeting effects further support the trend that stronger miRNA regulation is associated with greater interindividual variation in gene expression.
Figure 3.

The magnitude of the miRNA regulation effect is positively associated with gene expression variability. In each plot, the x-axis is the number of target sites. (A,B) The number of the putative miRNA target sites predicted by TSt (context score ≤ 0.3) and the median CV for the transcripts in data sets I and II. The number of distinct miRNA target sites that are harbored in an mRNA 3′ UTR varies from 0 to 14 (a small number of mRNAs have >14 sites and are binned into 14). (C,D) The number of conserved miRNA-interacting sites (based on TSs PCT > 0.8) and the median CV of the genes. The number of conserved target sites located in one transcript is generally smaller than the number of sites predicted by context score, and varies from 0 to 5 (a small number of mRNAs have more than five sites and are binned into five). Only microarray probes that are mapped on the RefSeq genes are used in the two data sets.
The trans-acting effects of miRNAs on the expression variation of targets
Changes in miRNA loci affect expression patterns of target genes through diverse trans-acting mechanisms (Fig. 1A). To comprehensively characterize mutations in human miRNA loci, we surveyed genetic variants determined in the HapMap 3 and 1000 Genomes Projects (The 1000 Genomes Project Consortium 2010; The International HapMap 3 Consortium 2010). Among the 1.6 million non-redundant SNPs (single nucleotide polymorphisms) genotyped in the HapMap 3 Project, we identified 21 SNPs located inside miRNA precursors (Supplemental Table S1). Of the 36.8 million SNPs and 3.8 million indels (insertion and deletions) identified in the 1000 Genomes Project, we found 594 genetic variants (540 SNPs and 54 indels) located inside miRNA loci, including 54 variants in “seed” regions (position 2–8 of mature miRNAs), 115 variants in mature miRNAs outside of “seed” regions, and 425 variants in miRNA precursors outside of mature miRNAs or spanning entire miRNA loci (Supplemental Table S2). In the global human population sample (1092 human individuals in the 1000 Genomes Project), >50% of the genetic variants (SNPs and indels) have a minor allele frequency <0.5% (Supplemental Fig. S4), consistent with previous observations (Xie et al. 2005; Chen and Rajewsky 2006; Saunders et al. 2007) and with the suggestion that they are somewhat deleterious.
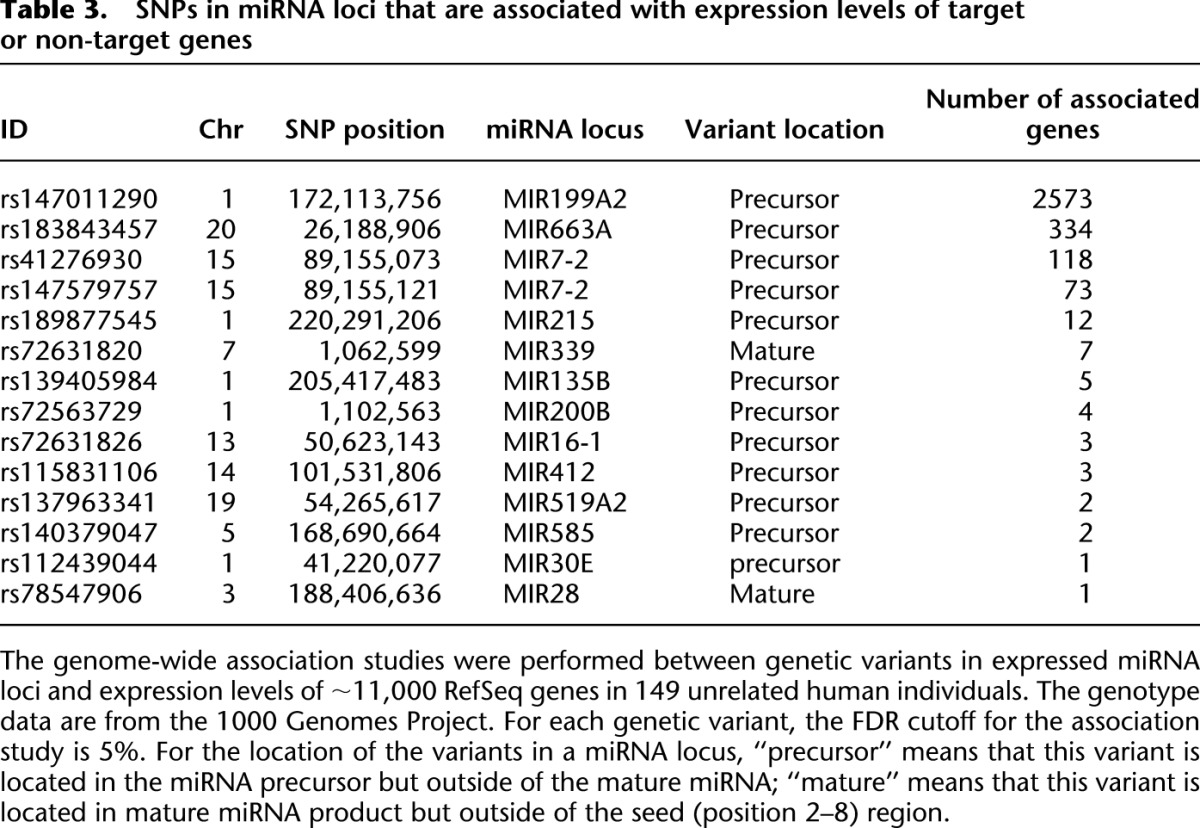
To evaluate the regulatory impact of the miRNA-related genetic variants on variation of transcriptomes in human populations, we used a compressed mixed linear model (Zhang et al. 2010) and performed tests of genome-wide association between these mutations and expression levels of mRNAs (detailed analysis procedures are fully described in Methods). Among samples of 1092 individuals that were sequenced in the 1000 Genomes Project Phase 1, 149 samples have mRNA expression data quantified by Stranger et al. (2007b), including samples from 32 unrelated CEU, 41 unrelated CHB, 39 unrelated JPT, and 37 YRI individuals. There are 322 genetic variants in miRNA loci that are segregating in the 149 individuals, and 94 of them are located in miRNA loci expressed in lymphoblastoid cells (Supplemental Fig. S4E,F). We identified six SNPs and indels in miRNA loci that are significantly associated with at least one of the putative target genes (FDR cutoff 10%) (Table 2). We also identified 14 SNPs/indels in miRNA loci that are significantly associated with the expression levels of at least one gene, either through direct or indirect targeting mechanisms (FDR cutoff 5%) (Table 3). Interestingly, nearly all of the miRNA-oriented variants that are associated with mRNA expression levels are located outside of the “seed” regions (Tables 2, 3), suggesting that they might not directly affect target recognition. Since these mutations potentially affect miRNA biogenesis, it is likely that these mutations affect target genes by changing the abundance of mature miRNAs.
Table 2.
SNPs in miRNA loci that are associated with expression levels of target genes
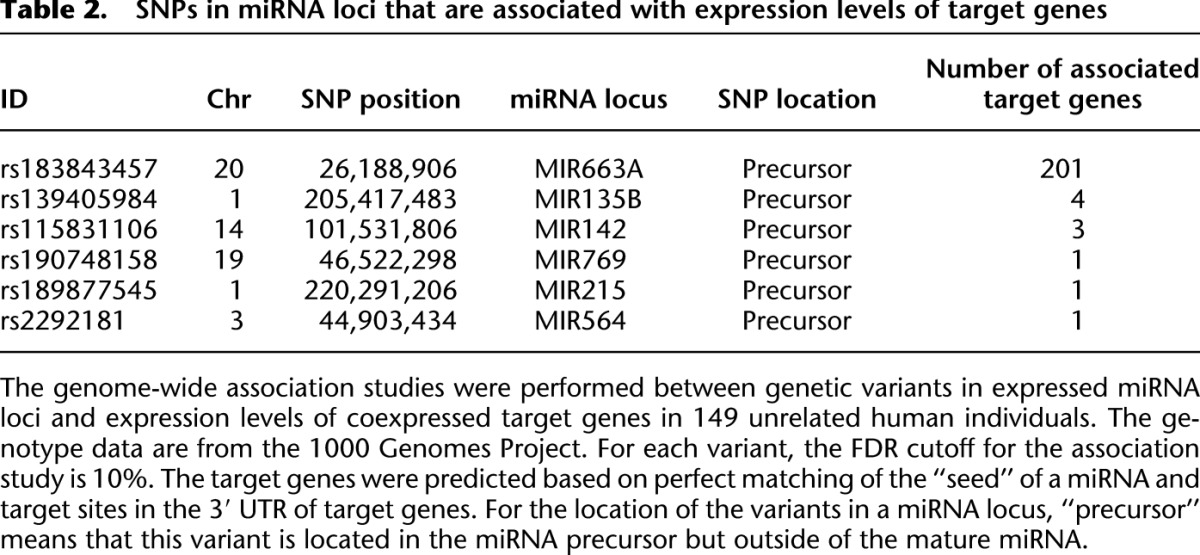
Table 3.
SNPs in miRNA loci that are associated with expression levels of target or non-target genes
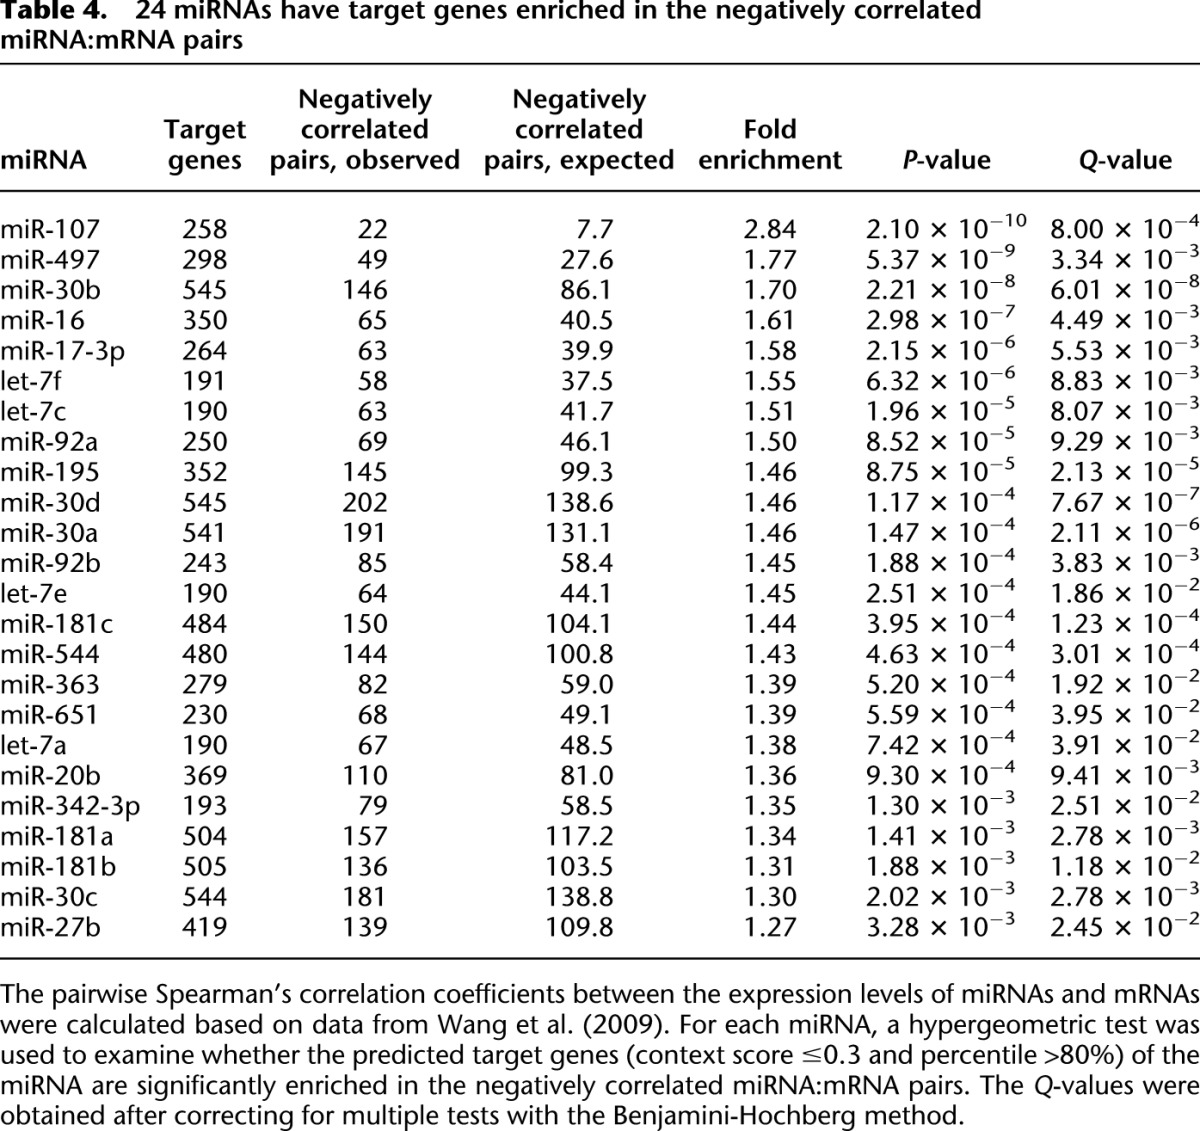
The associations noted above motivate us to ask whether variation in expression (abundance) of miRNAs affects expression patterns of target genes. It is notable that expression levels of miRNAs vary greatly in natural human populations (Wang et al. 2009; Borel et al. 2011). In Supplemental Figure S5, we show that in lymphoblastoid cells of 90 European-American males (Wang et al. 2009), the expressed miRNAs have a very similar distribution of CV as the ∼14,000 coexpressed mRNAs—the median CV of miRNAs is 2.75, which is slightly higher than that of mRNAs. Thus we calculated pairwise Spearman correlation coefficients between expression levels of miRNAs and mRNAs in the 90 European-American males that are quantified in Wang et al. (2009). After correcting for multiple tests at an FDR of 0.05, we identified 365,920 miRNA:mRNA pairs that are negatively correlated (287 miRNAs and 10,765 Ensembl genes were used in the correlation analysis). For each miRNA, we used a hypergeometric test to determine whether the predicted target genes of the miRNA (context score ≤ 0.3 and percentile > 80%) are significantly enriched in the negatively correlated miRNA:mRNA pairs. After multiple test corrections, we identified 24 miRNAs that have targets significantly enriched in the negatively correlated miRNA:mRNA pairs (Table 4). We also found that 15 of the 24 miRNAs are significantly negatively correlated with at least one experimentally verified target gene (Supplemental Table S3).
Table 4.
24 miRNAs have target genes enriched in the negatively correlated miRNA:mRNA pairs
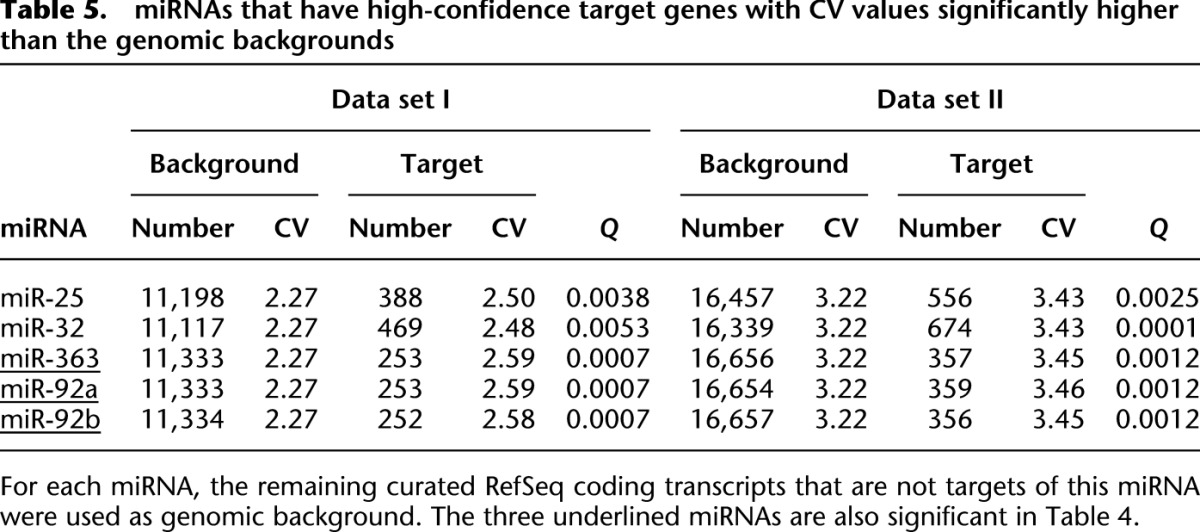
In an alternative approach, we aimed to identify miRNAs with target genes that have significantly different CV values from the genome-wide backgrounds. After multiple test corrections, we found five miRNAs (miR-25, 32, 363, 92a, and 92b) that have high-confidence target genes with a CV significantly different from the CV of the remaining RefSeq genes in both data sets I and II (at an FDR cutoff of 0.05, there are eight and 22 significant miRNAs in data sets I and II, respectively, and five miRNAs are significant in both data sets) (see Table 5; Supplemental Table S4). It deserves noting that miR-363, miR-92a, and miR-92b were detected by both approaches, suggesting that the two methods are complementary (Tables 4, 5). Thus, our results collectively indicate that both expression variation of miRNAs and SNPs within miRNA loci regulates expression patterns of target genes through trans-regulating effects at the population level.
Table 5.
miRNAs that have high-confidence target genes with CV values significantly higher than the genomic backgrounds
Expression variation associated with mutations in miRNA target sites
Mutations in miRNA target sites will cause turnover of miRNA targeting and rewire the regulatory networks, thereby influencing expression of host genes (Fig. 1F). An intriguing case is a G → A mutation in the 3′ UTR of MSTN, which created a new target site for miR-1 in Texel sheep, dramatically increasing muscular development (Clop 2006). A large number of SNPs have been found to be associated with gene expression variation (Cheung and Spielman 2002; Stranger et al. 2005, 2007a; Spielman et al. 2007). Here we ask how many genetic variants affect miRNA targeting specificity and hence the expression levels of the host genes.
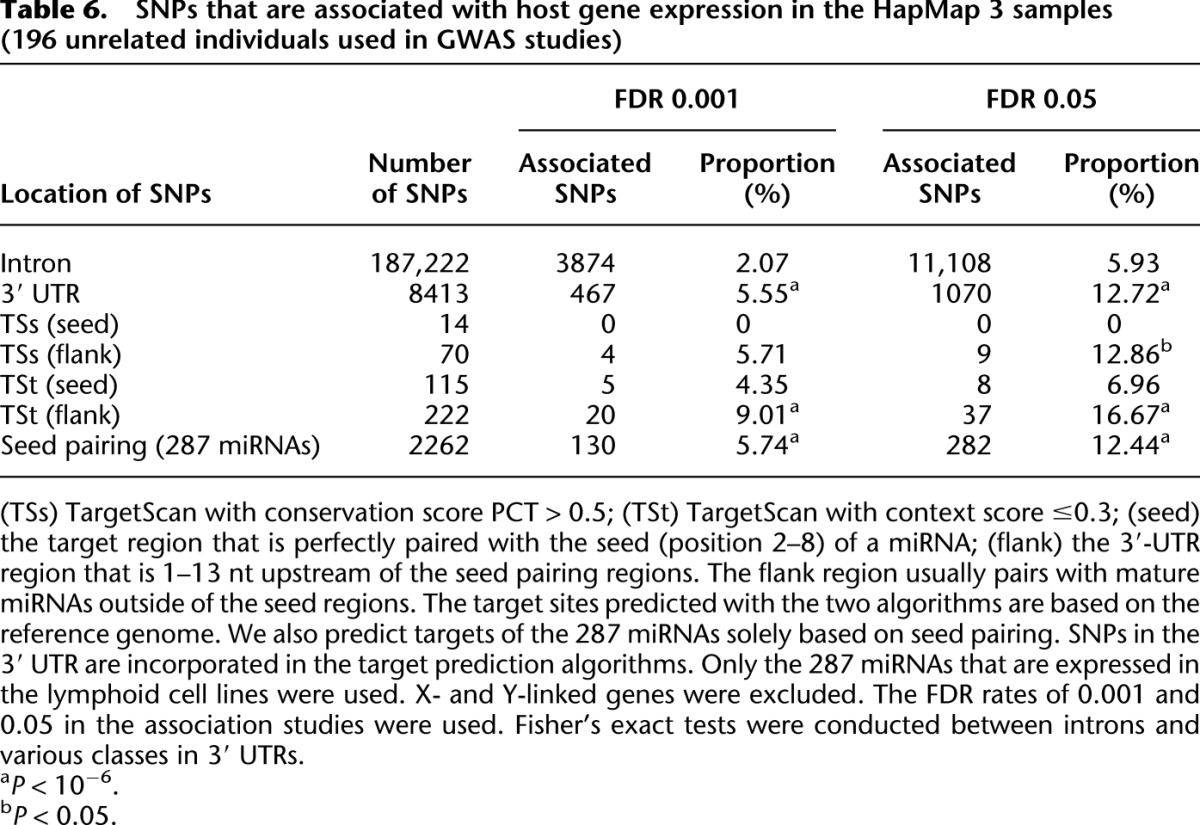
In our genome-wide association studies between cis-acting elements and expression levels of mRNAs, we only focus on autosomal protein-coding genes. We also only consider genetic variants that are located within the genic regions (or 100-kb upstream and downstream regions) to ensure that the association is strictly caused by the cis-acting effects (for details, see Methods). Among the ∼1.6 million SNPs genotyped in the HapMap 3 Project, there are 8413 SNPs located in 3′ UTRs and 187,222 SNPs located in introns of the expressed genes in lymphoblastoid cells (only SNPs with minor allele frequency >0.05 in the 196 tested samples are considered; we also removed SNPs located in the probes of microarrays; see Methods). At an FDR of 0.001 (the Benjamini-Hochberg method is used to correct for multiple tests), 467 SNPs in 3′ UTRs and 3874 SNPs in introns are significantly associated with the host gene expression levels (Table 6). It is striking that the proportion of associated SNPs in 3′ UTRs is significantly higher than the proportion in introns (5.55% vs. 2.07%, P = 8.8 × 10−73, Fisher's exact test) (Table 6). We observed the same pattern with an FDR cutoff of 0.05 (Table 6).
Table 6.
SNPs that are associated with host gene expression in the HapMap 3 samples (196 unrelated individuals used in GWAS studies)
The 1000 Genomes Project has discovered a more comprehensive collection of genetic variants than the HapMap 3 Project and provides more power in identifying the genetic elements that affect gene expression (Montgomery et al. 2011). For the 149 samples that have expression data quantified by Stranger et al. (2007b) and sequenced by the 1000 Human Genomes Project Phase 1, we identified 13.4 million SNPs (Supplemental Fig. S6A), 3.6 million small indels (2–51 nt in size) (Supplemental Fig. S6B), and 3247 large indels (size > 100 nt, referred to as structural variants) (Supplemental Fig. S6C). In our association studies, we separately considered the impacts of the three categories of genetic variants on the expression levels of the host genes. For each type of variant, we incorporated variants that are located in 3′ UTRs, introns, and 100 kb upstream and downstream of the genes with expression evidence in the association studies. We only considered autosomal variants (minor allele frequency cutoff is 5% for SNPs and small indels; the cutoff is 1% for large indels). (For each gene that is expressed, the number of cis-regulating variants in the association studies is plotted in Supplemental Fig. S6; and the frequency spectra of genetic variants in the tested samples are presented in Supplemental Fig. S7.)
Consistent with the analysis of the HapMap 3 genotypes, we found that the SNPs that are associated with host gene expression levels are significantly enriched in 3′ UTRs relative to introns (at an FDR of 0.001, the proportion of the significantly associated SNPs in 3′ UTR vs. introns is 3.80% vs. 1.35%, P = 2.6 × 10−132, Fisher's exact test; the patterns are consistently observed even if we use other FDR levels) (see Table 7). (The SNPs that are significantly associated with the host gene expression levels are listed in Supplemental Table S5.) Interestingly, we also found small indels (2–52 nt) that are associated with host gene expression levels are threefold enriched in 3′ UTRs relative to introns (at an FDR of 0.001, the proportion is 2.60% vs. 0.84%, P = 2.4 × 10⁻²⁵, Fisher's exact test) (Table 7). More striking patterns are observed for large indels (>100 nt). We observed that the large indels that are associated with host gene expression levels are 10-fold enriched in 3′ UTRs relative to introns (at an FDR of 0.05, the proportion is 35.3% vs. 3.3%, P < 0.0001, Fisher's exact test) (Table 7). Thus GWA studies on the cis-elements using data from the 1000 Genomes Project also indicate that genetic variants that are significantly associated with expression patterns of host genes are significantly enriched in 3′ UTRs relative to introns. Therefore, the elevated proportion of associated SNPs in 3′ UTRs compared with introns suggests that the SNPs might be causative to gene expression variation rather than hitchhiking with other functional SNPs, since we expect the same proportion of associated SNPs in introns and 3′ UTRs under the hitchhiking scenario.
Table 7.
Genetic variants that are associated with gene expression in the 1000 Human Genomes Project (149 human individuals used in GWAS studies)
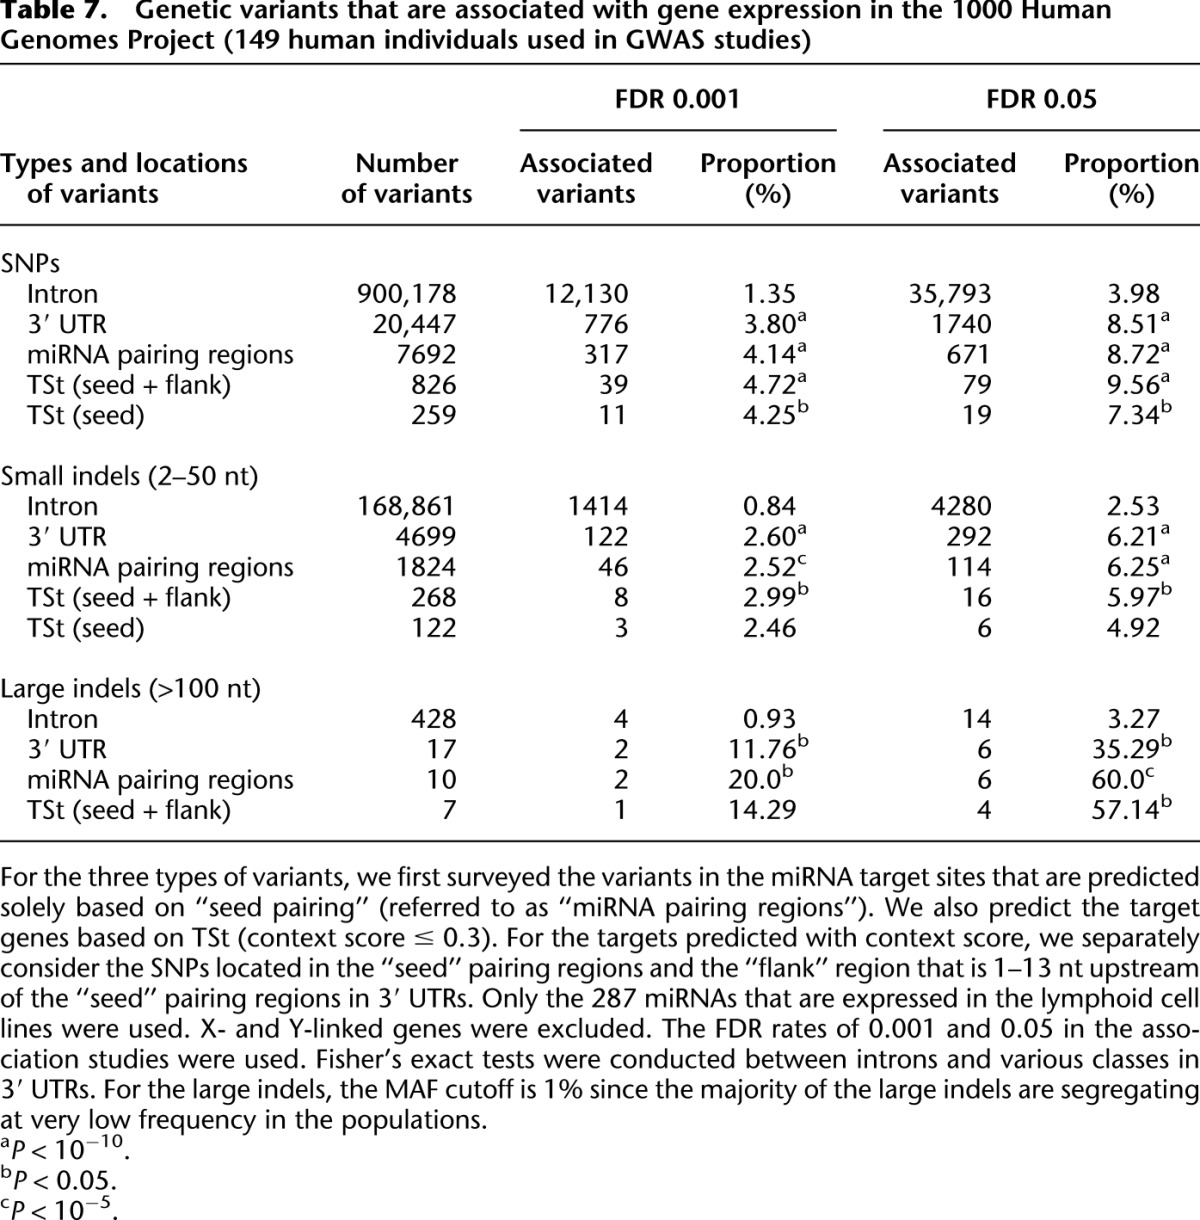
miRNA target sites are preferentially located in 3′ UTRs; therefore, it is possible that the associated SNPs in 3′ UTRs directly (category 5 in Fig. 1F) or indirectly affect miRNA target recognition (category 6 in Fig. 1F). For the miRNA target genes based solely on “seed pairing,” we identified 7692 SNPs, 1824 small indels, and 17 large indels located in the miRNA pairing regions in the 1000 Genomes Project; and for all the three categories of genetic variants, we found a significantly higher proportion of associated variants in the miRNA pairing regions than in introns (Table 7). Similar results are obtained even if we incorporate SNP information in the target prediction algorithms. We identified 2262 SNPs located in 3′ UTRs that are complementary to the seeds of the 287 miRNAs expressed in the HapMap 3 data, and 130 of the SNPs (5.74%) are significantly associated with expression levels of the host genes (FDR cutoff 0.001) (Table 6). The proportion of seed-pairing-associated SNPs is significantly higher than the corresponding value in introns (8.0 × 10⁻²⁴ and 2.0 × 10⁻³⁰ at an FDR of 0.001 and 0.05, respectively, Fisher's exact tests) (Table 6). The Context Score (TSt) is well-suited to identify miRNA target genes based on local sequence features rather than conservation (Grimson et al. 2007; Bartel 2009). With the target genes predicted by the Context Score algorithm, we also found genetic variants associated with host gene expression patterns to be significantly enriched in seed-pairing regions (or adjacent target sites) compared with introns based on inferred genotypes from the HapMap 3 and 1000 Genomes Projects (Tables 6, 7). By comparing genetic variants from 100 kb upstream and downstream of the genic regions, we also observed that genetic variants in 3′ UTRs (or miRNA target sites) have a significantly greater chance to be associated with host gene expression (data not shown).
In summary, our results indicate that a large number of cis-elements rewire the miRNA regulatory networks and hence affect expression levels of the host genes through miRNA-targeting mechanisms.
Implication of miRNA targeting on human population differentiation
Our results so far indicate that miRNA targeting is associated with elevated expression variation in target genes among individuals within human ethnicity groups. Next, we would like to explore the implications of variation in miRNA targeting on gene expression differentiation among human populations. Previous studies have found that 17%–30% of genes are differentially expressed among different ethnic populations (Cheung and Spielman 2002; Cheung et al. 2003a,b; Spielman et al. 2007; Storey et al. 2007) and miRNAs are also expressed in a population-specific manner (Huang et al. 2011b). Among the ∼15,000 transcripts that are expressed in the lymphoblastoid samples in data sets III–VI (Stranger et al. 2005, 2007a,b), we found ∼4700 transcripts that are differentially expressed between the CEU and Asian (CHB + JPT) populations (FDR cutoff 0.001) (for details, see Methods). There are 36.7% (3187 out of 8684) of the high-confidence miRNA target genes differentially expressed between CEU and Asians, which is significantly higher than differentiation of non-miRNA target genes (1593 out of 5560, or 28.7%, P < 10−16, χ2 test) (Fig. 4). The difference in the population differentiation ratio is attenuated if we restrict our analysis to the RefSeq transcripts; however, a significant difference was still observed (36.8% for high-confidence targets vs. 33.8% for non-targets, P = 0.007, χ2 test) (Fig. 4). To exclude possible biases caused by sex-linked effects, we narrowed our focus to only males (CEU vs. CHB + JPT), and we still observed the same trends (Fig. 4). The same patterns are observed between the YRI and Asian populations (28.7% for high-confidence targets vs. 23.4% for non-targets, P < 0.001, χ2 test). Some portion of this difference could be caused by changes that occurred in cell culture (Imig et al. 2011), but for our purposes, even cell culture–induced differences in miRNA expression will be of interest. Resolution of true host differences vs. cell culture artifacts will require contrasts of fresh primary cells.
Figure 4.

High-confidence miRNA target genes tend to display greater differential expression between CEU vs. Asian populations (FDR is cut off at 0.001). This pattern holds true either when we incorporate all of the probes or restrict our analysis to the RefSeq transcripts. Similar patterns were observed when we considered both genders, or males alone. High-confidence miRNA targets were considered as miRNA targets, while genes not targeted by coexpressed miRNAs in all of the six methods were considered non-targets (see legend to Fig. 2). (Gray) miRNA targets; (white) non-targets. When we only consider RefSeq transcripts, 3187 of 8660 (36.8%) miRNA target transcripts are differentially expressed, and 818 of 2421 (33.8%) non-target transcripts are differentially expressed (P = 0.007). For all of the expressed transcripts in males, 26.9% (2332 out of 8684) of targets are differentially expressed, and 19.4% (1080 out of 5560) of non-targets are differentially expressed (P < 10−16). For the RefSeq data in males, 25.6% (2217 out of 8660) of targets are differentially expressed, and 22.7% (550 out of 2421) of non-targets are differentially expressed (P < 10−16).
We also observed synergistic miRNA regulatory effects on differential expression of target genes between the CEU and Asian populations. The number of distinct target sites (Context Score ≤ 0.3) is positively correlated with the proportion of genes differentially expressed between the CEU and CHB + JPT populations (FDR cutoff of 0.001; Pearson correlation coefficient r = 0.63, P = 0.01) (Supplemental Fig. S8A). However, a significant negative correlation was observed between the number of conserved miRNA target sites and the proportion of differentially expressed transcripts (r = −0.94, P = 0.02), suggesting that the impact of miRNA targeting on gene expression differentiation is mainly associated with the non-conserved miRNA:mRNA pairing (Supplemental Fig. S8B). In summary, we observe that miRNA target genes are significantly enriched in the set of genes that are differentially expressed between European-American and East Asian groups, and that non-conserved sites primarily account for this enrichment.
Dual roles of miRNA regulation on target genes during primate evolution
In this section, we show that miRNA regulation has likely shaped complex gene expression evolution patterns during primate evolution. With an extensive RNA-seq analysis, Blekhman et al. (2010) identified 3335 genes differentially expressed in the liver between human and chimpanzee, 6030 genes between human and macaque, and 5549 genes between chimpanzee and macaque (Blekhman et al. 2010). They were able to infer that expression levels of 1391 genes were under stabilizing selection (i.e., the genes have little variation in gene expression among individuals and species and are thus possible targets of canalization) during primate evolution, and 887 genes were under directional selection in the human lineage (i.e., genes having little variation in expression levels within and between other primate species and individuals but a different expression pattern in humans) (Blekhman et al. 2010).
Based on tissue-specific miRNA sequencing, previous studies identified 72 miRNAs expressed in human liver (Landgraf et al. 2007; Betel et al. 2008). About 20% of genes putatively targeted by the 72 coexpressed miRNAs are differentially expressed between human and chimp, whereas only 15% of the non-target genes are differentially expressed between the two species (P-value < 10−5) (Fig. 5A). When we only consider the 880 experimentally verified target genes of the 72 coexpressed miRNAs, we still find that 21.3% of the targets are differentially expressed between human and chimpanzee, significantly higher than the remaining genes (Fig. 5A). The same patterns are observed for genes differentially expressed between human and macaque (Fig. 5B).
Figure 5.

Genes that are differentially expressed or under stabilizing selection during primate evolution are significantly enriched in miRNA target genes. (A) The genes that are differentially expressed between human and chimpanzee (deHC). (B) The genes that are differentially expressed between human and macaque (deHR). (C) The genes that are under stabilizing selection. All of the 20,689 Ensembl genes sequenced by Blekhman et al. (2010) are used in A, B, and C. (D) The combinational miRNA target gene determination methods. Only the 16,772 protein-coding genes examined in Blekhman et al. (2010) are used.
Intriguingly, we found that miRNA target genes are significantly over-represented in the category of genes under stabilizing selection during primate evolution (P-value < 10−5 in all the comparisons) (Fig. 5C). Based on TSs, 6.4% of the non-miRNA target genes with expression levels are under stabilizing selection, while 9.7% of the miRNA target genes are under stabilizing selection (Fig. 5C). The contrast becomes enhanced when we restrict the analysis to experimentally verified miRNA targets: 12.3% are under stabilizing selection, compared with only 6.4% of the remaining genes (Fig. 5C).
Among the 20,689 Ensembl genes analyzed by Blekhman et al. (2010), 16,272 are protein coding and 4417 are non-coding genes. Interestingly, we found that protein-coding genes show a greater degree of differential expression across species. For example, 19.3% (3141 out of 16,272) of coding genes are differentially expressed between human and chimpanzee, while only 4.4% (194 out of 4417) of non-coding genes are differentially expressed between the two species. Since canonical targets of miRNAs are protein-coding genes, we also only focused on the protein-coding genes. For the high-confidence target genes of the 72 miRNAs, we still observed that they are significantly enriched for genes that are differentially expressed between human and chimpanzee (or macaque), and for genes under stabilizing selection (Fig. 5D). We identified seven miRNAs with high-confidence targets significantly enriched in the set of genes showing directional selection in the human lineage as identified in Blekhman et al. (2010), and three miRNAs (miR-23a,b, and 194) having targets that are significantly enriched in the set of genes under stabilizing selection (Supplemental Table S6).
These comparisons are compatible with the hypothesis that miRNA targeting has dual roles in regulating gene expression: (1) to canalize (or to reduce expression variation in) a subset of target genes, and (2) to promote variability in gene expression by rewiring the miRNA regulatory networks as summarized in Figure 1.
Discussion
Consequences of miRNA regulation on target genes at the population level: canalization vs. increased expression variation?
Genes encoding small RNAs undergo rapid evolutionary processes at both the macro- and micro-evolutionary levels (Allen et al. 2004; Fahlgren et al. 2007; Grimson et al. 2008; Lu et al. 2008a,b; Lu and Clark 2010). In this study, we identified variants related to miRNA targeting. We proposed dual roles of miRNAs on the evolution of expression regulation of the target genes. We found that miRNA targeting is associated with reduced expression divergence of a small number of target genes during primate evolution, and the targeting is also coupled with decreased CVs of highly expressed genes. However, the overall pattern is that genes targeted by coexpressed miRNAs generally have higher expression variation within species or higher divergence between human and other primate species.
There are two hypotheses to account for this observation. The first explanation is that expression levels of genes targeted by miRNAs are intrinsically highly variable, and the miRNA regulation has evolved to reduce the interindividual stochastic variability of target gene expression. Under this hypothesis, miRNAs have comprehensive canalization effects on the expression of target genes. At this moment, it is unclear what level of intrinsic stochastic variation in gene expression would be seen in the absence of miRNA targeting, and thus we are unable to quantify the magnitude of canalization effects of miRNAs in natural populations. The second explanation is that variation in miRNA regulatory networks promotes the expression variation of target genes (summarized in Fig. 1). We find several lines of evidence supporting this hypothesis. First, expression levels of miRNAs themselves are highly variable across individuals. We found that variation in expression of ∼10 miRNAs accounts for the elevated expression variation of their target genes. Second, miRNAs have pleiotropic effects by regulating a large number of target genes. SNPs that occur in 3′ UTRs can cause birth and death of target sites and hence may rewire the miRNA regulatory networks. We found that SNPs that are significantly associated with host gene expression are significantly enriched in 3′ UTRs (or putative miRNA target sites). Some of the associated SNPs in the 3′ UTRs show signatures of variation that are consistent with positive natural selection. Third, we find synergistic regulatory effects between miRNA targeting and elevated expression variation in the target genes (Fig. 3). Therefore, it seems most parsimonious to infer that variation in miRNA regulatory networks promotes expression variation of target genes across individuals or expression differentiation among ethnic groups. This conclusion does not imply that miRNAs never play a role in canalization effects (Hornstein and Shomron 2006; Cui et al. 2007; Li et al. 2009; Wu et al. 2009). Instead, our analysis indicates that miRNAs have dual roles in influencing expression variation of the target genes: miRNA targeting canalizes expression of a subset of the target genes and promotes expression variation of other target genes.
Evolutionary forces impacting genetic variation related to miRNA targeting and the implications for human disease
We proposed six modes whereby genetic variation in the miRNA regulatory networks potentially affect expression patterns of target genes. By extensively surveying genotypic data from the 1000 Genomes Project, we found that most of the genetic variants in miRNA loci are segregating at very low frequencies in the global human populations, suggesting that they are somewhat deleterious.
Our results suggest that SNPs located in 3′ UTRs (or putative miRNA target sites) affect expression levels of host genes by directly or indirectly affecting miRNA targeting. It was reported that miRNA target sites are generally under selective pressure (Xie et al. 2005; Chen and Rajewsky 2006; Saunders et al. 2007). We performed a literature search and identified 21 SNPs located in the 3′ UTRs that had been associated with disease. Six of those SNPs are located in the seed-pairing regions of miRNAs, although none of these SNPs are associated with host gene expression levels (Supplemental Table S7).
Intriguingly, signals of positive selection can also be detected in SNPs located within putative miRNA target sites. Recently, Sabeti and colleagues identified more than 8000 SNPs that might be favored by natural selection (Grossman et al. 2010). We found that 46 of these positively selected SNPs are located in 3′ UTRs of the genes expressed in lymphoblastoid cells, including 16 SNPs in the pairing regions of coexpressed miRNAs. Six of these positively selected SNPs are significantly associated with host gene expression at a FDR of 10% (Supplemental Table S8). Since 3′ UTRs might harbor miRNA target sites that are not covered by the 287 coexpressed miRNAs under the current miRNA target prediction methods or by other undiscovered miRNAs, these comparisons suggest that some genetic variation mediating miRNA target recognition might be favored by natural selection.
We also identified several other factors that are related to the inflated expression variation of miRNA target genes, including gene annotations, abundance of miRNA target genes, and expression patterns of miRNAs. Comprehensive analyses of these factors justify the analytical procedures and conclusion of this study (the details are fully described in the Supplemental Material).
Accumulating evidence has indicated that post-transcriptional factors such as RNA binding proteins broadly interact with miRNAs to regulate gene expression patterns (Galgano et al. 2008; Hafner et al. 2010). We believe that the kind of analysis begun in this study will provide deeper insight regarding the genetic mechanisms underlying human genetic variation and local adaptation.
Methods
Expression data of mRNAs and miRNAs
We used six high-throughput mRNA expression data sets in human populations, including five from human lymphoblastoid cell lines and one from primary leukocytes (Table 1). The mRNA expression in human, chimpanzee, and macaque were extracted from Blekhman et al. (2010). The miRNA expression data in the 90 European-American males were taken from Wang et al. (2009). There are 72 miRNAs expressed in the human liver by deep sequencing from Landgraf et al. (2007).
Genotype data from the HapMap 3 and 1000 Genomes Projects
The Phase 3 release of HapMap data was downloaded from ftp://ftp.ncbi.nlm.nih.gov/hapmap/genotypes/latest_phaseIII_ncbi_b36/hapmap_format/polymorphic/.
The February 2012 release of the 1000 Human Genome Project was downloaded from ftp://ftp-trace.ncbi.nih.gov/1000genomes/ftp/release/20110521. The genetic variants were mapped on miRNAs, RefSeq, and Ensembl transcripts based on the genomic location coordinates.
miRNA targets
We used state-of-the-art in silico miRNA target prediction algorithms, including canonical TargetScan based on conservation criteria (TSs) (Lewis et al. 2005; Grimson et al. 2007; Friedman et al. 2009), Pictar (Krek et al. 2005), miRanda (John et al. 2004), PITAtop (Kertesz et al. 2007), and TargetScan based on Context Score (TSt) (Grimson et al. 2007). The seed and mature sequences of miRNAs were downloaded from miRBase V15. The experimentally verified target genes of the coexpressed miRNAs were parsed from TarBase (Papadopoulos et al. 2009), miR2Disease (Jiang et al. 2009), and the PAR-CLIP method determined by the Tuschl laboratory (Hafner et al. 2010).
High-confidence miRNA targets
We considered genes predicted to be targets of the coexpressed miRNAs by TargetScan with Conservation (aggregate PCT > 0.8) or Context Score (≤0.4 and percentile > 85), or by Pictar, or experimentally verified targets as high-confidence miRNA targets because the former three methods have low false discovery rates (Baek et al. 2008). When we combine the miRNA target determination methods together, genes not targeted by coexpressed miRNAs as determined in the four methods and also not predicted by miRanda and PITAtop were considered as non-targets.
Association tests
We used a compressed mixed linear model implemented in the GAPIT (http://www.maizegenetics.net/gapit) package (Zhang et al. 2010) to conduct the genome-wide association studies between genetic variants and expression levels of mRNAs. Since genotypic and expression data in the CEU population are from trio families, to exclude the dependence between the data points, we only include the unrelated CEU parents and YRI parents data from each trio family into our analysis. Among the samples with expression levels quantified by Stranger et al. (2007b), there are 196 unrelated samples genotyped in the HapMap 3 Project, including 43 CHB, 42 JPT, 56 CEU parents, and 55 YRI parents. Among the 1092 samples that are sequenced in the 1000 Genomes Project Phase 1, 149 unrelated samples have mRNA expression data measured by Stranger et al. (2007b), including samples from 32 CEU parents, 41 CHB, 39 JPT, and 37 YRI parents. To increase the statistical powers of association tests, we pooled samples from different populations into the analysis. For SNPs from the HapMap 3 Project and the 1000 Genomes Project, the association tests were conducted separately. For small indels and large indels sequenced in the 1000 Genomes Project, the association tests were performed based on the genome-wide population parameters estimated from SNPs.
Population differentiation analysis
Genes that are differentially expressed between populations were detected with the limma package (Diboun et al. 2006).
Detailed information on data retrieval and analysis are fully described in the Supplemental Material.
Acknowledgments
We thank Drs. Zhiwu Zhang, Andrew Grimson, Jianzhi George Zhang, Margarida Cardoso-Moreira, Tim Connallon, Ran Blekhman, Han Liang, Zhenglong Gu, and Chung-I Wu; and three anonymous reviewers for critically reading this manuscript and providing many constructive suggestions. We thank Dr. Liang Wang at the Mayo Clinic for providing advice for data analysis. We also thank the HapMap 3 and the 1000 Genomes Projects for making the genotype data publicly available. We thank Dr. Liang Wang at the Mayo Clinic for providing advice for the data analysis. This work was supported by NIH grants HG003229 and HG005715 to A.G.C.
Footnotes
[Supplemental material is available for this article.]
Article published online before print. Article, supplemental material, and publication date are at http://www.genome.org/cgi/doi/10.1101/gr.132514.111.
References
- The 1000 Genomes Project Consortium 2010. A map of human genome variation from population-scale sequencing. Nature 467: 1061–1073 [DOI] [PMC free article] [PubMed] [Google Scholar]
- Allen E, Xie Z, Gustafson AM, Sung GH, Spatafora JW, Carrington JC 2004. Evolution of microRNA genes by inverted duplication of target gene sequences in Arabidopsis thaliana. Nat Genet 36: 1282–1290 [DOI] [PubMed] [Google Scholar]
- Ambros V 2003. MicroRNA pathways in flies and worms: Growth, death, fat, stress, and timing. Cell 113: 673–676 [DOI] [PubMed] [Google Scholar]
- Baek D, Villen J, Shin C, Camargo FD, Gygi SP, Bartel DP 2008. The impact of microRNAs on protein output. Nature 455: 64–71 [DOI] [PMC free article] [PubMed] [Google Scholar]
- Bagga S, Bracht J, Hunter S, Massirer K, Holtz J, Eachus R, Pasquinelli AE 2005. Regulation by let-7 and lin-4 miRNAs results in target mRNA degradation. Cell 122: 553–563 [DOI] [PubMed] [Google Scholar]
- Bartel DP 2004. MicroRNAs: Genomics, biogenesis, mechanism, and function. Cell 116: 281–297 [DOI] [PubMed] [Google Scholar]
- Bartel DP 2009. MicroRNAs: Target recognition and regulatory functions. Cell 136: 215–233 [DOI] [PMC free article] [PubMed] [Google Scholar]
- Bartel DP, Chen CZ 2004. Micromanagers of gene expression: The potentially widespread influence of metazoan microRNAs. Nat Rev Genet 5: 396–400 [DOI] [PubMed] [Google Scholar]
- Betel D, Wilson M, Gabow A, Marks DS, Sander C 2008. The microRNA.org resource: Targets and expression. Nucleic Acids Res 36: D149–D153 [DOI] [PMC free article] [PubMed] [Google Scholar]
- Blekhman R, Marioni JC, Zumbo P, Stephens M, Gilad Y 2010. Sex-specific and lineage-specific alternative splicing in primates. Genome Res 20: 180–189 [DOI] [PMC free article] [PubMed] [Google Scholar]
- Borel C, Deutsch S, Letourneau A, Migliavacca E, Montgomery SB, Dimas AS, Vejnar CE, Attar H, Gagnebin M, Gehrig C, et al. 2011. Identification of cis- and trans-regulatory variation modulating microRNA expression levels in human fibroblasts. Genome Res 21: 68–73 [DOI] [PMC free article] [PubMed] [Google Scholar]
- Brennecke J, Stark A, Russell RB, Cohen SM 2005. Principles of microRNA–target recognition. PLoS Biol 3: e85 doi: 10.1371/journal.pbio.0030085 [DOI] [PMC free article] [PubMed] [Google Scholar]
- Calin GA, Croce CM 2006. MicroRNA signatures in human cancers. Nat Rev Cancer 6: 857–866 [DOI] [PubMed] [Google Scholar]
- Carthew RW 2006. Gene regulation by microRNAs. Curr Opin Genet Dev 16: 203–208 [DOI] [PubMed] [Google Scholar]
- Chen K, Rajewsky N 2006. Deep conservation of miRNA–target relationships and 3′ UTR motifs in vertebrates, flies and nematodes. Cold Spring Harb Symp Quant Biol 71: 149–156 [DOI] [PubMed] [Google Scholar]
- Cheung VG, Spielman RS 2002. The genetics of variation in gene expression. Nat Genet (Suppl) 32: 522–525 [DOI] [PubMed] [Google Scholar]
- Cheung VG, Conlin LK, Weber TM, Arcaro M, Jen KY, Morley M, Spielman RS 2003a. Natural variation in human gene expression assessed in lymphoblastoid cells. Nat Genet 33: 422–425 [DOI] [PubMed] [Google Scholar]
- Cheung VG, Jen KY, Weber T, Morley M, Devlin JL, Ewens KG, Spielman RS 2003b. Genetics of quantitative variation in human gene expression. Cold Spring Harb Symp Quant Biol 68: 403–407 [DOI] [PubMed] [Google Scholar]
- Clop A 2006. A mutation creating a potential illegitimate microRNA target site in the myostatin gene affects muscularity in sheep. Nat Genet 38: 813–818 [DOI] [PubMed] [Google Scholar]
- Cui Q, Yu Z, Purisima EO, Wang E 2007. MicroRNA regulation and interspecific variation of gene expression. Trends Genet 23: 372–375 [DOI] [PubMed] [Google Scholar]
- Diboun I, Wernisch L, Orengo CA, Koltzenburg M 2006. Microarray analysis after RNA amplification can detect pronounced differences in gene expression using limma. BMC Genomics 7: 252 doi: 10.1186/1471-2164-7-252 [DOI] [PMC free article] [PubMed] [Google Scholar]
- Doench JG, Petersen CP, Sharp PA 2003. siRNAs can function as miRNAs. Genes Dev 17: 438–442 [DOI] [PMC free article] [PubMed] [Google Scholar]
- Enright AJ, John B, Gaul U, Tuschl T, Sander C, Marks DS 2003. MicroRNA targets in Drosophila. Genome Biol 5: R1 doi: 10.1186/gb-2003-5-1-r1 [DOI] [PMC free article] [PubMed] [Google Scholar]
- Esquela-Kerscher A, Slack FJ 2006. Oncomirs—microRNAs with a role in cancer. Nat Rev Cancer 6: 259–269 [DOI] [PubMed] [Google Scholar]
- Fahlgren N, Howell MD, Kasschau KD, Chapman EJ, Sullivan CM, Cumbie JS, Givan SA, Law TF, Grant SR, Dangl JL, et al. 2007. High-throughput sequencing of Arabidopsis microRNAs: Evidence for frequent birth and death of MIRNA genes. PLoS ONE 2: e219 doi: 10.1371/journal.pone.0000219 [DOI] [PMC free article] [PubMed] [Google Scholar]
- Friedman RC, Farh KK, Burge CB, Bartel DP 2009. Most mammalian mRNAs are conserved targets of microRNAs. Genome Res 19: 92–105 [DOI] [PMC free article] [PubMed] [Google Scholar]
- Galgano A, Forrer M, Jaskiewicz L, Kanitz A, Zavolan M, Gerber AP 2008. Comparative analysis of mRNA targets for human PUF-family proteins suggests extensive interaction with the miRNA regulatory system. PLoS ONE 3: e3164 doi: 10.1371/journal.pone.0003164 [DOI] [PMC free article] [PubMed] [Google Scholar]
- Ghildiyal M, Zamore PD 2009. Small silencing RNAs: An expanding universe. Nat Rev Genet 10: 94–108 [DOI] [PMC free article] [PubMed] [Google Scholar]
- Grimson A, Farh KK, Johnston WK, Garrett-Engele P, Lim LP, Bartel DP 2007. MicroRNA targeting specificity in mammals: Determinants beyond seed pairing. Mol Cell 27: 91–105 [DOI] [PMC free article] [PubMed] [Google Scholar]
- Grimson A, Srivastava M, Fahey B, Woodcroft BJ, Chiang HR, King N, Degnan BM, Rokhsar DS, Bartel DP 2008. Early origins and evolution of microRNAs and Piwi-interacting RNAs in animals. Nature 455: 1193–1197 [DOI] [PMC free article] [PubMed] [Google Scholar]
- Grossman SR, Shylakhter I, Karlsson EK, Byrne EH, Morales S, Frieden G, Hostetter E, Angelino E, Garber M, Zuk O, et al. 2010. A composite of multiple signals distinguishes causal variants in regions of positive selection. Science 327: 883–886 [DOI] [PubMed] [Google Scholar]
- Grun D, Wang YL, Langenberger D, Gunsalus KC, Rajewsky N 2005. microRNA target predictions across seven Drosophila species and comparison to mammalian targets. PLoS Comput Biol 1: e13 doi: 10.1371/journal.pcbi.0010013 [DOI] [PMC free article] [PubMed] [Google Scholar]
- Guo H, Ingolia NT, Weissman JS, Bartel DP 2010. Mammalian microRNAs predominantly act to decrease target mRNA levels. Nature 466: 835–840 [DOI] [PMC free article] [PubMed] [Google Scholar]
- Hafner M, Landthaler M, Burger L, Khorshid M, Hausser J, Berninger P, Rothballer A, Ascano M Jr, Jungkamp AC, Munschauer M, et al. 2010. Transcriptome-wide identification of RNA-binding protein and microRNA target sites by PAR-CLIP. Cell 141: 129–141 [DOI] [PMC free article] [PubMed] [Google Scholar]
- He L, Hannon GJ 2004. MicroRNAs: Small RNAs with a big role in gene regulation. Nat Rev Genet 5: 522–531 [DOI] [PubMed] [Google Scholar]
- Hornstein E, Shomron S 2006. Canalization of development by microRNAs. Nat Genet 38: S20–S24 [DOI] [PubMed] [Google Scholar]
- Huang GT, Athanassiou C, Benos PV 2011a. mirConnX: Condition-specific mRNA-microRNA network integrator. Nucleic Acids Res 39: W416–W423 [DOI] [PMC free article] [PubMed] [Google Scholar]
- Huang RS, Gamazon ER, Ziliak D, Wen Y, Im HK, Zhang W, Wing C, Duan S, Bleibel WK, Cox NJ, et al. 2011b. Population differences in microRNA expression and biological implications. RNA Biol 8: 692–701 [DOI] [PMC free article] [PubMed] [Google Scholar]
- Idaghdour Y, Czika W, Shianna KV, Lee SH, Visscher PM, Martin HC, Miclaus K, Jadallah SJ, Goldstein DB, Wolfinger RD, et al. 2010. Geographical genomics of human leukocyte gene expression variation in southern Morocco. Nat Genet 42: 62–67 [DOI] [PMC free article] [PubMed] [Google Scholar]
- Imig J, Motsch N, Zhu JY, Barth S, Okoniewski M, Reineke T, Tinguely M, Faggioni A, Trivedi P, Meister G, et al. 2011. microRNA profiling in Epstein-Barr virus-associated B-cell lymphoma. Nucleic Acids Res 39: 1880–1893 [DOI] [PMC free article] [PubMed] [Google Scholar]
- The International HapMap 3 Consortium. 2010. Integrating common and rare genetic variation in diverse human populations. Nature467: 52–58. [DOI] [PMC free article] [PubMed] [Google Scholar]
- Jiang Q, Wang Y, Hao Y, Juan L, Teng M, Zhang X, Li M, Wang G, Liu Y 2009. miR2Disease: A manually curated database for microRNA deregulation in human disease. Nucleic Acids Res 37: D98–D104 [DOI] [PMC free article] [PubMed] [Google Scholar]
- John B, Enright AJ, Aravin A, Tuschl T, Sander C, Marks DS 2004. Human microRNA targets. PLoS Biol 2: e363 doi: 10.1371/journal.pbio.0020363 [DOI] [PMC free article] [PubMed] [Google Scholar]
- Kaern M, Elston TC, Blake WJ, Collins JJ 2005. Stochasticity in gene expression: From theories to phenotypes. Nat Rev Genet 6: 451–464 [DOI] [PubMed] [Google Scholar]
- Kertesz M, Iovino N, Unnerstall U, Gaul U, Segal E 2007. The role of site accessibility in microRNA target recognition. Nat Genet 39: 1278–1284 [DOI] [PubMed] [Google Scholar]
- Kim VN, Nam JW 2006. Genomics of microRNA. Trends Genet 22: 165–173 [DOI] [PubMed] [Google Scholar]
- Krek A, Grun D, Poy MN, Wolf R, Rosenberg L, Epstein EJ, MacMenamin P, da Piedade I, Gunsalus KC, Stoffel M, et al. 2005. Combinatorial microRNA target predictions. Nat Genet 37: 495–500 [DOI] [PubMed] [Google Scholar]
- Landgraf P, Rusu M, Sheridan R, Sewer A, Iovino N, Aravin A, Pfeffer S, Rice A, Kamphorst AO, Landthaler M, et al. 2007. A mammalian microRNA expression atlas based on small RNA library sequencing. Cell 129: 1401–1414 [DOI] [PMC free article] [PubMed] [Google Scholar]
- Lewis BP, Shih IH, Jones-Rhoades MW, Bartel DP, Burge CB 2003. Prediction of mammalian microRNA targets. Cell 115: 787–798 [DOI] [PubMed] [Google Scholar]
- Lewis BP, Burge CB, Bartel DP 2005. Conserved seed pairing, often flanked by adenosines, indicates that thousands of human genes are microRNA targets. Cell 120: 15–20 [DOI] [PubMed] [Google Scholar]
- Li Y, Wang Y, Lee JA, Gao FB 2006. MicroRNA-9a ensures the precise specification of sensory organ precursors in Drosophila. Genes Dev 20: 2793–2805 [DOI] [PMC free article] [PubMed] [Google Scholar]
- Li X, Cassidy JJ, Reinke CA, Fischboeck S, Carthew RW 2009. A microRNA imparts robustness against environmental fluctuation during development. Cell 137: 273–282 [DOI] [PMC free article] [PubMed] [Google Scholar]
- Lu J, Clark AG 2010. Population dynamics of PIWI-interacting RNAs (piRNAs) and their targets in Drosophila. Genome Res 20: 212–227 [DOI] [PMC free article] [PubMed] [Google Scholar]
- Lu J, Fu Y, Kumar S, Shen Y, Zeng K, Xu A, Carthew R, Wu CI 2008a. Adaptive evolution of newly emerged micro-RNA genes in Drosophila. Mol Biol Evol 25: 929–938 [DOI] [PMC free article] [PubMed] [Google Scholar]
- Lu J, Shen Y, Wu Q, Kumar S, He B, Shi S, Carthew RW, Wang SM, Wu CI 2008b. The birth and death of microRNA genes in Drosophila. Nat Genet 40: 351–355 [DOI] [PubMed] [Google Scholar]
- Meiklejohn CD, Parsch J, Ranz JM, Hartl DL 2003. Rapid evolution of male-biased gene expression in Drosophila. Proc Natl Acad Sci 100: 9894–9899 [DOI] [PMC free article] [PubMed] [Google Scholar]
- Miska EA, Alvarez-Saavedra E, Abbott AL, Lau NC, Hellman AB, McGonagle SM, Bartel DP, Ambros VR, Horvitz HR 2007. Most Caenorhabditis elegans microRNAs are individually not essential for development or viability. PLoS Genet 3: e215 doi: 10.1371/journal.pgen.0030215 [DOI] [PMC free article] [PubMed] [Google Scholar]
- Montgomery SB, Lappalainen T, Gutierrez-Arcelus M, Dermitzakis ET 2011. Rare and common regulatory variation in population-scale sequenced human genomes. PLoS Genet 7: e1002144 doi: 10.1371/journal.pgen.1002144 [DOI] [PMC free article] [PubMed] [Google Scholar]
- Olsen PH, Ambros V 1999. The lin-4 regulatory RNA controls developmental timing in Caenorhabditis elegans by blocking LIN-14 protein synthesis after the initiation of translation. Dev Biol 216: 671–680 [DOI] [PubMed] [Google Scholar]
- Osella M, Bosia C, Cora D, Caselle M 2011. The role of incoherent microRNA-mediated feedforward loops in noise buffering. PLoS Comput Biol 7: e1001101 doi: 10.1371/journal.pcbi.1001101 [DOI] [PMC free article] [PubMed] [Google Scholar]
- Papadopoulos GL, Reczko M, Simossis VA, Sethupathy P, Hatzigeorgiou AG 2009. The database of experimentally supported targets: A functional update of TarBase. Nucleic Acids Res 37: D155–D158 [DOI] [PMC free article] [PubMed] [Google Scholar]
- Pickrell JK, Marioni JC, Pai AA, Degner JF, Engelhardt BE, Nkadori E, Veyrieras JB, Stephens M, Gilad Y, Pritchard JK 2010. Understanding mechanisms underlying human gene expression variation with RNA sequencing. Nature 464: 768–772 [DOI] [PMC free article] [PubMed] [Google Scholar]
- Rajewsky N 2006. microRNA target predictions in animals. Nat Genet (Suppl) 38: S8–S13 [DOI] [PubMed] [Google Scholar]
- Rajewsky N, Socci ND 2004. Computational identification of microRNA targets. Dev Biol 267: 529–535 [DOI] [PubMed] [Google Scholar]
- Saunders MA, Liang H, Li WH 2007. Human polymorphism at microRNAs and microRNA target sites. Proc Natl Acad Sci 104: 3300–3305 [DOI] [PMC free article] [PubMed] [Google Scholar]
- Sevignani C, Calin GA, Siracusa LD, Croce CM 2006. Mammalian microRNAs: A small world for fine-tuning gene expression. Mamm Genome 17: 189–202 [DOI] [PMC free article] [PubMed] [Google Scholar]
- Sokol NS, Ambros V 2005. Mesodermally expressed Drosophila microRNA-1 is regulated by Twist and is required in muscles during larval growth. Genes Dev 19: 2343–2354 [DOI] [PMC free article] [PubMed] [Google Scholar]
- Spielman RS, Bastone LA, Burdick JT, Morley M, Ewens WJ, Cheung VG 2007. Common genetic variants account for differences in gene expression among ethnic groups. Nat Genet 39: 226–231 [DOI] [PMC free article] [PubMed] [Google Scholar]
- Stark A, Brennecke J, Russell RB, Cohen SM 2003. Identification of Drosophila microRNA targets. PLoS Biol 1: e60 doi: 10.1371/journal.pbio.0000060 [DOI] [PMC free article] [PubMed] [Google Scholar]
- Storey JD, Madeoy J, Strout JL, Wurfel M, Ronald J, Akey JM 2007. Gene-expression variation within and among human populations. Am J Hum Genet 80: 502–509 [DOI] [PMC free article] [PubMed] [Google Scholar]
- Stranger BE, Forrest MS, Clark AG, Minichiello MJ, Deutsch S, Lyle R, Hunt S, Kahl B, Antonarakis SE, Tavare S, et al. 2005. Genome-wide associations of gene expression variation in humans. PLoS Genet 1: e78 doi: 10.1371/journal.pgen.0010078 [DOI] [PMC free article] [PubMed] [Google Scholar]
- Stranger BE, Forrest MS, Dunning M, Ingle CE, Beazley C, Thorne N, Redon R, Bird CP, de Grassi A, Lee C, et al. 2007a. Relative impact of nucleotide and copy number variation on gene expression phenotypes. Science 315: 848–853 [DOI] [PMC free article] [PubMed] [Google Scholar]
- Stranger BE, Nica AC, Forrest MS, Dimas A, Bird CP, Beazley C, Ingle CE, Dunning M, Flicek P, Koller D, et al. 2007b. Population genomics of human gene expression. Nat Genet 39: 1217–1224 [DOI] [PMC free article] [PubMed] [Google Scholar]
- Tang T, Kumar S, Shen Y, Lu J, Wu M-L, Shi S, Li W-H, Wu C-I 2010. Adverse interactions between micro-RNAs and target genes from different species. Proc Natl Acad Sci 107: 12935–12940 [DOI] [PMC free article] [PubMed] [Google Scholar]
- Waddington CH 1942. Canalization of development and the inheritance of acquired characters. Nature 150: 563–565 [DOI] [PubMed] [Google Scholar]
- Waddington CH 1953. Genetic assimilation of an acquired character. Evolution 7: 118–126 [Google Scholar]
- Waddington CH 1956. Genetic assimilation of the bithorax phenotype. Evolution 10: 1–13 [Google Scholar]
- Wang L, Oberg AL, Asmann YW, Sicotte H, McDonnell SK, Riska SM, Liu W, Steer CJ, Subramanian S, Cunningham JM, et al. 2009. Genome-wide transcriptional profiling reveals microRNA-correlated genes and biological processes in human lymphoblastoid cell lines. PLoS ONE 4: e5878 doi: 10.1371/journal.pone.0005878 [DOI] [PMC free article] [PubMed] [Google Scholar]
- Wienholds E, Plasterk RH 2005. MicroRNA function in animal development. FEBS Lett 579: 5911–5922 [DOI] [PubMed] [Google Scholar]
- Wu CI, Shen Y, Tang T 2009. Evolution under canalization and the dual roles of microRNAs: A hypothesis. Genome Res 19: 734–743 [DOI] [PMC free article] [PubMed] [Google Scholar]
- Xie X, Lu J, Kulbokas EJ, Golub TR, Mootha V, Lindblad-Toh K, Lander ES, Kellis M 2005. Systematic discovery of regulatory motifs in human promoters and 3′ UTRs by comparison of several mammals. Nature 434: 338–345 [DOI] [PMC free article] [PubMed] [Google Scholar]
- Zamore PD, Haley B 2005. Ribo-gnome: The big world of small RNAs. Science 309: 1519–1524 [DOI] [PubMed] [Google Scholar]
- Zhang R, Su B 2008. MicroRNA regulation and the variability of human cortical gene expression. Nucleic Acids Res 36: 4621–4628 [DOI] [PMC free article] [PubMed] [Google Scholar]
- Zhang Z, Ersoz E, Lai C-Q, Todhunter RJ, Tiwari HK, Gore MA, Bradbury PJ, Yu J, Arnett DK, Ordovas JM, et al. 2010. Mixed linear model approach adapted for genome-wide association studies. Nat Genet 42: 355–360 [DOI] [PMC free article] [PubMed] [Google Scholar]