

Abstract
Eukaryotic circadian clocks include transcriptional/translational feedback loops that drive 24-h rhythms of transcription. These transcriptional rhythms underlie oscillations of protein abundance, thereby mediating circadian rhythms of behavior, physiology, and metabolism. Numerous studies over the last decade have used microarrays to profile circadian transcriptional rhythms in various organisms and tissues. Here we use RNA sequencing (RNA-seq) to profile the circadian transcriptome of Drosophila melanogaster brain from wild-type and period-null clock-defective animals. We identify several hundred transcripts whose abundance oscillates with 24-h periods in either constant darkness or 12 h light/dark diurnal cycles, including several noncoding RNAs (ncRNAs) that were not identified in previous microarray studies. Of particular interest are U snoRNA host genes (Uhgs), a family of diurnal cycling noncoding RNAs that encode the precursors of more than 50 box-C/D small nucleolar RNAs, key regulators of ribosomal biogenesis. Transcriptional profiling at the level of individual exons reveals alternative splice isoforms for many genes whose relative abundances are regulated by either period or circadian time, although the effect of circadian time is muted in comparison to that of period. Interestingly, period loss of function significantly alters the frequency of RNA editing at several editing sites, suggesting an unexpected link between a key circadian gene and RNA editing. We also identify tens of thousands of novel splicing events beyond those previously annotated by the modENCODE Consortium, including several that affect key circadian genes. These studies demonstrate extensive circadian control of ncRNA expression, reveal the extent of clock control of alternative splicing and RNA editing, and provide a novel, genome-wide map of splicing in Drosophila brain.
Circadian timekeeping in all eukaryotes involves networks of genes that interact in transcriptional/translational feedback loops to generate oscillations of RNA transcript and protein abundance with period lengths of ∼24 h (Ko and Takahashi 2006). The molecular mechanisms underlying circadian rhythms are remarkably well conserved between mammals and Drosophila melanogaster, in many cases involving homologs of the same proteins (Yu and Hardin 2006; Allada and Chung 2010). For example, the orthologous Drosophila and mammalian period genes encode crucial components of the transcriptional repressor complex that closes the negative-feedback loop essential for circadian oscillation. In the fly, the central circadian timekeeper that controls daily rhythms of rest and activity is a network of so-called clock neurons that integrate entraining environmental inputs, such as light and temperature, and drive behavioral output rhythms (Nitabach and Taghert 2008; Allada and Chung 2010). Transcriptional/translational oscillations within clock neurons drive rhythms of neuronal activity and neuropeptide release, ultimately resulting in daily rhythms of locomotor behavior (Nitabach and Taghert 2008; Allada and Chung 2010). This central clock also orchestrates autonomous circadian oscillations in peripheral tissues to generate rhythms of metabolism and physiology (Hastings et al. 2003; Kornmann et al. 2007). In both central and peripheral tissues, oscillations in abundance of key components of the circadian timekeeping mechanism—such as Clock and period—drive transcriptional rhythms of clock output genes that are not involved in the timekeeping mechanism itself, but underlie behavioral and physiological circadian rhythms (Doherty and Kay 2010).
Extensive, genome-wide efforts have been made to identify circadian-regulated genes in various tissues of flies and mammals, starting ∼10 yr ago. In the case of Drosophila, five studies were published in close succession using microarrays to identify rhythmic transcripts in fly heads in both entrained (12 h:12 h light:dark) and free-running (24 h dark) conditions, as well as in mutant backgrounds with disrupted circadian oscillations (Claridge-Chang et al. 2001; McDonald and Rosbash 2001; Ceriani et al. 2002; Lin et al. 2002; Ueda et al. 2002). Fly heads contain multiple tissues, including the compound eye and other sensory organs, the fat body (functionally analogous to the mammalian liver), and brain. These studies individually discovered between several dozen and several hundred rhythmic transcripts, but outside of a restricted set of key genes underlying the circadian oscillator mechanism, there was surprisingly little agreement in the identities of these rhythmic transcripts (Jackson and Schroeder 2001; Etter and Ramaswami 2002; Duffield 2003). A variety of reasons likely underlie these differences, including methods of data condensation (Walker and Hogenesch 2005), statistical approaches for discovering rhythmic transcripts (Wijnen et al. 2006; Keegan et al. 2007), and time-point sampling density (Hughes et al. 2007). To reconcile these differences, two meta-analyses have standardized data condensation and statistical analyses while leveraging the additional statistical power afforded by the consolidation of multiple data sets (Wijnen et al. 2006; Keegan et al. 2007). Taken together, 45 genes (∼60%) were found to be rhythmic by both meta-analyses, thus comprising a canonical set of circadian-regulated genes, many of which have been further validated by Northern blot analysis and quantitative PCR (qPCR) (Wijnen et al. 2006; Keegan et al. 2007). Additionally, more than 100 transcripts were identified that show statistically significant oscillations in at least one of the two meta-analyses, providing a secondary list of high-confidence candidates for clock regulation.
More recently, microarray studies of the fly circadian transcriptome have been refined to more specific cell and tissue types. A pair of studies used the Gal4/UAS binary expression system to fluorescently label specific subsets of circadian clock neurons in dissociated brain tissue. These labeled neurons were, in turn, manually isolated and transcriptionally profiled, resulting in the identification of transcripts enriched in clock neurons and a more refined list of cycling candidates whose transcriptional oscillations occur specifically in central clock neurons (Kula-Eversole et al. 2010; Nagoshi et al. 2010). In another case, the fat body was dissected from adult flies and analyzed with microarrays to identify cycling transcripts in a non-neuronal tissue (Xu et al. 2011). Interestingly, this study identified several cycling genes whose orthologs also cycle in the mouse liver (Hughes et al. 2009), suggesting common mechanisms of peripheral circadian output in mammals and flies. Finally, microRNA (miRNA)–specific microarrays have been used to detect several oscillatory miRNAs in the fly head, providing evidence for both circadian regulation of miRNA abundance and reciprocal miRNA-mediated regulation of circadian oscillations (Yang et al. 2008; Kadener et al. 2009).
Recent advances in high-throughput RNA sequencing (RNA-seq) methods offer the potential to dramatically improve on these prior studies (Marguerat and Bähler 2010). Using RNA-seq, vast numbers of RNA molecules from a sample of tissue or cells are sequenced in a highly parallel fashion. These sequences are then aligned to a reference genome or transcriptome, and the expression level of any given genomic feature can be inferred from the depth of sequencing coverage (i.e., the number of sequenced reads aligning to that feature). As a result, the expression values derived from RNA-seq data are more highly quantitative than microarrays, with considerably larger dynamic ranges (Wang et al. 2009). Unlike microarrays, RNA-seq is largely unbiased by existing genome and transcriptome annotations, and thus results are not constrained by the probesets that happen to be included on a given chip. Consequently, RNA-seq may be used to detect novel transcripts and splicing events that would not otherwise have been detected (Graveley et al. 2011; Ozsolak and Milos 2011). Importantly, RNA-seq data can be used to detect and quantify alternative splicing and RNA editing events at a much higher resolution than traditional microarrays (Graveley et al. 2011; Ozsolak and Milos 2011).
These advantages over microarrays have been dramatically highlighted by the recent publication of fly transcriptome RNA-seq analyses performed by the modENCODE Consortium and others (Daines et al. 2011; Graveley et al. 2011). By sequencing and cataloging RNA harvested from Drosophila at numerous time points throughout development, these studies have significantly expanded our catalog of the number of transcripts, splicing events, and RNA editing events in the fly transcriptome (Graveley et al. 2011). As a consequence, we have a much greater understanding of the scale and nature of complexity of Drosophila developmental gene expression. This tremendous and hitherto undiscovered complexity of the fly developmental transcriptome suggests that applying RNA-seq to the circadian transcriptome will be equally valuable in dramatically expanding our understanding of circadian biology.
Here we use RNA-seq to profile the circadian transcriptome of Drosophila brain in wild-type and period-null mutant (per0) animals. Our results substantially agree with legacy data sets, including the transcriptional profiles of key clock genes as well as the number and identity of other transcripts regulated by period and the circadian clock. However, the use of RNA-seq allowed us to identify many oscillatory transcripts (especially noncoding RNAs) that were not accessible using previous generations of microarrays and, in some cases, entirely unknown before the recent publication of the modENCODE fly developmental transcriptome (Graveley et al. 2011). By comparing our results to modENCODE annotations, we identified novel splicing events in several genes (including key clock components) that have not been accounted for in existing gene models. Furthermore, the single-base resolution of RNA-seq allowed us to globally assess two outstanding questions in the circadian field: the degree to which the clock regulates differential splice isoform abundance and whether it regulates RNA editing. We found that period loss of function dramatically changes both splice isoform regulation and RNA editing, while time of day has a much more muted effect on both.
Results
Sample collection, sequencing, and alignment
Canton-S (wild-type) and per0 flies (in a Canton-S background) were raised in a 12 h:12 h light:dark (LD) environment throughout pupation and for 3–5 d after eclosion. Behavioral monitoring confirms that wild-type flies have normal locomotor rhythms with peak activity concentrated around dawn and dusk (Fig. 1A). These wild-type flies show expected levels of anticipatory behavior with activity levels ramping up immediately before both lights-on and lights-off. In contrast, per0 flies show no significant anticipatory behavior, consistent with their complete absence of circadian transcriptional feedback oscillations (Fig. 1A; Konopka and Benzer 1971; Hardin 2006).
Figure 1.

RNA-seq accurately measures circadian transcriptional rhythms. (A) Locomotor activity rhythms were monitored using an automated infrared beam-break apparatus in wild-type and per0 flies entrained to a 12 h:12 h light:dark (LD) environment (N = 32 flies for each experiment). Plots are histograms of beam-breaks binned at a 20-min resolution. At the times indicated in red, brains were dissected and total RNA was purified for amplification and RNA-seq analysis. (B) Raw RNA-seq reads were aligned to the reference fly genome and transcriptome using the RUM read mapping algorithm, and expression levels (presented as reads per kilobase per million reads, RPKM) were calculated. Transcript expression levels exhibit a high degree of reproducibility between biological replicates with R-squared values on the order of 0.99. Expression profiles for Clock (C) and timeless (D) show consistent patterns of circadian oscillation in wild-type brains (solid lines) as measured by RNA-seq. Period-null mutation (dashed lines) disrupts the normal circadian rhythmicity of each of these transcripts. Clock and timeless oscillate in both LD (red) and DD (blue) with expected phases, and their amplitudes are damped in DD relative to LD, also as expected. The x-axis labels show the Zeitgeber time (ZT) for LD experiments and circadian time (CT) for wild-type Canton-S flies in DD.
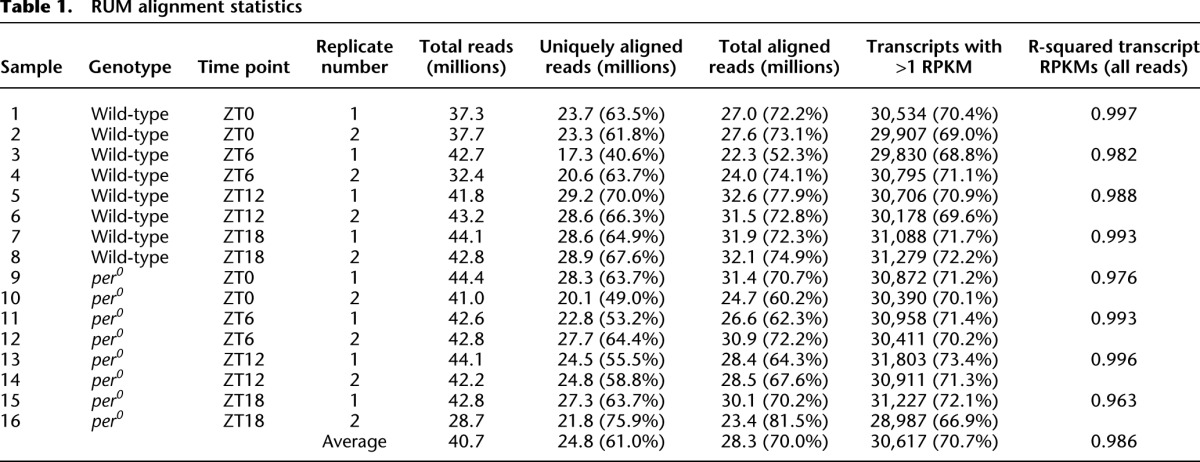
Ten to 12 fly brains were collected every 6 h for two consecutive days in LD conditions from both genotypes (Fig. 1A). In contrast to previous microarray studies, total RNA was purified from manually dissected brains rather than the entire fly head (Claridge-Chang et al. 2001; McDonald and Rosbash 2001; Ceriani et al. 2002; Lin et al. 2002; Ueda et al. 2002). Since the fat body, fly eye, and other sensory organs are major contributors to the RNA isolated from fly heads (Wijnen et al. 2006), this difference from previous studies will enrich our data set for transcripts cycling in the brain while dramatically diminishing RNA contributions from non-brain tissue. Total RNA was amplified, and ribosomal RNA was depleted, using a non-poly(A)-based amplification kit, which significantly diminishes the 3′ bias in downstream libraries used for RNA-seq (see Methods). Sequencing libraries were prepared from amplified RNA using standard techniques and then sequenced on an Illumina GAIIx high-throughput sequencer using one flow-cell lane per sample to generate 100-bp paired-end reads. On average, each sample generated more than 40 million high-quality short nucleotide reads (Table 1).
Table 1.
RUM alignment statistics
Two additional complementary data sets were collected and analyzed in parallel. First, brain samples were dissected from Canton-S (wild-type) and y w, per0 flies spanning two time points (Zeitgeber Time [ZT] 0 and 12, corresponding to lights-on and lights-off, respectively) over two consecutive days. These samples were amplified using a poly(A)-based kit and sequenced with single-end, 75-bp reads (Supplemental Table S1). This data set was used to assess the bias introduced by an alternative amplification methods and examine the reproducibility of period-regulated genes in an independent genetic background (see Methods).
Second, brain samples were collected from Canton-S and per0 flies on the second and third days of constant darkness (DD). This data set was used to identify circadian-regulated transcripts in the absence of zeitgebers. In constant conditions, wild-type flies maintain daily rhythmicity with a period length slightly shorter than 24 h (Supplemental Fig. S1A). In contrast, per0 flies were arrhythmic in this condition (Supplemental Fig. S1B). Samples were collected every 4 h for two consecutive days, starting on the first subjective day (CT24). These samples were amplified using a non-poly(A)-based kit and sequenced with paired-end, 75-bp reads (Supplemental Table S2).
Raw reads for all three data sets were aligned to the genome and transcriptome using RUM (RNA-seq Unified Mapper) (Grant et al. 2011). The gene models used for these alignments were derived from the recently published modENCODE fly transcriptome (Graveley et al. 2011), ensuring that the resulting alignments are based on the most comprehensive transcriptome annotations available. On average, RUM uniquely aligned 24.8 million reads per sample in the LD samples (61.0% of total reads). Including multiple-aligning reads (i.e., reads that align to multiple sites within the genome and thus cannot be unambiguously mapped to a single locus), a total of 28.3 million reads (70.0% of total reads) per sample were successfully aligned by RUM (Table 1; as well as Supplemental Tables S1, S2). Multiple-aligning reads can occur when they represent highly conserved sequences of genes within families containing multiple members. Taken together, these data represent more than 1.2 billion short nucleotide reads and 140 Gb of successfully aligned sequence, thus constituting the deepest sequencing by far of any circadian transcriptome to our knowledge.
Expression levels were computed as reads per kilobase per million reads (RPKM) for individual transcripts. On average, the reproducibility between replicate samples (i.e., samples from the same genotype and time point on different days) was excellent, with average R2 values approaching 0.99 (Fig. 1B; Table 1; Supplemental Tables S1, S2). RPKMs calculated for individual exons (Supplemental Fig. S1C) and introns (Supplemental Fig. S1D) also show good levels of reproducibility with R2 values equal to 0.99 and 0.80, respectively. As expected, introns show considerably lower average expression levels than exons (Supplemental Fig. S1), although the presence of significant sequencing depth within some introns suggests both the retention of introns in some transcripts as well as the presence of transcription units not accounted for by current gene models. Consistent with the first possibility, in some cases, we detect reads that span intron:exon junctions (data not shown). The RPKM values calculated solely from uniquely aligning reads generally agreed with the RPKMs calculated from all aligning reads. However, the R2 values of replicate pairs are consistently higher when RPKMs are calculated from all aligned reads (Supplemental Fig. S1E), suggesting that non-unique reads convey significant information about transcript expression levels.
To verify that our samples and our analytical approach accurately measure circadian transcriptional rhythms, we manually examined the expression pattern of known cycling genes. We found that Clock (Fig. 1C) is rhythmic in both LD and DD, with peak expression in the morning and trough expression in the evening, as expected from previous work (Claridge-Chang et al. 2001; McDonald and Rosbash 2001; Ceriani et al. 2002; Lin et al. 2002; Ueda et al. 2002). Conversely, timeless (Fig. 1D), period, and vrille (data not shown) exhibit peak expression in the evening and trough expression in the morning. Notably, the amplitude of clock genes is damped in DD vs. LD. In addition, peak expression on day 2 is generally higher than peak expression on day 3, indicating a progressive diminishment of amplitude in constant conditions. Also consistent with previous studies, every transcript examined is nonrhythmic in per0 flies. Specifically, Clock is maintained at a constitutively low expression level, and period, timeless, and vrille at a constitutively high expression level (Hardin 2006). Finally, we compared the expression levels of these genes as measured by RNA-seq with samples independently assayed by quantitative PCR (qPCR). In every case, qPCR and RNA-seq profiles show close agreement (Supplemental Fig. S1F; data not shown). Taken as a whole, these results establish that RNA-seq quantification accurately reflects circadian transcriptional activity.
Differential expression and identification of rhythmic transcripts
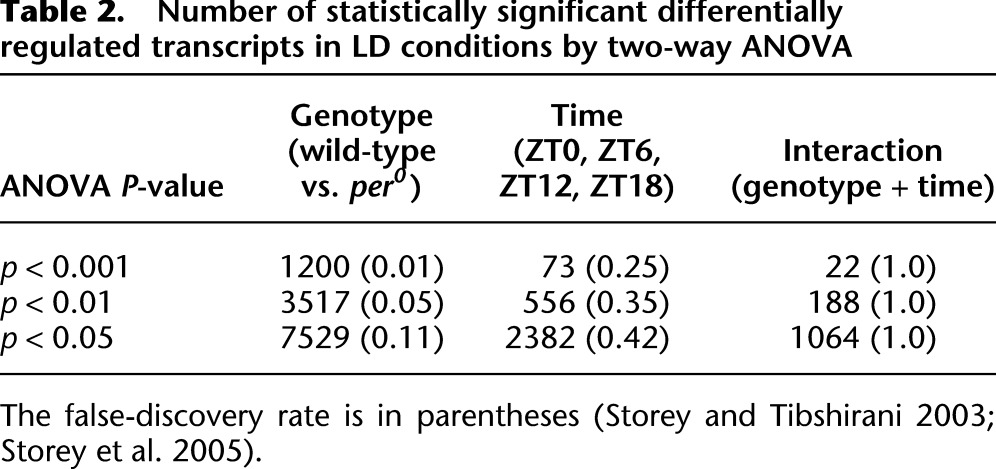
A variety of statistical approaches have been used to detect rhythmic components in complex, genome-scale data sets, including curve fitting (Panda et al. 2002; Michael et al. 2008), Fourier transforms (Wichert et al. 2004; Wijnen et al. 2005), and autocorrelation (Levine et al. 2002). In every statistical approach used, application of a false discovery rate correction is essential to accurately estimate the number of true positives at any given statistical threshold. Previous analyses of circadian microarray experiments in flies revealed that a prescreening step to exclude any obviously nonrhythmic transcripts from further consideration significantly improved the power of subsequent statistical tests (Wijnen et al. 2006; Keegan et al. 2007). To this end, we filtered out all transcripts whose median expression level across every sample was fewer than 5 RPKM. As a second filter, we performed a two-way ANOVA statistical analysis on these data with factors of genotype and time-of-day in order to (1) identify transcripts whose expression levels are regulated by period and (2) identify and exclude transcripts whose expression shows no detectable dependence on either time of day or genotype.
Table 2 shows the number of transcripts with statistically significant differences in LD conditions due to time, genotype, or the interaction of the two. At every statistical threshold examined, period loss of function (i.e., genotype) affected considerably more transcripts than time of day. This observation is consistent with previous microarray studies (Lin et al. 2002) and indicates that complete loss of period function has greater effects on the fly brain transcriptome than daily oscillations of period expression levels. To explore the transcriptional changes downstream from period further, we applied three post hoc statistical criteria to identify a set of high-confidence transcripts differentially expressed in per0 brains. First, we reasoned that most transcriptional changes due to period loss of function should be independent of the genetic background in which the data were collected. Thus, we required that every candidate have a false discovery rate (i.e., q-value) <0.2 in both data sets (Canton-S vs. per0, and Canton-S vs. y w, per0). Second, the direction of differential expression (i.e., up- or down-regulation) had to be identical between the two data sets. Third, to eliminate modest expression-level changes of doubtful functional significance, the magnitude of change in both data sets must have been >50% (i.e., a fold-change that could be reliably validated by qPCR).
Table 2.
Number of statistically significant differentially regulated transcripts in LD conditions by two-way ANOVA
Based on these criteria, we identified 1167 transcripts derived from 545 genes that are significantly regulated by period loss of function in LD (Supplemental Table S3). Since our purpose for this analysis was to identify the highest-confidence hits possible, we have chosen deliberately stringent criteria. However, it is important to note that many true positives may have been excluded based on q-values or fold-changes that narrowly missed inclusion in one data set or the other. We also note that 913 of these 1167 (78.2%) differentially regulated transcripts in LD were also differentially regulated (q < 0.2) in DD, thereby increasing the confidence in the accuracy of these identifications (Supplemental Table S4).
Importantly, the period-regulated transcripts identified by this analysis substantially overlap with previous microarray studies. We reanalyzed a previously published y w, per0 data set (Lin et al. 2002) using two-way ANOVA and false discovery corrections based on the method of Storey et al. (Storey and Tibshirani 2003; Storey et al. 2005). Of the 545 genes identified as differentially expressed in our data set, 350 were included in the probesets of the microarrays used in this previous study (Lin et al. 2002). Of these 350 genes, 41.7% exhibit q-values below 0.05 in the microarray data set. This agreement in the genes identified as period-regulated between these experiments is remarkable considering the differences in tissue (brains vs. heads), background genotypes (Canton-S vs. y w), and expression assays (RNA-seq vs. microarrays) (Supplemental Table S5).
The expression profiles of the period-regulated genes we have identified are plotted as heatmaps in Figure 2. Although period encodes the canonical transcriptional repressor of the circadian feedback oscillator, the number of transcripts up- vs. down-regulated is approximately equal, again consistent with microarray analyses of clock gene mutations (Lin et al. 2002; Xu et al. 2011). Presumably, period influences the expression level of many transcripts (particularly those that are down-regulated by per loss of function) via indirect mechanisms. Two examples of transcripts regulated by period are shown in Figure 2, C and D. Tequila, down-regulated by period loss of function by at least fourfold at every time point, is an endopeptidase thought to regulate long-term memory formation (Didelot et al. 2006). Cyp4p1 is a cytochrome P450 gene (Dunkov et al. 1996) and is up-regulated by at least fourfold in every sample. We performed Gene Ontology (GO) analysis using NCBI's DAVID resource to identify enriched ontological categories within these genes (Supplemental Table S6; Huang et al. 2008) and determined the molecular function for each gene based on FlyBase annotations (Supplemental Fig. S2). There were several ontological categories that were modestly enriched in the set of genes differentially regulated by period (e.g., genes involved in drug metabolism and phototransduction) (Supplemental Fig. S2A,B), but on the whole, period loss of function influences a wide array of molecular and biological functions (Supplemental Fig. S2C).
Figure 2.

Transcripts differentially regulated by period. Two-way ANOVA was used to identify transcripts differentially regulated by per0 in both non-poly(A)- (A) and poly(A)-amplified (B) data sets. Median-normalized expression levels have been sorted by fold change (FC) (average wild-type expression in RPKM divided by average per0 expression in RPKM) and are represented as a heatmap for each transcript (vertical axis) at each time point (horizontal axis) surveyed, with yellow indicating high levels of expression, and blue, low levels. White and black bars represent light and dark, respectively, in the LD environmental regimen under which these samples were collected. The order of transcripts along the vertical axis is identical in A and B. Tequila-RB (C) and Cyp4p1-RA (D) are examples of transcripts whose expression is significantly altered between wild-type (blue) and Period loss-of-function (red). (Error bars) Mean ± standard error of the mean.
We also used two-way ANOVA to exclude transcripts whose expression shows no dependence on either period or time of day (p > 0.1 in all ANOVA comparisons) from further consideration, similar to the approach taken by previous analyses of fly transcriptional rhythms (Wijnen et al. 2006; Keegan et al. 2007). Transcripts not excluded by this criterion were analyzed using two different statistical methods for detecting oscillations: JTK_Cycle (Hughes et al. 2010) and Fisher's G-test (Wichert et al. 2004). Table 3 shows the number of rhythmic transcripts identified by these algorithms at particular P-value thresholds and the corresponding false discovery rates (FDRs). At a cutoff of p < 0.01, these algorithms each detect >100 cycling transcripts in LD and DD, roughly consistent with previous microarray studies (Claridge-Chang et al. 2001; McDonald and Rosbash 2001; Ceriani et al. 2002; Lin et al. 2002; Ueda et al. 2002). In LD we detect 415 transcripts with statistical evidence for rhythmicity (p < 0.01 for either JTK_cycle or Fisher's G-test) corresponding to 182 distinct genes. At the same statistical cutoff, we detect 424 cycling transcripts in DD, corresponding to 159 distinct genes. Only nine cycling genes in LD were also found to cycle in DD at this statistical threshold, including most components of the core molecular oscillator. This is consistent with a significant divergence between the oscillatory transcriptome in LD vs. DD, and also consistent with previous comparisons of DD and LD using microarrays (Lin et al. 2002). Estimated FDRs for both JTK_Cycle and Fisher's G-test in both data sets are shown in Table 3. These FDRs are expected given the temporal sampling density of our data set, and they are consistent with excellent integrity of the underlying biological samples (Hughes et al. 2007, 2009). We have identified with good confidence a large number of transcripts oscillating with circadian periods, and in both LD and DD, the cycling profiles of known circadian genes were in precise agreement with expectations. The complete list of cycling transcripts and all associated statistics are provided in Supplemental Tables S7 (LD) and S8 (DD).
Table 3.
Number of cycling transcripts detected by JTK_Cycle and Fisher's G-test in LD and DD conditions
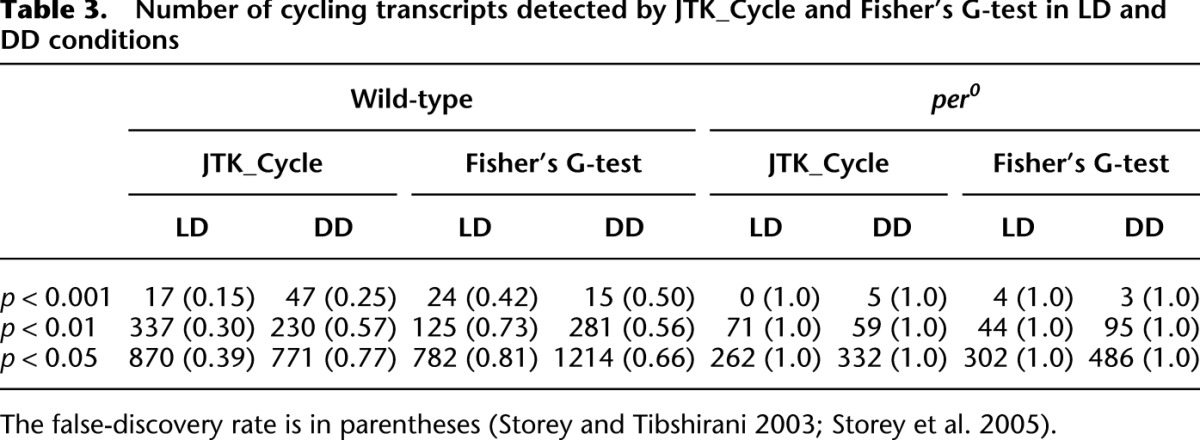
The expression levels of cycling transcripts are plotted as a heatmap for both wild-type and per0 brains, ordered by the phase of peak expression in wild-type animals (Fig. 3A,B). While two clear peaks of expression occurring at roughly the same time on the 2 d of the experiment are seen in wild-type brains, the same transcripts are largely arrhythmic in per0. At every statistical threshold examined, wild-type brains exhibit considerably more cycling transcripts than per0, and FDRs in per0 are equal to 1.0 even at extremely low P-value cutoffs. This indicates weak or severely dampened circadian transcriptional output in these animals, consistent with the expectation that genuine circadian-regulated genes will be arrhythmic in per0 (Table 3). We detect a small number of transcripts with extremely low P-values in both wild-type and per0 brains in LD, suggesting that these transcripts are driven primarily by environmental light cycles rather than the circadian clock (Supplemental Table S9).
Figure 3.

Twenty-four-hour transcriptional rhythms. The fold-changes (FC) of median-normalized cycling transcripts (p < 0.05, Fisher's G-test) are plotted as a heatmap for LD (A) and DD (B) samples. Transcripts are ordered by phase, as measured by JTK_Cycle. The order of transcripts along the vertical axis is identical between wild-type and per0. Distribution of amplitudes (maximum expression divided by minimum expression) of cycling transcripts for LD (C) and DD (D) samples; (inset) individual amplitudes of transcripts encoding key circadian clock components. Molecular functions as annotated in FlyBase of cycling genes are displayed as a pie chart for LD (E) and DD (F) (p < 0.05 for both JTK_Cycle and Fisher's G-test).
RNA-seq is capable of accurately quantifying expression levels over five orders of magnitude. In both LD and DD, the amplitudes of most cycling genes are in a narrow range on the order of twofold or less (Fig. 3C,D). At the same time, a minority of circadian transcripts (principally clock genes involved in the timekeeping mechanism itself) oscillate at high amplitude. This bimodal distribution is consistent with previous studies in both mammals and flies (e.g., Hughes et al. 2009). Interestingly, although the bulk of cycling genes in both LD and DD show the same range of amplitudes, core clock components are damped in DD (for examples, see Fig. 1C,D). This observation was independently confirmed by qPCR for additional clock genes (data not shown) and is consistent with previous immunocytochemical studies of central clock neuron oscillation in DD (Nitabach et al. 2006).
To assess agreement between our RNA-seq experiments and previous microarray studies, we considered the 45 genes that were identified as cycling in both previous microarray meta-analyses (Wijnen et al. 2006; Keegan et al. 2007). In our LD RNA-seq data set, 16 of these 45 genes (36%) have P-values <0.05 using either JTK_Cycle or Fisher's G-test (Supplemental Table S10). This degree of overlap is similar to that found between the original fly microarray studies (Claridge-Chang et al. 2001; McDonald and Rosbash 2001; Ceriani et al. 2002; Lin et al. 2002; Ueda et al. 2002), although less than the ∼60% agreement seen between the two meta-analyses (Wijnen et al. 2006; Keegan et al. 2007). Similarly, 11 of these 45 genes were found to cycle in our DD data set, including three genes that were not identified as cyclers in LD. There is less agreement in the identity of LD environmentally driven genes between our study (Supplemental Table S9) and the legacy fly head microarray data sets (Wijnen et al. 2006), but many of the genes previously identified are enriched in eye tissue (Wijnen et al. 2006) and are thus depleted from our data set. Given the differences in background genotypes, sampling density, statistical methodology, tissue type, and expression analysis, there is remarkable consistency between our RNA-seq results and previous microarray studies. This strongly supports the conclusion that our RNA-seq analysis accurately reflects the underlying circadian biology of Drosophila brain.
The proteins encoded by these cycling genes possess a wide array of molecular functions, notably including kinases, GTPases, and nucleotide binding proteins in both LD (Fig. 3E) and DD (Fig. 3F). Interestingly, ∼10% of the cycling genes we have identified are noncoding RNAs (ncRNAs). The ncRNA subset of the circadian transcriptome has not previously been systematically cataloged. Many of these ncRNAs (e.g., nc_11800.b and nc_22683.a) have no known function and had not been previously annotated until the recent release of the modENCODE developmental fly transcriptome (Graveley et al. 2011). Notably, a pair of U snoRNA host genes (Uhg1 and Uhg4) have P-values <0.05 for both JTK_Cycle and Fisher's G-test. Closer examination of this family of genes indicates that seven of the eight Uhgs (all but Uhg7) show evidence of rhythmic and/or time-dependent behavior in LD, either by ANOVA, JTK_Cycle, or Fisher's G-test (Supplemental Table S11).
Like typical protein-coding genes, each Uhg contains multiple exons that are spliced together into a mature transcript. Unlike protein-coding genes, however, almost all mature Uhg transcripts are never translated and instead are targeted for degradation (Tycowski and Steitz 2001). The excised Uhg introns do not encode proteins and are further processed to generate mature small nucleolar RNAs (snoRNAs), which participate in ribosomal RNA (rRNA) processing (Kiss 2002). One of the rhythmic Uhgs is shown in Figure 4. Uhg6/Nop60B is the sole Uhg whose spliced exonic transcript encodes a protein. The Uhg6/Nop60B coding sequence is separated from the more typical Uhg domains by a long intron; the 3′ end of the gene does not encode protein and instead contains the introns that will ultimately be processed into mature snoRNAs. Figure 4A shows the time-dependent profile of the depth of RNA-seq coverage for this gene. These expression values are quantified in Figure 4, B and C. The first six exons of Uhg6/Nop60B show little evidence of circadian rhythmicity (Fig. 4B). In contrast, the seven noncoding exons at the 3′ end show high-amplitude oscillations with peak expression during the light phase of the LD cycle (Fig. 4C). We speculate that the difference between the cycling profiles of these two subsets of Uhg6/Nop60B exons may be due to an internal transcriptional start site specifically regulating the noncoding 3′ portion of this gene. High-amplitude oscillation of the noncoding exons of Uhg6/Nop60B suggests that the snoRNAs they host may also cycle. The RNA purification, amplification, and sequencing protocols we used to generate libraries for RNA-seq are biased toward longer RNAs. Thus the depth of sequencing coverage for small RNAs like snoRNAs is significantly lower than for mRNAs or long ncRNAs. In addition, it is uncertain whether reads aligning to snoRNA regions derive from mature snoRNAs, unprocessed excised introns, or unspliced precursor transcripts. Interestingly, however, all five of the small RNA sequences in Uhg6/Nop60B that were detectable in our RNA-seq data set oscillate in phase with the noncoding exons of the host gene (Fig. 4D).
Figure 4.

The noncoding region of Nop60B (Uhg6) oscillates with peak expression at ZT6. (A) The Nop60B.a transcript includes six protein-coding exons and seven noncoding exons ([solid black bars] exons) separated by a large intron (thin blue line). Smaller introns separating exons 7–13 are excised from Nop60B.a transcripts and processed to form mature snoRNAs and snmRNAs. (Black boxes) Mature ncRNAs expressed at detectable levels; (gray boxes) undetectable ncRNAs. (Red histograms) The depth of sequencing coverage in this region at ZT0, ZT6 (peak), ZT12, and ZT18 (trough). (B) Expression levels of Nop60B's coding exons show weak or nonexistent circadian oscillations while the noncoding exons (C) and (the median-normalized) ncRNAs they encode (D) oscillate with peak expression at ZT6.
The LD transcriptional profiles of rhythmic transcripts from seven Uhgs are plotted as a heatmap in Figure 5A. All seven of these genes exhibit peak expression during the light phase of the LD cycle. These rhythms have been validated independently of RNA-seq using semiquantitative reverse-transcriptase PCR (Supplemental Fig. S3). Many of these genes exhibit similar, but phase-delayed, oscillations in per0 brains, raising the possibility that these rhythms are regulated by both the circadian timekeeper and light input. Uhg1, for example, is among the genes we identified as being driven by light in both wild-type and per0 (Supplemental Tables S6, S9). As mentioned above, it is difficult to distinguish reads aligning to mature snoRNAs vs. those aligning to the excised, but unprocessed, introns, or to unspliced precursor transcripts. Regardless, RNA-seq read depth of the snoRNA sequences in these genes also oscillates in phase the underlying Uhg rhythms (Fig. 5B), suggesting that Uhg oscillations result in rhythms of snoRNA abundance.
Figure 5.

Multiple Uhg-family members oscillate with peak expression during the light phase. (A) Fold-changes of median-normalized expression levels of Uhg-family members are shown as a heatmap. (White and black bars) The LD regimen under which these samples were collected. The order of transcripts along the vertical axis is identical between wild-type and per0. Note that in per0 brains, peak Uhg expression is phase-delayed by ∼6 h. (B) The fold-changes of all snoRNAs and snmRNAs encoded by Uhg genes and expressed at a detectable level are median-normalized and displayed as a heatmap. (C) Expression levels of all cycling Uhg-family members in DD are damped relative to the light phase of LD. The light phase is defined as ZT0 and ZT6 for LD samples, and CT0, CT4, and CT8 for DD samples. (Error bars) Mean ± standard error of the mean.
To determine whether Uhg oscillations persist in the absence of zeitgebers, we assessed their expression levels in DD. Every Uhg gene tested was entirely arrhythmic or severely damped under constant conditions. In fact, the expression levels of practically all Uhg transcripts are considerably lower in DD compared with their peak expression in LD (Fig. 5C). There are only two exceptions to this observation: (1) Uhg7-RA, which is arrhythmic in LD; and (2) Nop60B/Uhg6-RA, which does not include the snoRNA host region and is also arrhythmic in LD (see Fig. 4B).
It is important to note that other components of the snoRNA machinery are not oscillatory in our data set. For example, Fibrillarin (Fib), the enzyme responsible for methylating rRNA in conjunction with snoRNAs, is nonrhythmic in both LD and DD (Supplemental Fig. S4A,B). Likewise, no other snoRNA host gene in Drosophila shows rhythmic expression in our data set (Supplemental Fig. S4C). Based on these results, we conclude that Uhg family members—and only Uhg family members—are snoRNA host genes whose expression is driven by light cues, and potentially influenced by the circadian clock.
Given the oscillatory behavior of lncRNAs and snoRNAs in these data, it would be of interest to identify miRNAs that are similarly regulated. Unfortunately, given the size cutoff of our RNA purification and amplification, depth of sequencing coverage at miRNA loci was insufficient to detect oscillations reliably. From this observation, we conclude that a fully comprehensive analysis of oscillatory ncRNA will require additional focused study.
Detection of novel splicing events
One key advantage of RNA-seq over microarrays is the ability to detect and quantify novel splicing events (Wang et al. 2009). For example, the modENCODE Consortium used RNA-seq to identify more than 23,000 hitherto unobserved splicing events in the Drosophila transcriptome (Graveley et al. 2011). Furthermore, the algorithm we use here for aligning reads to the genome/transcriptome, RUM, is particularly adept at mapping gapped reads to novel splice junctions (Grant et al. 2011). Accordingly, we manually curated the reads mapping to key clock genes involved in the generation of circadian rhythmicity to determine whether our data set reveals previously unannotated splice isoforms in the fly brain.
Both Clock and timeless contain alternative 5′ untranslated regions (UTRs) that were not previously annotated in either FlyBase or modENCODE gene models (Fig. 6). Depth of sequencing coverage was low at the 5′ ends of these genes in the modENCODE developmental transcriptome, suggesting that these splice isoforms are indeed novel identifications. In the case of Clock, there are two regions of significant sequencing depth in our RNA-seq data set within the first intron of the canonical gene models (Fig. 6A). Several hundred gapped reads also map to these regions and connect to the canonical exon 2 (Fig. 6A). In contrast, the canonical exon 1 (containing the presumed transcriptional start site, TSS) shows low depth of coverage and no gapped reads spanning intron 1 (Fig. 6A). The time-dependent transcriptional profiles of these regions further support the presence of previously unannotated TSSs. The canonical intron 1 (containing the postulated alternative 5′ UTRs) shows oscillatory behavior with a phase and amplitude in agreement with the coding exons of Clock (Fig. 6B), and the same region is arrhythmic and damped in per0 samples (data not shown). In contrast, the canonical exon 1 shows weak expression and low-amplitude oscillatory behavior (Fig. 6B). We validated these novel splicing events using rtPCR (Fig. 6C) and DNA sequencing of the resulting amplified products (data not shown). In every case, occurrence of these novel splicing events was verified and their oscillatory behavior confirmed (Fig. 6C).
Figure 6.

Novel transcriptional start sites in clock genes. The 5′ UTR and nearby coding exons are shown for Clock (A) and timeless (D). (Solid black bars) Exons; (thin blue lines) introns. (Red histograms) The depth of sequencing coverage at ZT0 and ZT12; (dark blue brackets, top) the number of gapped reads spanning previously annotated splice junctions; (green brackets) the number of gapped reads spanning novel splice junctions. (Arrows, bottom) PCR primers used to assay for the presence of a given splicing event, with blue indicating previously annotated and green indicating novel. (E) Exon primer; (I) intron primer. The expression levels of individual exons and introns are shown for Clock (B) and timeless (E). (C,F) rtPCR was used to detect the presence of splicing events using indicated primer pairs that span a given junction in brains of independent biological replicates collected at ZT0 and ZT12.
Similarly, we observe substantial read depth in the 5′ introns of timeless as well as gapped reads that link these regions to canonical, coding exons (Fig. 6D). The expression level of these putative, novel exons oscillates in phase with the rest of timeless's exons (Fig. 6E) and was arrhythmic in per0 samples (data not shown). These results were confirmed by rtPCR and DNA sequencing of the resulting amplified products (Fig. 6F; data not shown). Interestingly, rtPCR with primers spanning the canonical intron 1 and exon 3 shows an unexpected, smaller PCR product (Fig. 6F). We cloned and sequenced these bands and found that in a minority of cases, the canonical second exon of timeless is excluded from the mature transcript. Similar to the novel splicing events discussed above, this exon-skipping event only affects the 5′ UTR while leaving the coding sequence of timeless unchanged.
We also identified gapped reads that map to novel splicing events in the UTRs of Pdp1, cwo, CKIIa, and CKIIb (data not shown), indicating the presence of previously unanticipated complexity in the splicing of UTRs in circadian clock genes in the fly brain. Motivated by these observations, we next assessed splicing events across the entire genome spanned by gapped reads in our data set. We sorted the splicing events revealed by these reads into three categories: (1) canonical splice junctions annotated by modENCODE gene models; (2) novel splice junctions with canonical splice acceptor/donor sites; and (3) novel splice junctions lacking canonical splice acceptor/donor sites. The vast majority of gapped reads in our data set map to splice junctions previously annotated by the modENCODE Consortium (Fig. 7A). However, the majority of unique splicing events detected in our data set have not been previously built into any Drosophila gene model and are thus considered to be novel (Fig. 7A). This difference between total gapped reads and unique junctions is explained by the depth of RNA-seq coverage of canonical vs. novel splicing events (Fig. 7B). As expected, the most commonly identified splice junctions (and thus the most abundant in transcriptome data sets) have been identified by previous studies; the novel splice junctions we detect in our data are expressed at considerably lower levels on average (Fig. 7B). However, we detect >2000 novel splice junctions supported by at least 100 gapped reads, and at least 10,000 novel splice junctions supported by at least 10 gapped reads (Supplemental Table S12).
Figure 7.

Novel splicing events in the brain transcriptome. (A) The majority of gapped reads map to previously annotated splice junctions (left); however, the vast majority of unique splice junctions detected in the brain transcriptome have not been previously annotated (right). (Blue) Splice junctions previously detected by the modENCODE Consortium (Graveley et al. 2011). (Green) Novel splice junctions with (dark green) or without (light green) canonical 5′ and 3′ acceptor/donor splice sites. (B) The depth of coverage of unique splicing events is plotted as a histogram. Not surprisingly, the more abundant a splice junction, the more likely it has been previously annotated. (C) The molecular identity of novel splicing events within ion channel genes was manually curated, with relative abundance plotted as a pie chart.
To assess the biological relevance of these novel splicing events, we computationally identified every gene containing at least one novel splice junction with canonical acceptor/donor sites and supported by at least 10 gapped reads. As expected, given that the source of RNA for our experiments was from brain, we find significant enrichment in genes that are involved in neuronal function, including differentiation, synaptic transmission, ion transport, and circadian behavior (Supplemental Table S13). To survey the various species of novel splicing events occurring in Drosophila brain, we manually curated all of the novel splicing events (N = 371) in genes annotated as ion channels (Fig. 7C). Novel events were of a variety of types, including variants of canonical exons, novel exons, and novel exon skipping events. We identified 11 novel exon skipping events within fly ion channel genes, nine of which were independently validated by rtPCR and DNA sequencing of the resulting amplified products (data not shown), further supporting the conclusion that our RNA-seq data accurately reflect the complexity of RNA splicing in the fly brain.
Clock regulation of alternative splicing and RNA editing
Previous work in a variety of model systems has identified several examples of alternative splice isoforms that are differentially regulated by the circadian clock and has also demonstrated the importance of alternative splicing to circadian output (Collins et al. 2004; Majercak et al. 2004; Colot et al. 2005; Diernfellner et al. 2005, 2007; Schöning et al. 2007; Filichkin et al. 2010; Sanchez et al. 2010). To assess the degree to which circadian rhythms regulate alternative splicing at a genome-wide scale, we calculated the splicing index (alternative exon expression divided by average expression of constant exons) for every alternative exon in every sample within our data set. We applied two-way ANOVA to these splicing indices to identify exons regulated by time of day, genotype, or their interaction. In parallel, we also used JTK_Cycle and Fisher's G-test to identify oscillations of alternative splicing.
ANOVA reveals a large number of alternative exons whose splicing ratios are differentially regulated in per0 vs. wild-type brains (Table 4; Supplemental Table S14). In contrast, time of day has a much more limited effect on alternative exon regulation, particularly when considering the FDRs of these analyses (Table 4). Similarly, neither JTK_Cycle nor Fisher's G-test reveals large-scale rhythmicity in splicing indices at acceptably low FDRs (data not shown). Nevertheless, there are some clear examples in our RNA-seq data set of rhythmic alternative splicing. Figure 8 shows two examples of alternative exons regulated by either period loss-of-function or time of day. LOLA is a DNA binding protein that is widely expressed in the nervous system and plays a significant role in axon guidance, targeting, and cell death (Giniger et al. 1994; Goeke et al. 2003; Bass et al. 2007). We observe three alternative TSSs of lola expressed at detectable levels (Fig. 8A). Two of these alternative exons show significant differences in expression between wild-type and per0 (genotype P-values < 0.001), while the third alternative exon and the constant coding exons show no significant difference in expression. lola-RR exon 1 is down-regulated ∼30% in per0, while lola-RD exon 1 is more than twofold up-regulated in per0, indicating that period acts as a switch to regulate the preferred TSS of lola. PRL-1, a protein tyrosine phosphatase, has alternative TSSs that are differentially regulated by time (Fig. 8B). PRL-1's constant exons oscillate (exon 2 JTK_Cycle P-value = 0.007, exon 3 JTK_Cycle P-value = 0.12) with peak expression at ZT12. PRL-1-RB exon 1 oscillates with phase and amplitude consistent with these rhythms (JTK_Cycle P-value = 0.002). In contrast, PRL-1-RA exon 1 is expressed at a lower level and shows no evidence of circadian oscillation (JTK_Cycle P-value = 1.0). These data suggest that PRL-1-RB oscillates and is the predominant isoform of PRL-1, while PRL-1-RA is expressed at lower, time-invariant levels.
Table 4.
Number of statistically significant differentially regulated alternative exons by two-way ANOVA
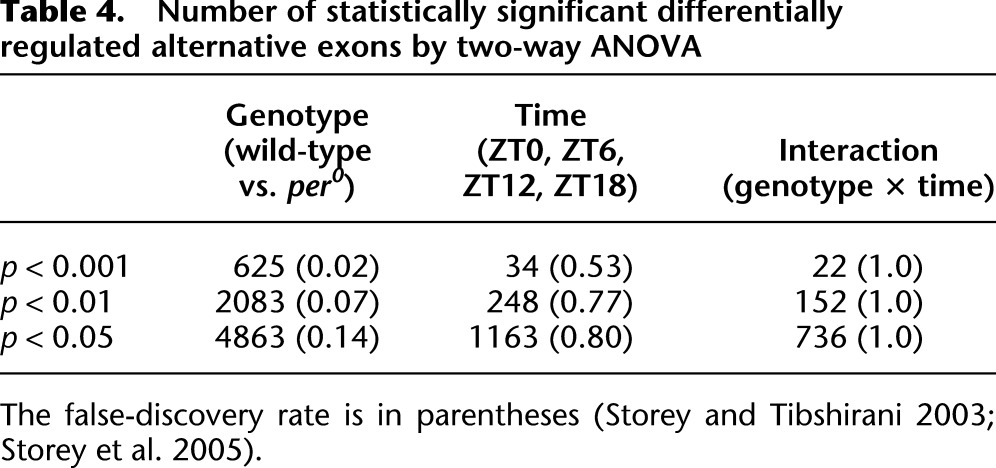
Figure 8.

Examples of alternative splice isoforms regulated by per loss-of-function and time-of-day. The 5′ UTR and nearby coding exons are shown for lola (A) and PRL-1 (B). (Solid black bars) Exons; (blue lines) introns. (Red histograms, top) The depth of sequencing coverage for wild-type and per0 samples (lola) or ZT0 and ZT12 (PRL-1). Bar graphs or line graphs show the expression levels of individual exons (bottom).
Relatively few alternative splice isoforms are regulated as a function of time of day. In contrast, at a P-value threshold <0.001, more than 600 alternative exons are differentially regulated by per0 at a FDR of 0.02. At the same P-value cutoff (and with a FDR of at least 0.53), only a few dozen alternative exons are differentially regulated by time or the interaction of time and genotype (Table 4). Examples like PRL-1 are the exception rather than the norm within our data set. We manually curated the top 100 differentially regulated alternative exons (by both time of day and genotype) to determine the types of splice isoforms being regulated. More than 75% of these exons are either alternative 5′ UTRs or coding exons downstream from alternative 5′ UTRs, indicating that differential regulation of isoform abundance by time and per0 is happening primarily at a transcriptional level, via alternate TSS selection. Some alternative isoforms generated by alternative splicing (e.g., exon skipping, cassette exons, alternative acceptor/donor sites) are found to be differentially expressed, but constitute a minority of the statistically significant hits (Supplemental Table S14).
Unlike alternative splice isoforms, there have been no reports to our knowledge providing evidence of circadian regulation of RNA editing. RNA editing is mediated by the adar enzyme, which catalyzes adenosine-to-inosine conversions in mRNA (Bass 2001). The modENCODE Consortium and others have identified 972 distinct RNA-editing sites in the Drosophila transcriptome (Stapleton et al. 2006; Graveley et al. 2011). Of these, 385 are found in our data set with a depth of coverage of at least five reads in each sample. To examine whether circadian rhythms regulate the frequency of RNA editing at a genome-wide scale, we calculated the editing ratio (G/(G+A)) for each of these known RNA-editing sites. Editing ratios were then analyzed with two-way ANOVA as well as Fisher's G-test and JTK_cycle (Fig. 9; Supplemental Table S15). Based on both the ANOVA and cycling statistics, we find no evidence to support regulation of RNA editing by time of day (Supplemental Table S15). In contrast, per0 has a substantial effect, with >10% of the editing sites showing significantly altered editing ratios (N = 40, ANOVA genotype, q < 0.05) (Supplemental Table S15). Two examples are shown in Figure 9. CG42613 is a protein-coding gene with no known molecular function. Its expression levels show only weak evidence of regulation by time of day or per0 (Fig. 9A), but one of its known RNA-editing sites (Chr3R: 14797034) (Supplemental Fig. S5) is edited four times more frequently in per0 (Fig. 9B). Conversely, the frequency of RNA editing in retinophilin is dramatically lower in per0 brains (Fig. 9C,D). We validated these RNA-seq results by directly cloning and sequencing transcripts from these and other genes (Supplemental Fig. S6). In every case tested, these results confirm our RNA-seq data. Moreover, we sequenced genomic DNA to verify that neither fly strain contained a genetic polymorphism responsible at these loci (Supplemental Fig. S6). Although RNA editing does not show any evidence of circadian oscillation, the dramatic change in editing ratio in per0 brains suggests a role for this key circadian gene in regulating the frequency of RNA editing at specific sites.
Figure 9.

Period alters RNA editing frequency in CG42613 and retinophilin. (A) Expression levels of CG43216-RC transcript are largely unchanged by period (B). The frequency of RNA editing in per0 is fivefold greater vs. wild-type (ANOVA, p < 5.5 × 10⁻¹¹, ANOVA, q < 5.0 × 10⁻⁹). Similar to CG42613, expression levels of retinophilin-RA transcript are not dramatically changed by period (C). The frequency of RNA editing at Chr3R:1062097 is dramatically decreased in per0 brains (ANOVA, p < 8.0 × 10⁻¹¹; ANOVA, q < 1.1 × 10⁻¹⁰) (D). (Error bars) Mean ± standard error of the mean.
Discussion
In this study, we present analysis of the circadian transcriptome of the fly brain based on >1.2 billion short nucleotide reads and 140 Gb of aligned sequence. This analysis reveals extensive circadian regulation of ncRNAs and identifies several previously unannotated splice isoforms in key circadian genes. To our knowledge, this is the first comprehensive analysis of circadian regulation of alternative splicing events and RNA editing. Perhaps most interestingly, per0 was found to either increase or decrease the frequency of RNA editing in a wide array of transcripts without an obvious effect on the expression or activity of ADAR.
This study demonstrates the power of RNA-seq as an analytical tool for studying circadian transcriptional output. While the statistical analysis of rhythmicity in our study is modestly underpowered because of the somewhat sparse temporal sampling resolution, we find considerable agreement between the results presented here and legacy microarray data sets (Supplemental Tables S5, S10). Our results highlight the limitations of microarray approaches and the advantages of RNA-seq. Points of agreement include (1) robust oscillations of key circadian timekeeping genes (Fig. 1); (2) similar numbers of cycling transcripts (Table 3); (3) similar identities of circadian- and per-regulated genes (Supplemental Tables S5, S10); (4) similar distribution of amplitudes and phases of clock output genes (Fig. 3); and (5) the expected loss of the vast majority of transcriptional rhythms in per0 samples (Fig. 3A,B). Beyond these points of agreement, however, by applying circadian analyses to RNA-seq data based on the modENCODE gene models, we detect numerous, novel cycling genes that have not been previously assayed by microarray-based studies (because the microarrays lacked appropriate probesets). For example, ∼10% of the cycling genes detected in our data set are ncRNAs (Fig. 3E). Although technical constraints limited our ability to assess the previously established reciprocal regulation between the circadian clock and miRNAs (Cheng et al. 2007; Yang et al. 2008; Kadener et al. 2009), our findings suggest that the circadian timekeeping system may be regulating (and being regulated by) a substantial number of heretofore unstudied ncRNAs, such as snoRNAs and lncRNAs.
Among these ncRNAs, seven of eight Uhg-family members oscillate in the fly brain with peak expression occurring during the light phase of LD and appear to be driven by light (Fig. 5; Supplemental Table S9). Uhgs are ncRNAs whose excised introns are ultimately processed into snoRNAs, key regulators of ribosomal biogenesis. snoRNAs fall into two functional classes: box C/D, which mediate site-specific 2′-O-ribose methylation; and box H/ACA, which guide pseudouridylation of rRNAs (Smith and Steitz 1997; Huang et al. 2005). Previous studies have demonstrated that the vast majority (51 of 53) of snoRNAs encoded by Uhgs in Drosophila are C/D box (Huang et al. 2005). This leads to the hypothesis that the time of day regulates rRNA methylation and, thus, the translational machinery via oscillations of snoRNA abundance. This possibility dovetails with previous studies showing a link between circadian oscillations and translational regulation (Lim et al. 2011). We acknowledge that our evidence for circadian regulation of snoRNAs themselves is indirect being based on oscillation of their host genes. Definitive evidence to verify oscillation of snoRNA abundance, determine their mechanism of activity, and test their effect on rRNA methylation will require biochemical experiments beyond the scope of this study. However, daily oscillation of snoRNA host genes supports this hypothesis, which is the subject of ongoing work in our laboratory.
We also note that snoRNAs have been shown to methylate mRNA as well as rRNA (Kishore et al. 2010). Given the widely accepted role for C/D-box snoRNAs in regulating the assembly of ribosomes, we favor the hypothesis that cycling snoRNAs regulate the translational machinery. Nevertheless, we found that Uhg-encoded snoRNAs have complementary sequences in their D-box to more than 100 expressed mRNA transcripts (Supplemental Table S16), including the known circadian gene takeout (to). We speculate that snoRNA-mediated methylation of mRNA may provide an alternative regulation point for circadian transcriptional output.
In addition to identifying cycling transcripts that are not detectable by conventional microarrays, RNA-seq also detects novel splicing events. We exploited this to identify novel splice isoforms of key circadian clock genes, including Clock, timeless, cwo, Pdp1, CKIIa, and CKIIb (Fig. 6). The presence of circadian-regulated, alternative 5′ UTRs within these genes suggests a previously unanticipated level of complexity in their regulation. Although the functional significance of these novel 5′ UTRs is unknown, we speculate that they may participate in the regulation of clock gene expression levels in different cell types and environmental conditions.
Expanding this analysis to the entire genome, we have detected thousands of novel splicing events that are not incorporated in either FlyBase or modENCODE gene models (Fig. 7; Supplemental Table S12). Four factors likely explain why we have detected numerous novel splicing events. First, the alignment of raw RNA-seq reads was made to the published gene models from modENCODE. Any detected splicing event not supported by these gene models was thus deemed to be novel. However, modENCODE identified many thousands of splicing events that have not yet been incorporated into gene models (Graveley et al. 2011). At a minimum, our data will provide independent confirmation of such splicing events and thus contribute to the continued improvement of Drosophila gene models. Second, although the size of our data set is not of the same magnitude as modENCODE, 140 Gb of aligned sequence from our study is considerable, particularly since it is focused solely on the adult brain. The fact that most novel splicing events detected in our fly brain transcriptome have relatively low depth of coverage suggests that these novel splice junctions may be rare events below the detection limit in other data sets (Fig. 7B). Third, the RNA amplification method we used enriched our data set for mRNA without necessitating a poly(A)-based selection step. Consequently, the 3′ bias typically seen in RNA-seq data sets is less pronounced, resulting in greater depth of coverage at the 5′ end of transcripts. Consistent with this, the novel splicing events detected in our data set are biased toward the 5′ transcript ends (Fig. 7C). Fourth, the alignment algorithm we used, RUM, is especially advantageous for detecting novel splice junctions (Grant et al. 2011). It will be of interest in future studies to determine whether realigning the modENCODE reads with RUM can confirm the presence of novel splicing events detected in our data. Taken as a whole, and independently of our circadian analyses and conclusions, our brain transcriptome is an important advance relative to the modENCODE fly developmental transcriptome, particularly with respect to the identification of novel splicing events.
Alternative splicing and RNA editing are two methods by which cells increase the diversity of mRNA and protein encoded by the genome. Given the broad influence the circadian clock has over transcription, assessing whether the clock also regulates mRNA post-transcriptionally is of great importance to our understanding of circadian output mechanisms (e.g., Sanchez et al. 2010). Our data indicate that period loss of function exerts a substantial effect on both alternative splice isoform abundance and the frequency of RNA editing (Figs. 8, 9). Especially interesting is our observation that per0 increases the frequency of RNA editing at some sites while decreasing editing at other sites (Fig. 9; Supplemental Table S15). This suggests that RNA editing does not occur at a constant level across the brain transcriptome, but is instead regulated on a site-by-site basis. Unlike period loss of function, time of day did not show any significant effect on RNA editing frequencies and only exerted a modest effect on the abundance of alternative exons. The majority of differential isoform regulation by both period and the circadian clock occurred in alternative 5′ UTRs, suggesting that most of these effects are mediated by selection of alternative TSSs rather than via alternative splicing. As mentioned above, the temporal sampling density of this study has led to modestly underpowered statistical tests. Thus, there may be additional alternative exons regulated by the clock that we did not detect. Moreover, previous reports (Collins et al. 2004; Majercak et al. 2004; Colot et al. 2005; Diernfellner et al. 2005, 2007; Schöning et al. 2007; Filichkin et al. 2010; Sanchez et al. 2010) along with examples such as PRL-1 (Fig. 8B) indicate that the circadian clock does regulate alternative isoform abundance and can be highly significant to proper clock output. However, using identical statistical thresholds, we detected considerably more alternative splice isoforms differentially regulated by per than time of day, suggesting that circadian regulation of alternative splicing is a limited and infrequent occurrence in the fly brain.
Methods
Fly stocks and behavioral monitoring
Wild-type Canton-S flies, y w, per0, and per0 in a Canton-S background were raised on standard food at 25°C. per0 Canton-S flies are direct descendants of the original pero mutant generated by EMS mutagenesis of Canton-S flies (Konopka and Benzer 1971). yw, per0 flies were generated by recombination with the per0 allele. Individual 3- to 5-d-old male flies were placed in locomotor activity monitor tubes and were entrained to 12 h:12 h light:dark (LD) conditions for 5 d before being released into free-running conditions of constant darkness. Automated TriKinetics infrared beam-crossing monitor systems were used to assay locomotor activity. Twenty-minute bin-size double-plotted actograms and Lomb-Scargle periodograms for assay of free-running period were generated using Actimetrics Clocklab software, running on MATLAB (Mathworks). Averaged activity histograms in Light/Dark were generated by averaging the binned activity profiles for 3 d in LD, then averaging across animals.
Tissue collection
Three to five days after eclosion, brains from 10–12 female flies per sample were manually dissected in PBS at the time points indicated in Figure 1A, transferred into 100 μL of extraction buffer (Molecular Devices), vortexed for 30 sec, and incubated at 42°C to homogenize the tissue. Total RNA was purified with the PicoPure RNA Purification kit (Molecular Devices) using the manufacturer's protocol and quantified using a NanoDrop spectrophotometer (ThermoFisher). mRNA was amplified (and rRNA depleted) using either the poly(A)-based RiboAmp RNA Amplification kit (Molecular Devices) or the non-poly(A)-based Ovation RNA-seq Amplification kit (NuGEN Technologies).
Library preparation
Five micrograms of amplified RNA was randomly fragmented by heating to 94°C; fragments were concentrated by ethanol precipitation. First-strand cDNA was synthesized by reverse transcriptase, and the RNA strand from the resulting cDNA/RNA duplex was degraded by RNase H. Second-strand cDNA was synthesized by DNA polymerase I, and the double-stranded cDNA fragments were end-repaired with a combination of T4 DNA Polymerase, Klenow Fragment Polymerase, and poly nucleotide kinase to ensure blunted ends, and then adenylated with a single A-base at the 3′ end of the fragment by the Klenow 3′–5′ exo− enzyme. This A-tail allowed ligation of the proprietary Illumina adapters, facilitated by T4 DNA Ligase. The adaptor-ligated sample was size-selected by electrophoresis and selectively enriched by PCR using primers that only anneal to adaptor-ligated fragments. The adaptor sequences were annealed to the primers on the Illumina flow cell lanes during bridge PCR, which generated the clusters necessary to view fluorescence during the sequencing-by-synthesis process.
RNA sequencing
For LD experiments, one sample was loaded per lane on an Illumina GAIIx sequencer for a total of 24 lanes (Table 1; Supplemental Table S1). For the DD experiment, cDNA libraries were molecularly bar-coded using Illumina primers and loaded onto two lanes of an Illumina HiSeq. cDNA libraries were diluted to 10 nM, and 12–15 pmol of material was loaded onto each lane. Template hybridization, extension of the template, amplification of the template, cluster generation, sequencing primer addition, and paired-end “turn-around” chemistry were performed using C-BOT (formerly known as Cluster Station). Base calls were made using CASAVA (Illumina).
Alignment
The RNA-seq Unified Mapper (RUM) was used to align sequenced reads to the genome and transcriptome of Drosophila melanogaster (Grant et al. 2011). The Berkeley Drosophila Genome Project (BDGP) Release 5 (April 2006) genome assembly was used as the template genome (Celniker et al. 2002), and the newly released modENCODE gene annotations were used as the template transcriptome (Graveley et al. 2011). RUM was implemented using Amazon Elastic Cloud Computing (EC2) web services with 64-bit Linux AMI, 8 core, 64 GB memory machines. RUM was run using the following parameters: “-limitBowtieNU -limitNU 25.” Raw data as well as the results of alignments are freely available on GEO (accession numbers: GSE29972 and GSE36108).
Analysis
RPKMs were calculated for transcripts, exons, and introns by RUM using scripts written in Perl. Histograms showing the depth of sequencing coverage were generated using UCSC's Genome Browser. Detection of cycling was performed using JTK_Cycle (Hughes et al. 2010) and Fisher's G-test (Wichert et al. 2004) and implemented in R (64-bit, version 2.12.1). Two-way ANOVA and false discovery rate (FDR) calculations (Storey and Tibshirani 2003; Storey et al. 2005) were made using custom scripts and implemented in R. Amplitude estimates and comparisons were performed as previously described (Miyazaki et al. 2011). Heatmaps were generated using scripts for MATLAB (version R2010b; Mathworks). Splicing indexes and RNA editing indexes were calculated using custom scripts written in Ruby. DAVID analyses were performed as previously described (Huang et al. 2008). All code and analyses are available on demand.
Quantitative and reverse transcriptase PCR
One microgram of total RNA was used to generate cDNA with the HighCapacity cDNA Archive Kit using the manufacturer's protocol (Applied Biosystems). Quantitative PCR reactions were performed on independent biological replicates using iTaq PCR mastermix (Bio-Rad) in combination with gene expression assays (Applied Biosystems) on a 7900HT Taqman machine (Applied Biosystems). The Taqman probes used include Rpl32, Dm02151827_g1 (endogenous control); Period, Dm01843684_g1; Clock, Dm01795382_g1. Semiquantitative reverse transcriptase PCR (Fig. 6; Supplemental Fig. S3) was performed with 1–35 ng of cDNA template using the Advantage PCR kit (Clontech). Validation of novel slice sites (e.g., Fig. 6) was performed on independent biological replicates; validation of Uhg cycling (Supplemental Fig. S3) was done using Nugen Ovation-amplified templates. The primers used include ClkE, GGCAAAAGGCATTACAACAGA; ClkI1, GAGCGCGCAGTTATTGTTTT; ClkI2, GTACTTGGCCGATCTGAAGC; ClkI3, TCTGTGTGCGCCAGTCTATC; ClkE2, CAAAATGTGGCATATTGAGCA; ClkE3, TCAGGACCGTGGACTTATCC; TimI1, TGTGAAACGTCTGTGAGGAA; TimI2, TTGCATTTTACATAAGCCAACAA; TimE2, TGCAAAGAAACCCAAAAAGTG; TimE3, ATTCGGGTTGACCACATAGG; EIF4G-F, TCCATCAAACGTCGCTAAAA; EIF4G-R, TGTTTCCGTCAATCCTCTGA; UHG1-F, TGTTGACTGACAGCCGATTT; UHG1-R, TTGCAGGGTAGATAGACTTTTTCC; UHG2-F, ATTTGCCTGCGATAAACCAC; UHG2-R, TTGAAACCCTAAGCATTTGGA; UHG3-F, GCGGATCACGAGAAACGAG; UHG3-R, AGAAACATCAGTTTTTCTGCATT; UHG4-F, TCGGTCTTTCGATTTGGATT; UHG4-R, AGAGATCCTTGTTTGGGCATA; UHG5-F, CATCCATCAGATACATGGAAAA; UHG5-R, GACCGTAAGAGTCCCTCGAT; UHG6-F, GGCGGAACGAAAACTAAAAA; UHG6-R, TTCCTGTGGCATTCAATGAT; UHG7-F, AATCCATTAATCGGGCCACT; UHG7-R, TCAATCTGGCTCGTATCTGG; UHG8-F, GGGAGCCTGGGATACAATCT; UHG8-R, AGGTTTTTCCAACCGAATCA.
Data access
All raw data have been submitted to the NCBI Gene Expression Omnibus (GEO) (http://www.ncbi.nlm.nih.gov/geo/) under accession numbers GSE29972 and GSE36108, and are freely available.
Acknowledgments
We thank John Overton, Alex Lopez, Milind Mahajan, and Shrikant Mane from Yale University's Keck Sequencing Core for library preparation and Illumina sequencing. per0 flies were provided by Joel Levine (University of Toronto). We also thank Anthony Olarerin-George, Nick Lahens, Angel Pizarro, and John Hogenesch (University of Pennsylvania), Charles Choi (Yale School of Medicine), Susan Baserga (Yale School of Medicine), Laura Hughes (Stanford University), and Joao Dias (Harvard University) for technical advice, and members of the Nitabach laboratory for helpful discussions. M.E.H. is supported by the National Institute of General Medical Sciences (NIGMS), National Institutes of Health (NIH) grant F32GM096577. Research in the laboratory of M.N.N. is funded in part by the National Institute of Neurological Disorders and Stroke, NIH grants R21NS058330, R01NS055035, and R01NS056443, and by NIGMS, NIH grant R01GM098931.
Footnotes
[Supplemental material is available for this article.]
Article published online before print. Article, supplemental material, and publication date are at http://www.genome.org/cgi/doi/10.1101/gr.128876.111.
References
- Allada R, Chung BY 2010. Circadian organization of behavior and physiology in Drosophila. Annu Rev Physiol 72: 605–624 [DOI] [PMC free article] [PubMed] [Google Scholar]
- Bass BL. 2001. RNA editing. Oxford University Press, New York. [Google Scholar]
- Bass BP, Cullen K, McCall K 2007. The axon guidance gene lola is required for programmed cell death in the Drosophila ovary. Dev Biol 304: 771–785 [DOI] [PMC free article] [PubMed] [Google Scholar]
- Celniker SE, Wheeler DA, Kronmiller B, Carlson JW, Halpern A, Patel S, Adams M, Champe M, Dugan SP, Frise E, et al. 2002. Finishing a whole-genome shotgun: Release 3 of the Drosophila melanogaster euchromatic genome sequence. Genome Biol 3: research0079–0079.14 [DOI] [PMC free article] [PubMed] [Google Scholar]
- Ceriani MF, Hogenesch JB, Yanovsky M, Panda S, Straume M, Kay SA 2002. Genome-wide expression analysis in Drosophila reveals genes controlling circadian behavior. J Neurosci 22: 9305–9319 [DOI] [PMC free article] [PubMed] [Google Scholar]
- Cheng H-YM, Papp JW, Varlamova O, Dziema H, Russell B, Curfman JP, Nakazawa T, Shimizu K, Okamura H, Impey S, et al. 2007. microRNA modulation of circadian-clock period and entrainment. Neuron 54: 813–829 [DOI] [PMC free article] [PubMed] [Google Scholar]
- Claridge-Chang A, Wijnen H, Naef F, Boothroyd C, Rajewsky N, Young MW 2001. Circadian regulation of gene expression systems in the Drosophila head. Neuron 32: 657–671 [DOI] [PubMed] [Google Scholar]
- Collins BH, Rosato E, Kyriacou CP 2004. Seasonal behavior in Drosophila melanogaster requires the photoreceptors, the circadian clock, and phospholipase C. Proc Natl Acad Sci 101: 1945–1950 [DOI] [PMC free article] [PubMed] [Google Scholar]
- Colot HV, Loros JJ, Dunlap JC 2005. Temperature-modulated alternative splicing and promoter use in the Circadian clock gene frequency. Mol Biol Cell 16: 5563–5571 [DOI] [PMC free article] [PubMed] [Google Scholar]
- Daines B, Wang H, Wang L, Li Y, Han Y, Emmert D, Gelbart W, Wang X, Li W, Gibbs R, et al. 2011. The Drosophila melanogaster transcriptome by paired-end RNA sequencing. Genome Res 21: 315–324 [DOI] [PMC free article] [PubMed] [Google Scholar]
- Didelot G, Molinari F, Tchénio P, Comas D, Milhiet E, Munnich A, Colleaux L, Preat T 2006. Tequila, a neurotrypsin ortholog, regulates long-term memory formation in Drosophila. Science 313: 851–853 [DOI] [PubMed] [Google Scholar]
- Diernfellner ACR, Schafmeier T, Merrow MW, Brunner M 2005. Molecular mechanism of temperature sensing by the circadian clock of Neurospora crassa. Genes Dev 19: 1968–1973 [DOI] [PMC free article] [PubMed] [Google Scholar]
- Diernfellner A, Colot HV, Dintsis O, Loros JJ, Dunlap JC, Brunner M 2007. Long and short isoforms of Neurospora clock protein FRQ support temperature-compensated circadian rhythms. FEBS Lett 581: 5759–5764 [DOI] [PMC free article] [PubMed] [Google Scholar]
- Doherty CJ, Kay SA 2010. Circadian control of global gene expression patterns. Annu Rev Genet 44: 419–444 [DOI] [PMC free article] [PubMed] [Google Scholar]
- Duffield GE 2003. DNA microarray analyses of circadian timing: The genomic basis of biological time. J Neuroendocrinol 15: 991–1002 [DOI] [PubMed] [Google Scholar]
- Dunkov BC, Rodriguez-Arnaiz R, Pittendrigh B, ffrench-Constant RH, Feyereisen R 1996. Cytochrome P450 gene cluster in Drosophila melanogaster. Mol Gen Genet 251: 290–297 [DOI] [PubMed] [Google Scholar]
- Etter PD, Ramaswami M 2002. The ups and downs of daily life: Profiling circadian gene expression in Drosophila. Bioessays 24: 494–498 [DOI] [PubMed] [Google Scholar]
- Filichkin SA, Priest HD, Givan SA, Shen R, Bryant DW, Fox SE, Wong W-K, Mockler TC 2010. Genome-wide mapping of alternative splicing in Arabidopsis thaliana. Genome Res 20: 45–58 [DOI] [PMC free article] [PubMed] [Google Scholar]
- Giniger E, Tietje K, Jan LY, Jan YN 1994. lola encodes a putative transcription factor required for axon growth and guidance in Drosophila. Development 120: 1385–1398 [DOI] [PubMed] [Google Scholar]
- Goeke S, Greene EA, Grant PK, Gates MA, Crowner D, Aigaki T, Giniger E 2003. Alternative splicing of lola generates 19 transcription factors controlling axon guidance in Drosophila. Nat Neurosci 6: 917–924 [DOI] [PubMed] [Google Scholar]
- Grant GR, Farkas MH, Pizarro AD, Lahens NF, Schug J, Brunk BP, Stoeckert CJ, Hogenesch JB, Pierce EA 2011. Comparative analysis of RNA-Seq alignment algorithms and the RNA-Seq unified mapper (RUM). Bioinformatics 27: 2518–2528 [DOI] [PMC free article] [PubMed] [Google Scholar]
- Graveley BR, Brooks AN, Carlson JW, Duff MO, Landolin JM, Yang L, Artieri CG, van Baren MJ, Boley N, Booth BW, et al. 2011. The developmental transcriptome of Drosophila melanogaster. Nature 471: 473–479 [DOI] [PMC free article] [PubMed] [Google Scholar]
- Hardin PE 2006. Essential and expendable features of the circadian timekeeping mechanism. Curr Opin Neurobiol 16: 686–692 [DOI] [PubMed] [Google Scholar]
- Hastings MH, Reddy AB, Maywood ES 2003. A clockwork web: Circadian timing in brain and periphery, in health and disease. Nat Rev Neurosci 4: 649–661 [DOI] [PubMed] [Google Scholar]
- Huang Z-P, Zhou H, He H-L, Chen C-L, Liang D, Qu L-H 2005. Genome-wide analyses of two families of snoRNA genes from Drosophila melanogaster, demonstrating the extensive utilization of introns for coding of snoRNAs. RNA 11: 1303–1316 [DOI] [PMC free article] [PubMed] [Google Scholar]
- Huang DW, Sherman BT, Lempicki RA 2008. Systematic and integrative analysis of large gene lists using DAVID bioinformatics resources. Nat Protoc 4: 44–57 [DOI] [PubMed] [Google Scholar]
- Hughes M, Deharo L, Pulivarthy SR, Gu J, Hayes K, Panda S, Hogenesch JB 2007. High-resolution time course analysis of gene expression from pituitary. Cold Spring Harb Symp Quant Biol 72: 381–386 [DOI] [PMC free article] [PubMed] [Google Scholar]
- Hughes ME, DiTacchio L, Hayes KR, Vollmers C, Pulivarthy S, Baggs JE, Panda S, Hogenesch JB 2009. Harmonics of circadian gene transcription in mammals. PLoS Genet 5: e1000442 doi: 10.1371/journal.pgen.1000442 [DOI] [PMC free article] [PubMed] [Google Scholar]
- Hughes ME, Hogenesch JB, Kornacker K 2010. JTK_CYCLE: An efficient nonparametric algorithm for detecting rhythmic components in genome-scale data sets. J Biol Rhythms 25: 372–380 [DOI] [PMC free article] [PubMed] [Google Scholar]
- Jackson FR, Schroeder AJ 2001. A timely expression profile. Dev Cell 1: 730–731 [DOI] [PubMed] [Google Scholar]
- Kadener S, Menet JS, Sugino K, Horwich MD, Weissbein U, Nawathean P, Vagin VV, Zamore PD, Nelson SB, Rosbash M 2009. A role for microRNAs in the Drosophila circadian clock. Genes Dev 23: 2179–2191 [DOI] [PMC free article] [PubMed] [Google Scholar]
- Keegan KP, Pradhan S, Wang J-P, Allada R 2007. Meta-analysis of Drosophila circadian microarray studies identifies a novel set of rhythmically expressed genes. PLoS Comput Biol 3: e208 doi: 10.1371/journal.pcbi.0030208 [DOI] [PMC free article] [PubMed] [Google Scholar]
- Kishore S, Khanna A, Zhang Z, Hui J, Balwierz PJ, Stefan M, Beach C, Nicholls RD, Zavolan M, Stamm S 2010. The snoRNA MBII-52 (SNORD 115) is processed into smaller RNAs and regulates alternative splicing. Hum Mol Genet 19: 1153–1164 [DOI] [PMC free article] [PubMed] [Google Scholar]
- Kiss T 2002. Small nucleolar RNAs: An abundant group of noncoding RNAs with diverse cellular functions. Cell 109: 145–148 [DOI] [PubMed] [Google Scholar]
- Ko CH, Takahashi JS 2006. Molecular components of the mammalian circadian clock. Hum Mol Genet 15: R271–R277 [DOI] [PubMed] [Google Scholar]
- Konopka RJ, Benzer S 1971. Clock mutants of Drosophila melanogaster. Proc Natl Acad Sci 68: 2112–2116 [DOI] [PMC free article] [PubMed] [Google Scholar]
- Kornmann B, Schaad O, Bujard H, Takahashi JS, Schibler U 2007. System-driven and oscillator-dependent circadian transcription in mice with a conditionally active liver clock. PLoS Biol 5: e34 doi: 10.1371/journal.pbio.0050034 [DOI] [PMC free article] [PubMed] [Google Scholar]
- Kula-Eversole E, Nagoshi E, Shang Y, Rodriguez J, Allada R, Rosbash M 2010. Surprising gene expression patterns within and between PDF-containing circadian neurons in Drosophila. Proc Natl Acad Sci 107: 13497–13502 [DOI] [PMC free article] [PubMed] [Google Scholar]
- Levine JD, Funes P, Dowse HB, Hall JC 2002. Signal analysis of behavioral and molecular cycles. BMC Neurosci 3: 1 doi: 10.1186/1471-2202-3-1 [DOI] [PMC free article] [PubMed] [Google Scholar]
- Lim C, Lee J, Choi C, Kilman VL, Kim J, Park SM, Jang SK, Allada R, Choe J 2011. The novel gene twenty-four defines a critical translational step in the Drosophila clock. Nature 470: 399–403 [DOI] [PMC free article] [PubMed] [Google Scholar]
- Lin Y, Han M, Shimada B, Wang L, Gibler TM, Amarakone A, Awad TA, Stormo GD, Van Gelder RN, Taghert PH 2002. Influence of the period-dependent circadian clock on diurnal, circadian, and aperiodic gene expression in Drosophila melanogaster. Proc Natl Acad Sci 99: 9562–9567 [DOI] [PMC free article] [PubMed] [Google Scholar]
- Majercak J, Chen W-F, Edery I 2004. Splicing of the period gene 3′-terminal intron is regulated by light, circadian clock factors, and phospholipase C. Mol Cell Biol 24: 3359–3372 [DOI] [PMC free article] [PubMed] [Google Scholar]
- Marguerat S, Bähler J 2010. RNA-seq: From technology to biology. Cell Mol Life Sci 67: 569–579 [DOI] [PMC free article] [PubMed] [Google Scholar]
- McDonald MJ, Rosbash M 2001. Microarray analysis and organization of circadian gene expression in Drosophila. Cell 107: 567–578 [DOI] [PubMed] [Google Scholar]
- Michael TP, Mockler TC, Breton G, McEntee C, Byer A, Trout JD, Hazen SP, Shen R, Priest HD, Sullivan CM, et al. 2008. Network discovery pipeline elucidates conserved time-of-day-specific cis-regulatory modules. PLoS Genet 4: e14 doi: 10.1371/journal.pgen.0040014 [DOI] [PMC free article] [PubMed] [Google Scholar]
- Miyazaki M, Schroder E, Edelmann SE, Hughes ME, Kornacker K, Balke CW, Esser KA 2011. Age-associated disruption of molecular clock expression in skeletal muscle of the spontaneously hypertensive rat. PLoS ONE 6: e27168 doi: 10.1371/journal.pone.0027168 [DOI] [PMC free article] [PubMed] [Google Scholar]
- Nagoshi E, Sugino K, Kula E, Okazaki E, Tachibana T, Nelson S, Rosbash M 2010. Dissecting differential gene expression within the circadian neuronal circuit of Drosophila. Nat Neurosci 13: 60–68 [DOI] [PMC free article] [PubMed] [Google Scholar]
- Nitabach MN, Taghert PH 2008. Organization of the Drosophila circadian control circuit. Curr Biol 18: R84–R93 [DOI] [PubMed] [Google Scholar]
- Nitabach MN, Wu Y, Sheeba V, Lemon WC, Strumbos J, Zelensky PK, White BH, Holmes TC 2006. Electrical hyperexcitation of lateral ventral pacemaker neurons desynchronizes downstream circadian oscillators in the fly circadian circuit and induces multiple behavioral periods. J Neurosci 26: 479–489 [DOI] [PMC free article] [PubMed] [Google Scholar]
- Ozsolak F, Milos PM 2011. RNA sequencing: Advances, challenges and opportunities. Nat Rev Genet 12: 87–98 [DOI] [PMC free article] [PubMed] [Google Scholar]
- Panda S, Antoch MP, Miller BH, Su AI, Schook AB, Straume M, Schultz PG, Kay SA, Takahashi JS, Hogenesch JB 2002. Coordinated transcription of key pathways in the mouse by the circadian clock. Cell 109: 307–320 [DOI] [PubMed] [Google Scholar]
- Sanchez SE, Petrillo E, Beckwith EJ, Zhang X, Rugnone ML, Hernando CE, Cuevas JC, Godoy Herz MA, Depetris-Chauvin A, Simpson CG, et al. 2010. A methyl transferase links the circadian clock to the regulation of alternative splicing. Nature 468: 112–116 [DOI] [PubMed] [Google Scholar]
- Schöning JC, Streitner C, Page DR, Hennig S, Uchida K, Wolf E, Furuya M, Staiger D 2007. Auto-regulation of the circadian slave oscillator component AtGRP7 and regulation of its targets is impaired by a single RNA recognition motif point mutation. Plant J 52: 1119–1130 [DOI] [PubMed] [Google Scholar]
- Smith CM, Steitz JA 1997. Sno storm in the nucleolus: New roles for myriad small RNPs. Cell 89: 669–672 [DOI] [PubMed] [Google Scholar]
- Stapleton M, Carlson JW, Celniker SE 2006. RNA editing in Drosophila melanogaster: New targets and functional consequences. RNA 12: 1922–1932 [DOI] [PMC free article] [PubMed] [Google Scholar]
- Storey JD, Tibshirani R 2003. Statistical significance for genomewide studies. Proc Natl Acad Sci 100: 9440–9445 [DOI] [PMC free article] [PubMed] [Google Scholar]
- Storey JD, Xiao W, Leek JT, Tompkins RG, Davis RW 2005. Significance analysis of time course microarray experiments. Proc Natl Acad Sci 102: 12837–12842 [DOI] [PMC free article] [PubMed] [Google Scholar]
- Tycowski KT, Steitz JA 2001. Non-coding snoRNA host genes in Drosophila: Expression strategies for modification guide snoRNAs. Eur J Cell Biol 80: 119–125 [DOI] [PubMed] [Google Scholar]
- Ueda HR, Matsumoto A, Kawamura M, Iino M, Tanimura T, Hashimoto S 2002. Genome-wide transcriptional orchestration of circadian rhythms in Drosophila. J Biol Chem 277: 14048–14052 [DOI] [PubMed] [Google Scholar]
- Walker JR, Hogenesch JB 2005. RNA profiling in circadian biology. Methods Enzymol 393: 366–376 [DOI] [PubMed] [Google Scholar]
- Wang Z, Gerstein M, Snyder M 2009. RNA-Seq: A revolutionary tool for transcriptomics. Nat Rev Genet 10: 57–63 [DOI] [PMC free article] [PubMed] [Google Scholar]
- Wichert S, Fokianos K, Strimmer K 2004. Identifying periodically expressed transcripts in microarray time series data. Bioinformatics 20: 5–20 [DOI] [PubMed] [Google Scholar]
- Wijnen H, Naef F, Young MW 2005. Molecular and statistical tools for circadian transcript profiling. Methods Enzymol 393: 341–365 [DOI] [PubMed] [Google Scholar]
- Wijnen H, Naef F, Boothroyd C, Claridge-Chang A, Young MW 2006. Control of daily transcript oscillations in Drosophila by light and the circadian clock. PLoS Genet 2: e39 doi: 10.1371/journal.pgen.0020039 [DOI] [PMC free article] [PubMed] [Google Scholar]
- Xu K, Diangelo JR, Hughes ME, Hogenesch JB, Sehgal A 2011. The circadian clock interacts with metabolic physiology to influence reproductive fitness. Cell Metab 13: 639–654 [DOI] [PMC free article] [PubMed] [Google Scholar]
- Yang M, Lee J-E, Padgett RW, Edery I 2008. Circadian regulation of a limited set of conserved microRNAs in Drosophila. BMC Genomics 9: 83 doi: 10.1186/1471-2164-9-83 [DOI] [PMC free article] [PubMed] [Google Scholar]
- Yu W, Hardin PE 2006. Circadian oscillators of Drosophila and mammals. J Cell Sci 119: 4793–4795 [DOI] [PubMed] [Google Scholar]