

Abstract
How cells adopt different expression patterns is a fundamental question of developmental biology. We quantitatively measured reporter expression of 127 genes, primarily transcription factors, in every cell and with high temporal resolution in C. elegans embryos. Embryonic cells are highly distinct in their gene expression; expression of the 127 genes studied here can distinguish nearly all pairs of cells, even between cells of the same tissue type. We observed recurrent lineage-regulated expression patterns for many genes in diverse contexts. These patterns are regulated in part by the TCF-LEF transcription factor POP-1. Other genes' reporters exhibited patterns correlated with tissue, position, and left–right asymmetry. Sequential patterns both within tissues and series of sublineages suggest regulatory pathways. Expression patterns often differ between embryonic and larval stages for the same genes, emphasizing the importance of profiling expression in different stages. This work greatly expands the number of genes in each of these categories and provides the first large-scale, digitally based, cellular resolution compendium of gene expression dynamics in live animals. The resulting data sets will be a useful resource for future research.
While the availability of genome sequences has revolutionized biomedical research, our understanding of how genomes encode regulatory mechanisms is still limited. Much of expression regulation in animals occurs in the context of development. To generate a global understanding of how the genome controls the development of the diverse cell types will require determining at cellular resolution in vivo when and where each regulatory protein is expressed. Previous large-scale expression atlases in model organisms such as Drosophila (Tomancak et al. 2002; Fowlkes et al. 2008) and C. elegans (Dupuy et al. 2007; Hunt-Newbury et al. 2007; Reece-Hoyes et al. 2007; Martinez et al. 2008) have provided insight into gene function, but have largely been limited to fixed stages or have not allowed comparisons of different genes' expression at cellular resolution over time. A dynamic, cellular resolution compendium could address the question of how transcription factors influence expression patterning.
The nematode Caenorhabditis elegans is an ideal system in which to measure developmental expression with cellular resolution because it allows whole-animal microscopy, and its invariant embryogenesis proceeds rapidly through a stereotyped pattern of cell divisions, generating identical patterns of 558 larval cells and 113 cell deaths in all individual embryos (Sulston et al. 1983). Early work on fate specification suggested that, while inductive signaling events are important, many developmental regulators are controlled in a cell-intrinsic, lineage-dependent manner (e.g., Baumeister et al. 1996; Cowing and Kenyon 1996). This lineage-based specification relies heavily on the Wnt signaling pathway to distinguish sister cells after each division and has been proposed to occur iteratively, with fate decisions made in early divisions modulating competence to make decisions later in development (Kaletta et al. 1997; Lin et al. 1998).
Liu et al. (2009) recently took advantage of the stereotyped pattern of cell positions in C. elegans larvae to quantitatively compare the expression of 93 fluorescent reporter genes across 363 cells in newly hatched L1 larvae. They identified several interesting features, including the existence of genes differentially expressed between cells within a given tissue, and the existence of “developmental clones” in which lineally related cells have strongly correlated gene expression, despite having different tissue identities. These results lead to questions about how these types of larval patterns are generated, as well as what types of expression patterns exist in the 195, mostly neuronal cells not analyzed by Liu et al (2009).
We have developed methods to trace the cell lineage of embryos expressing fluorescent reporters, resulting in quantitative expression measurements on a nearly continuous time scale that can be directly compared at cellular resolution between different animals (Bao et al. 2006; Murray et al. 2008). In this study, we apply these methods to quantitatively measure the expression of 127 genes' reporters with cellular resolution and with ∼1-min temporal resolution in C. elegans embryos through the 350-cell stage of development. The resulting patterns reflect not only tissue type, but also other dimensions, including physical position, lineage identity, and left–right symmetry, significantly increasing the number of genes known to reflect each of these dimensions. These patterns combine to distinguish each individual cell from nearly all other cells.
Results
A cellular resolution gene expression atlas of the C. elegans embryo
We identified a list of transcription factors and other regulatory proteins for which prior microarray or phenotype data suggested embryonic function and targeted these for expression analysis (Fig. 1A). For these, we constructed stable C. elegans strains expressing a histone-mCherry reporter under the control of the gene's upstream intergenic sequences (Supplemental Table 1). We analyzed expression of reporter strains whose expression begins before the last round of embryonic cleavage (the 350-cell stage) by crossing in a ubiquitous histone-GFP marker, collecting three-dimensional confocal time-lapse movies, and tracing the cell lineage as described previously (Bao et al. 2006; Boyle et al. 2006; Murray et al. 2006, 2008). The full data set included fully curated lineages for 263 embryos representing 111 genes' promoters. Both cell positions and division times for each embryo matched the wild-type patterns, suggesting that neither the transgene nor the imaging process caused major developmental abnormalities and that the lineage tracing was correct.
Figure 1.

Reporters show expression in a wide range of patterns and onset times. (A) Data collection strategy. Confocal movies are collected and analyzed by cell tracking (StarryNite) to generate a cell lineage tree. Expression is visualized by converting the raw reporter intensity in each cell into a color on a black→red scale (from minimum to maximum expression) and displaying the color on the appropriate branch of the tree. (B) Heat map showing how many genes were expressed differently (10-fold criteria, see Methods) between each pair of leaf cells (arranged in lineage order with color-coded fate bar). The cells with the most closely related expression patterns are generally close lineal relatives (dark blue on diagonal axis). For example, a muscle cell (pink in fate color code) from the MS lineage is more similar in expression to all other MS-derived cells (including pharyngeal and nervous system cells; large diagonal lines) than it is to muscle cells from the C or P3 lineages (small diagonal lines). Tissue color code is shown below. Secondary diagonals of similar cells (e.g., between ABpl and ABpr) represent l-r symmetric lineages; these symmetries were also observed by Liu et al. (2009) in 363 larval cells. (C) Expression patterns organized by hierarchical clustering (y-axis). The cells (x-axis) are arranged in lineage order. The numbered clusters (right), which correspond to the colored sections of the tree on the left, include multiple constructs with patterns biased toward (1) EMS lineage, (2) ABa lineage, (3) AB sublineages, (4) AB notch-signaled lineages (Priess 2005), (5) broad or ubiquitous patterns, (6) broad expression with hypodermal bias, (7) hypodermal precursors, (8) pharyngeal and intestinal precursors, (9) muscle precursors, (10) intestinal precursors. A full-resolution version of the cluster view is available as Supplemental Figure 3.
For global analyses, we expanded the data set by collecting comparable lineage data for 38 protein::GFP fusion reporter strains generated as part of the modENCODE project. The protein fusion strains are more difficult to generate and are generally less healthy and less bright than the promoter fusion strains, but can show complicated dynamics, which will be described in a separate study. In general, the identity of expressing cells is similar but not identical between protein and promoter fusions for most genes: On average, 62% of expressing cells replicated in comparisons between promoter and protein fusion strains. In these comparisons, the protein fusion reporters were sometimes expressed in additional cells, but just as often exhibited more restricted expression (Sarov et al. 2012). Some differences were expected, as the fosmid transgene-based protein fusions potentially include more regulatory sequence as well as allowing post-transcriptional regulation and concomitant weaker signal.
Including the protein fusion reporters, the combined data set includes 321 curated lineage expression patterns for 127 genes' reporters (Supplemental Table 2). The patterns are diverse, including embryos with expression in as few as two cells and as many as all cells and zygotic fluorescence beginning as early as the 24-cell stage and as late as the bean (∼550 cell) stage (Supplemental Fig. 1A,B). We describe our initial analysis of the data set below, but expect that additional insights remain to be discovered. To facilitate further discovery, we have placed the quantitative expression data for all cells and raw images at our Expression Patterns in C. elegans (EPIC) database (http://epic.gs.washington.edu) where they are freely available for viewing and download.
To generate a compact description of which cells express a particular reporter irrespective of time, we defined a metric “peak expression” for each of the 671 terminal (“leaf”) cells born during embryogenesis (Supplemental Fig. 2). For each of these cells, the peak expression is the maximal reporter intensity observed in that cell or any of its ancestors; this has the effect of transposing earlier expression forward in time to the terminal set of cells. This metric allows straightforward comparisons of genes' cellular and lineal expression overlap, even when the expression occurs with different timing and despite differences in the precise time point that curation ended in different movies, at the cost of ignoring the temporal dynamics of expression, a topic that requires separate treatment. For simplicity, we use the term “expressing cells” to mean the number of leaf cells (of 671) with peak expression greater than background (2000 intensity units) and at least 10% of the maximum expression in that embryo (see Methods for details). Based on this description of expression, 62% (79) of the genes studied had patterned reporter expression, defined as having expression in between 1 and 400 leaf cells; on average, each cell expressed 23 of these 79 patterned reporters. Of the remaining genes, two (dpy-7 and lin-11) had no expressing cells observed (because expression began well after the 350-cell stage), and the remainder were expressed broadly or ubiquitously.
The promoter reporters provide a readout of regulatory activity from a particular DNA sequence, but reporters may not always perfectly recapitulate the endogenous gene's expression. Regulatory sequences may lie outside the region incorporated in the construct and may be influenced by the site and process of integration. To test the extent of these pitfalls, we first compared the observed patterns with the endogenous gene's pattern for 29 genes curated by WormBase (Harris et al. 2009). The observed patterns here include all of the cells previously shown to express the endogenous gene (by antibody staining or in situ hybridization) for 27 of 29 genes; in addition, our lineaging data identified expression in cells that weren't previously annotated as expressing for six of these genes (Supplemental Table 3). In a second test, we compared results from different movies. Expression was highly concordant (>90% of strongly expressing cells replicated) for 78 of the 92 reporters for which we analyzed multiple embryos (Fig. 2; Supplemental Table 4). Of the remaining 14 reporters with higher variability, six involved replicates from different strains, where one strain was overall much brighter than the other, revealing additional expressing cells brighter than our threshold. This might reflect true variability from integration site differences, but could also result from other effects of strain construction. Five others were examples where the expression was just beginning at the 350-cell stage, reducing the reliability of detection. This difference was exaggerated in some cases where one of the replicate embryos had been curated to beyond the 350-cell stage to improve identification cells with late onset of expression. However, three genes had unambiguous within-strain variability (ceh-43, lsy-27, and elt-1). If this proves to occur at the endogenous loci as well, these strains may be useful tools for a more exhaustive study of gene expression variability.
Figure 2.

Consistency of observed expression in replicates. (A) Replication frequency for each reporter construct. For each pair of replicate embryos, we calculated the fraction of cells expressing with a peak intensity >5000 in the first embryo that also expressed with a peak intensity >2000 in the second embryo, and display the results after averaging for each gene (n = 52 genes). (B) Quantitative consistency. We compared the average fluorescence intensities of all cells for each by calculating the correlation coefficient (r), and averaged the correlation coefficients obtained for all replicates of a given gene. (C) An example pair of replicates for nhr-67, a case where the replication frequency is 95% and (D) the correlation coefficient is 0.89. This approximately represents the lower quartile of replication (75% of genes were more consistent in their expression than this pair).
Diversity of embryonic gene expression patterns
Most cell divisions in the C. elegans embryo give rise to two sisters with different fates, and these fate differences presumably result from genes expressed differently between sister lineages (e.g., Hunter and Kenyon 1996; Zhu et al. 1997; Horner et al. 1998; Kalb et al. 1998; Good et al. 2004; Neves and Priess 2005; Broitman-Maduro et al. 2006, 2009; Sarin et al. 2009). To facilitate identification of such genes, we developed automated criteria to identify reporter genes differentially expressed between sister lineages (based on a fivefold difference in average peak expression across the two lineages—see Methods for details). A total of 270 embryonic divisions had at least one reporter gene with differential expression between its daughters; 181 of these divisions could be distinguished by two or more data sets, either by different genes or by a replicate that confirmed the difference (with a threefold or higher difference—Supplemental Table 5). This includes the daughter lineages of 94% of divisions through the 50-cell stage, 79% of divisions leading to the 100-cell stage, and 57% of divisions at the 200-cell stage. This lower rate in later rounds may reflect more similar fates of the sisters, but could also reflect the fact that our power to identify distinguishing genes decreases at later stages due to the one to two cell cycles between expression commitment and onset of detectable fluorescence (Murray et al. 2008; Supplemental Fig. 1). Improved methods for late lineage tracing may allow detection of expression differences among these later sister cells. While previous studies have identified many distinct patterns of expression, it is striking that such a large fraction of sister cells can be uniquely distinguished with a relatively small sample of genes. A pdf poster showing reporters for which we observed differential expression, including how often the pattern was seen in replicates, is available as Supplemental Data.
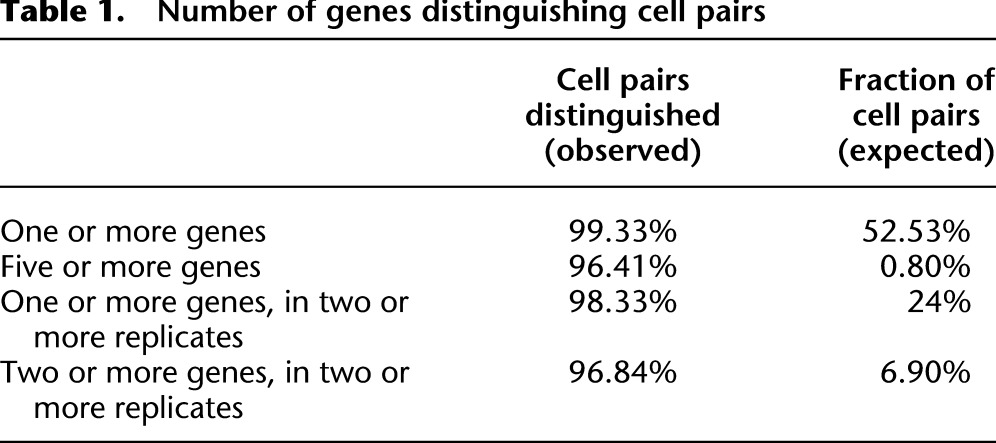
As a result of these differences in sister cell expression, most cells differ from each other in expression patterns. An average terminal cell has at least one reporter distinguishing it from 99% of all other cells. Ninety-four percent of cells can be distinguished by expression of five or more reporters (using a minimal 10-fold difference of peak expression to distinguish different cells) (Fig. 1B). In general, closely related or symmetric cells have fewer genes differentially expressed between them than do more distantly related cells (Fig. 1B). For example, the anterior neuron AINL (ABalaaaalal) is not distinguishable from its sister (a cell death), has only one gene (ttx-3) whose expression distinguishes it from its cousin cells (ILshL and another cell death—separated by two divisions), but has four genes (ceh-43, ttx-3, ref-2, and F21D5.9) that distinguish it from ILshR (which is separated from AINL by five divisions—see Supplemental Poster). While the number of replicates per gene do not provide enough power for independent statistical tests for each cell pair's differences, we estimated the impact of variability and noise on this analysis by determining how often different numbers of difference would be expected by chance based on the variability of the same cell across replicate embryos (Table 1). Notably, 97% of cells could be distinguished by two or more replicates of two or more genes, compared with 7% expected by chance. Many factors such as tissue type, lineage history, physical position, and symmetry status may influence expression patterns individually or collectively. To learn more about the basis for this complexity of gene expression, we used clustering to identify groups of reporters (Fig. 1C; Supplemental Fig. 3) or cells (Supplemental Fig. 4) with similar expression patterns. The dominant clusters included genes expressed in intestine, muscle, hypodermis, intestine, and pharynx, and ubiquitously expressed genes. The presence of many genes weakly correlated with all others (long branches in the cluster dendrogram) indicates that many reporters were expressed in unique patterns not shared with other genes in our data set. This raises the question of what features drive diversification of expression patterns.
Table 1.
Number of genes distinguishing cell pairs
Reiterated patterning of daughters from anterior–posterior divisions
Most divisions in the embryo occur along the anterior–posterior (A–P) axis, and differential Wnt-mediated signaling along this axis is well established as a major factor driving fate asymmetry of sister lineages (Kaletta et al. 1997; Lin et al. 1998; Park and Priess 2003). The model posits a generic A–P cue that acts combinatorially and iteratively with lineage-specific factors to determine expression patterns. A strong candidate for this cue is the TCF/Lef transcription factor POP-1, which is known to regulate fate diversification in many A–P divisions (Bertrand and Hobert 2010). The detailed expression patterns might provide new candidate genes downstream from POP-1. To identify such candidates, we first looked for reporters expressed in multiple sublineages derived from either anterior daughters or posterior daughters, but not both. For example, the ceh-16 reporter is expressed in 15 lineages, all but one derived from the anterior daughter of a division, while a pax-3 reporter is expressed strongly in five lineages, all derived from posterior daughters (Fig. 3A). This is distinct from physical position; both the ceh-16 reporter-expressing cells and the pax-3 reporter-expressing cells were distributed over the full length of the embryo (Fig. 3B). Across the full data set, reporters expressed in more than two lineages were significantly biased toward expression predominantly in either anterior or posterior lineages, and not both (Fig. 3C) (P < 10−19). This reiterates that anterior–posterior position of daughter cells is a major feature governing gene expression, and suggests that A–P lineage pattern regulation occurs for a substantial fraction of genes.
Figure 3.

Lineage motifs and reuse of anterior-posterior expression logic. (A) ceh-16 and pax-3 reporters are expressed in multiple sublineages. The diagrams are organized according to the conventions of Sulston et al. (1983), with time on the vertical axis, divisions represented by horizontal lines, and the anterior daughter placed in the left position of each division. Red intensity is displayed proportional to the measured fluorescence signal. Arrowheads mark inferred commitment points (Color of arrowheads: [red] identified using the fivefold difference in lineage average criterion used for Supplemental Table 5 and described in detail in the methods; [blue] lineages below the fivefold cutoff identified by manual inspection, actual fold difference for these cases was between threefold and fivefold). In one of three pax-3 replicates, additional weak expression below our threshold was observed in the (posterior-derived) ABarp lineage, and the ceh-16 reporter was expressed at low levels (also well below the threshold) in the additional posterior-derived lineage ABprappp. (B) Three dimensional projections of confocal micrographs show the terminal positions of expressing cells for the reporters shown in A are distributed over the full length of the embryo. (C) Histogram showing that reporters differentially expressed in three or more lineages (black bars, using the fivefold lineage-based cutoff) are biased toward mostly anterior or mostly posterior lineages relative to randomized control (white bars). (D) Identification of lineage motifs. (Left) Example showing mapping of egl-5 reporter expression (top) onto a binary two-division pattern (bottom). (Right) Frequency of 2-division and 3-division lineage patterns. (E) Examples of A–P patterns in the lineage derived from the C founder cell. In some cases lineage patterns are correlated with tissue identity (nhr-171) or position (lin-39). (F) Changes in reporter expression after pop-1 RNAi. tlp-1 and ceh-27 show ectopic expression in the anterior lineage (a→p conversion), tlp-1 and elt-6 show both gain of anterior expression and loss of posterior expression.
In many cases, lineal expression patterns recurred on multiple closely related lineages (e.g., Fig. 3E; Supplemental Poster). To examine the significance of this, we represented the observed patterns as simple binary codes and looked for patterns that occur more often than expected by chance, termed “lineage motifs”. For example, if two sister cells both divide asymmetrically to yield one expressing daughter lineage each (Fig. 3D), four patterns are possible; expression could occur in both posterior daughters (a coherent pattern), in both anterior daughters (also coherent), or in the anterior daughter of one cell and the posterior daughter of the other (incoherent patterns). We observed 28 examples of coherent patterns in sister lineages compared with only three examples of incoherent patterns (P < 10−5). Similarly, significant bias for coherent patterns exists in parent and daughter lineages, and in cells separated by two divisions (Fig. 3D). Within a given lineage, different genes often were expressed in distinct repetitive patterns (Fig. 3E). The strong tendency for related cells to make similar decisions suggests that reuse of regulatory modules sensing A–P division polarity in related lineages is a common regulatory strategy.
To determine whether the posterior-based patterns we observed are POP-1 dependent, we traced the expression of 10 of these reporters after depleting pop-1 by RNAi (Fig. 3F; Supplemental Figs. 5,6). POP-1 protein is preferentially depleted in posterior nuclei by a Wnt-dependent mechanism after most A–P oriented divisions in the C. elegans embryo, is known to repress posterior fate in the anterior daughter (Lin et al. 1995, 1998; Park and Priess 2003) and to activate posterior fate in the posterior daughter of several divisions (Maduro et al. 2005b; Huang et al. 2007; Phillips et al. 2007), and is likely important for asymmetry in many divisions (Kaletta et al. 1997). For six genes (ceh-36, ceh-27, tbx-11, nhr-25, tlp-1, and elt-6) loss of POP-1 resulted in ectopic expression in the anterior sister of the (posterior) lineages that express in wild type, suggesting that POP-1 normally represses expression in these anterior lineages. For three reporters (tlp-1, elt-6, and pha-4) pop-1 RNAi resulted in loss of expression in posterior lineages, suggesting a role for POP-1 in activating gene expression in these posterior lineages. For the other three genes (nhr-25, nhr-67, and cnd-1) more complex transformations occurred that are consistent with POP-1 loss causing homeotic transformations in earlier divisions, prior to the onset of expression. Together, these results strongly support the model where POP-1 acts to regulate asymmetric gene expression in the daughters of a wide range of embryonic divisions and importantly provide candidate effectors of the POP-1 signal.
Tissue and position correlated gene expression
We expected to find a large number of tissue-dependent expression patterns based on previous large-scale studies (Hunt-Newbury et al. 2007) and the fact that master regulators of specific tissue types exhibit tissue-specific expression (such as hlh-1 in muscle) (Krause 1995), pha-4 in pharynx (Horner et al. 1998; Kalb et al. 1998), elt-1 in hypodermis (Gilleard and McGhee 2001), end-1 in intestine (Zhu et al. 1997), and mec-3 in touch neurons (Way and Chalfie 1988). We identified 38 genes in our data set whose reporter expression is correlated with the major tissue types (correlation coefficient >0.4) (Fig. 4A). The most common tissue-enriched pattern was intestinal expression, which was observed for 19 genes. Eight genes were correlated with muscle, five with hypodermal or blast cell fate, one with pharynx, and three with neuronal fate. For some genes, expression was quantitatively enriched in a tissue, but not all or none. This was particularly true for genes best correlated with nervous-system identities; they were either also expressed broadly in other non-neuronal tissues or were limited to a subset of neurons. Many of the genes whose expression is correlated with a tissue were specific to that tissue type, including hlh-1 in muscle, nhr-25 and nhr-23 in hypodermis, and 15 genes in intestine, including the GATA factors elt-2, elt-7, end-3, and end-1. The average correlation coefficient with tissue identity for tissue-biased genes identified for non-neuronal tissues was 0.76, compared with 0.43 for neuron-biased genes, emphasizing the weaker nature of nervous-system-specific expression at this developmental stage. The differences between the tissues in the number of patterned genes could result from differences in complexity; for example, the nervous system includes a much wider range of cellular phenotypes than does the intestine. Alternatively, it could reflect differences in specification time; the intestine is clonal and specified early in embryogenesis, muscle and hypodermis specification begins two to three cell cycles later, and the nervous system is not clonal, with neuronal fate not fully specified until after the last round of cell divisions.
Figure 4.

Multidimensional regulation of expression. (A) Tissue-correlated expression. Cells are arranged by tissue on the x-axis and genes are sorted by which tissue or combination of tissues they are best correlated with: (B) Blast; (H) Hypodermis; (N) Neuron; (G) Glia; (I) Intestine; (P) Pharynx; (M) Muscle. Genes were included if their correlation coefficient to a given tissue identity was greater than 0.4. (B) Position-correlated expression. Three dimensional models showing the location and measured intensity of all expressing cells for six reporters expressed in specific anterior–posterior positions at the 350-cell stage. (C) Left–right asymmetric expression (expression in an individual cell pair considered asymmetric if at least 10-fold different, see Methods for details). For the alr-1 reporter, all expressing cells are shown in the projection colored by intensity, and the lineage shows left-biased expression in the MSa and MSp lineages. MSa (left) and MSp (right) produce symmetrically equivalent cells except for the branches marked with an asterisk (*). pes-1 reporter expression in MS is biased for the left (MSa colored red) cells and only expressed in one right (MSp colored blue) cell, while in the C lineage the expression is limited to right cells (Cp, colored blue). Notably, pes-1 expression in other lineages is L–R symmetric.
Cells of the same tissue type can have position-dependent functional differences. In humans, fibroblasts from different regions of the body differ in the expression of position-specific regulators such as Hox genes (Chang et al. 2002). C. elegans Hox genes are similarly known to be expressed in position-specific patterns as in other organisms (Cowing and Kenyon 1992; Wang et al. 1993), although these patterns were surprisingly found to be regulated by lineage history rather than directly by position (Cowing and Kenyon 1996), and more recent work suggests that the position to which a cell migrates depends on its lineage identity in the wild-type and homeotic mutants (presumably due to gene expression) (Bischoff and Schnabel 2006; Schnabel et al. 2006). Consistent with this, the four Hox reporters in our data set (egl-5, mab-5, lin-39, and nob-1) were each limited to a defined region along the anterior–posterior axis. However, we also identified 35 non-Hox reporters for which the expressing cells were limited to a specific anterior–posterior physical position, defined as having a standard deviation <20% of the embryonic length for at least one embryo (Fig. 4B; Supplemental Table 6), and 25 of these were positionally expressed in two or more replicates. Some of these are known from previous studies to be important for positional identity, including the anterior-biased ceh-32 (RNAi results in crooked head) (Dozier et al. 2001) and the posterior-biased vab-7 (mutants have multiple tail defects) (Ahringer 1996), but most have not previously been associated with specification of position. Most of these reporters were expressed in cells that contribute to multiple tissue types and arise from multiple lineages, ruling out the possibility that positional specificity results solely from single clones of expressing cells that are near each other because of their tight ancestry. This type of pattern could regulate position-specific behavior. For example, anterior intestinal cells need to connect to the pharyngeal–intestinal valve, posterior intestinal cells need to connect to the intestino–rectal valve, and other intestinal cells connect only to other intestinal cells.
Left–right asymmetry
Most cells in C. elegans occur as left–right (L–R) symmetric pairs. Sulston identified 29 homologous lineage pairs where the L and R lineages produce primarily L–R symmetric cells through equivalent division patterns (Sulston et al. 1983). These homologous lineages produce 626 cells, while 45 additional cells arise from asymmetric lineages. In some cases the homologous lineages are sisters, but they also frequently arise instead from disparate positions in the lineage. Seventy two of the cells within L–R homologous lineages break symmetry by adopting a different fate from their symmetric partner; for example, the left blastomere ABplpaa produces 15 neurons, two cell deaths, and the excretory duct cell, while the homologous right lineage ABprpaa generates identical cells, except with the excretory duct replaced by the embryonic excretory pore cell. The asymmetry may be more extensive than described (Sulston et al. 1983), since even morphologically identical symmetric cells can differ in function. For example, the L and R ASE gustatory neurons are morphologically identical, yet express different receptor proteins and respond to different chemical stimuli (Pierce-Shimomura et al. 2001). Genes expressed asymmetrically in L–R symmetric lineages would be useful tools in determining how these asymmetries are generated from otherwise equivalent lineages. We asked whether any reporters in our data set are expressed asymmetrically in homologous L–R lineages. Intriguingly, 39 genes have asymmetric reporter expression, defined based on 10-fold intensity differences, in at least one cell pair, with 15 genes asymmetric in 10 or more pairs of cells (Supplemental Table 7). In total, our data set includes at least one asymmetric reporter for 284 of 313 cell pairs derived from homologous L/R lineages, including 56 of the 72 cells embedded in these lineages that break symmetry at the level of fate. For 178 of these cell pairs at least one gene was differentially expressed in two or more replicates.
Some of the expression asymmetries occur in homologous lineages that arise from distant parts of the full lineage where the multiple separating divisions provide many opportunities to accumulate lineage-dependent or signal-induced expression difference. A previous study identified this type of mechanism as distinguishing the L and R ASE neurons, which are separated by five divisions (Poole and Hobert 2006). We also saw expression asymmetry between homologous sister lineages. The founder cells MS and C each divide along the A–P axis to give daughter lineages that migrate to adopt homologous L and R fates, with only a few terminal cells breaking the symmetry rule in each lineage. For example, Ca and Cp produce identical patterns of hypodermal and muscle cells, except that the left cell Caap forms neurons instead of the hypodermis formed by its right equivalent Cpap. Reporter expression for pes-1 and alr-1 distinguishes the L and R lineages for each of these two cells (Fig. 4C). In other lineages, pes-1 expression is symmetric (but A–P repetitive), but alr-1 is notable because a substantial fraction of its expression is asymmetric (although some symmetric expression of this gene does occur later in development [Tucker et al. 2005]). Notably, these reporters' asymmetric expression occurs even in cells that apparently adopt the same fate on both sides of the animal, and expression begins before the symmetry-breaking cells are born. Therefore, these lineages are distinguished by early symmetry-breaking events and not solely by inductive events in the terminal cells.
Cascades of lineage-specific expression predict embryonic regulatory pathways
The classic model of developmental patterning through sequential specification of fates requires cascades of expression, where different TFs are expressed in a given lineage at progressively later onset times and in progressively restricted sets of cells. This has been observed for lineages whose specification is well studied, such as E (Maduro and Rothman 2002), MS (Broitman-Maduro et al. 2009), and C (Baugh et al. 2005). We observed many new examples of this type of cascade (Fig. 5; Supplemental Poster). In some cascades, reporters are expressed in all cells of a given lineage with progressively later onset time. For example, reporters for 16 genes were expressed throughout the E (intestinal) lineage but not in its sister lineage, MS (Fig. 5A,C). These ranged in onset time from 102 min (end-1) to 249 min (ges-1), and included several known regulators of E fate. An additional seven reporters were expressed in unique subsets of E lineage cells (Fig. 5B)—on average these tend to have later onset times than the reporters expressed throughout E. To test the potential for predicting regulation from our expression data, we examined the upstream intergenic sequences of these E-lineage-specific genes. The E lineage is known to be specified through a transcriptional cascade of the GATA factors end-1, end-3, elt-2, and elt-7 (for review, see Maduro and Rothman 2002). Our reporters for these GATA factors showed specific expression in the E lineage with timing lags consistent with previous reports (Zhu et al. 1997; Fukushige et al. 1998; Maduro and Rothman 2002; Maduro et al. 2005a). We used the Gibbs Sampling program Bioprospector (Liu et al. 2001) to identify DNA sequence motifs in the promoter sequences of these E-lineage-specific reporters. The top-scoring motif was ANWGATAAGY, which matches the known binding site for the mammalian GATA3 factor (WGATAA) (Portales-Casamar et al. 2010). Furthermore, the known GATA3 motif was significantly enriched in the 1-kb upstream intergenic sequences for the E-specific genes. Consistent with this, we recently found that seven of these genes' expression changes either in level or pattern in end-1 or end-3 mutants (Boeck et al. 2011).
Figure 5.

Lineage-specific cascades suggest regulatory pathways. (A) Expression of a subset of E-lineage-specific patterns arranged by onset time (E-specific expression identified using the fivefold lineage cutoff). (B) Reporters with patterned expression in the E lineage. (C) Timing of all E-specific patterns. (D) Lineage-aligned reporter expression patterns of eight genes showing progressive restriction of expression in the daughters of AB (tbx-38), ABal (ceh-32 and hlh-26), ABalp (pha-4 and ceh-43) and ABalp daughters (tbx-11), granddaughter (alr-1), and in the left ASK neuron derived from this lineage (ttx-3). A poster-sized curated set of patterns distinguishing cells of all lineages is available as a Supplemental Poster.
A second category of cascade involved progressive specification of later sublineages, consistent with the model of progressive binary specification through iterative Wnt signaling and POP-1 activity (Kaletta et al. 1997; Bertrand and Hobert 2010). For example, the t-box TFs tbx-37 and tbx-38 distinguish ABa from its sister ABp, and then the reporters for ceh-32, hlh-26, pha-4, ceh-43, tbx-11, and alr-1 progressively distinguish the daughters of succeeding divisions until finally the sensory neuron ASKL and its sibling (which undergoes programmed cell death) express a reporter for ttx-3 (Fig. 5D). All of these genes, except tbx-37/38, are also expressed in other lineages. Such cascades can be generated for every terminal cell (Supplemental Poster), providing useful tools for determining regulatory mechanisms governing each lineage's specification. The genes in these cascades are candidate regulators of lineage identity.
Differences between embryonic and postembryonic expression
Liu et al. (2009) recently reported quantitative expression measurements for about 100 reporters in about two-thirds of the cells (mostly non-neuronal) present in L1 larvae. Because they analyzed 48 of the same reporter strains used in this study, we can compare expression in the first half of embryogenesis with larval expression in the same cell lineages directly by calculating the correlation between the peak expression level and the reporter intensities reported in the larval study. While correlation between larval and embryonic expression for patterned genes was significant (mean r = 0.41), this correlation was much lower than between replicates of the same embryonic pattern (Supplemental Table 4). Examining the patterns in detail, about half of the expression differences involve reporters expressed in larval cells whose embryonic ancestors did not express that reporter. This is not surprising given that some differentiation and maintenance programs do not begin until after the 350-cell stage, and our analysis did allow us to observe expression at these later time points. However, it was just as common for a strain to express a reporter in embryos but lose that expression by the L1 stage. This emphasizes the dynamic nature of developmental programs that are driving expression of the transcription factors and emphasizes that scoring expression patterns only in L1 animals is not sufficient to completely catalog the cells in which a gene is expressed. In other words, expression in lineally related cells does not necessarily imply expression in their common ancestor as was inferred in Liu et al. (2009).
Discussion
We present here the first large-scale, digital, cellular resolution compendium of gene expression pattern over time in live C. elegans embryos. Several other studies have generated and analyzed large collections of C. elegans reporter expression strains. In addition to the cellular resolution atlas of larval expression described by Liu et al. (2009), these include a pioneering collection of 1886 strains expressing promoter-GFP fusions largely from multicopy extrachromosomal arrays (Hunt-Newbury et al. 2007) that notably included manual lineage analysis to identify expressing cells for a few reporters (albeit without the quantification and dynamics facilitated by our automated methodology). Other large-scale studies include a collection of 366 transcription-factor promoter::GFP reporters (Reece-Hoyes et al. 2007), and of 73 microRNA promoter::GFP reporters (Martinez et al. 2008). Each of these studies generated a substantial resource of strains and biological insight, but quantitative analysis and integration of the results was limited by the static and descriptive nature of the analyses, which required manual annotation of individual images using controlled vocabularies and subjectively curating lists of expressing cells. Others (Dupuy et al. 2007) examined the expression of about 900 reporters by a flow cytometry method that gives a one-dimensional picture of expression intensity over the length of each worm in a population. The quantitative nature of this approach makes this data set especially useful for computational analysis, albeit without cellular resolution and only for postembryonic stages.
We observed strong influence of lineage history on expression, especially the predominance of repetitive anterior–posterior lineage patterns across a substantial fraction of transcription factors. These patterns frequently repeat to form patterns on the lineage (e.g., ceh-16) (Fig. 3A) with different scales consistent with the pattern being involved in combinatorial specification of fate. These results support the generality of the model that a large fraction of fate specification in C. elegans embryos occurs through lineage-dependent mechanisms (for review, see Bertrand and Hobert 2010). Wnt components are clearly major regulators of lineage-mediated fate specification. Kaletta et al. (1997) showed that mutants in lit-1 (which negatively regulated Wnt signaling) undergo widespread posterior to anterior fate transformations, and reciprocal changes are seen in loss-of-function mutants of pop-1 (Lin et al. 1998). These studies strongly support the general model that fate specification occurs in part through sequential fate specification through a binary decision tree that diversifies the daughters of each division, although numerous inductive interactions are also important in other fate decisions (e.g., Priess 200).
A classic example of this type of specification is in touch neuron specification. These cells' fate is specified by a cascade where lineage-specific expression of the POU Homeodomain factor unc-86 (Baumeister et al. 1996) combines with additional regulators to result in expression of the LIM homeodomain factor mec-3 in a subset of anterior daughters of unc-86-expressing cells (Way et al. 1992; Wang and Way 1996). UNC-86 and MEC-3 then cooperatively activate the expression of touch-neuron-specific genes (Way and Chalfie 1988; Duggan et al. 1998). More recently, direct roles for context-dependent Wnt pathway control have been demonstrated in regulating intestinal fate (Maduro et al. 2005b), distal tip cell specification (Lam et al. 2006), terminal neuroblast division (Bertrand and Hobert 2009), and asymmetric divisions in the T blast cell lineage (Yoda et al. 2005). Our findings that pop-1 regulates repetitive anterior–posterior expression differences in multiple lineages extends the number of known pop-1 targets, and suggests that a substantial fraction of regulatory genes are targets of pop-1 in multiple diverse lineages. This implies that pop-1-response elements can interact with multiple context factors to generate combinatorial regulation. The transcription factors we identify as having lineage-specific reporter expression are candidates for these selectors of lineage-specific pop-1 targets.
Our identification of many new genes with L–R asymmetry provides useful tools to help identify regulators of this type of asymmetry. Recent work identified asymmetrically expressed transcription factors, including ceh-36, that regulate a single-fate asymmetry in the symmetric ABaraapa/ABaraapp lineages (Nakano et al. 2010). Interestingly, expression of our transcriptional reporter for ceh-36 is not detected asymmetrically in these cells in any of three different strains. However, while our construct included 5.0 kb upstream, whereas the Nakano et al. (2010) genomic construct included only 2.5 kb, the Nakano construct also included the introns and 1 kb of downstream sequence. This suggests that the asymmetry-regulating elements are located in the genic or downstream regions, or that the sequences between 2.5 and 5 kb upstream inhibit this expression. Notably, the division that generates the initial asymmetry, like many of the divisions leading to L–R homologous lineage is initially oriented A–P, with L–R symmetry resulting from subsequent cell movements, and thus could be controlled by the same pop-1-mediated mechanism used for other A–P divisions. True left–right oriented divisions are rare and on average show fewer expression differences, although asymmetries do exist. For example, our data set confirms the asymmetric expression pattern of ref-1 in descendants of L–R divisions in the E lineage, an asymmetry that has been shown to depend on Notch signaling (Neves and Priess 2005).
The patterns and strains described here will be useful resources for the community. Potential regulatory interactions identified based on coexpression patterns (e.g., Fig. 5) will be useful in interpreting transcription-factor binding data produced by the modENCODE project and others (Celniker et al. 2009; Zhong et al. 2010). The cascades identified in this report provide an initial set of candidate regulatory relationships. Such predictions can be tested directly by perturbing candidate regulators and examining the downstream reporter for both qualitative and quantitative changes in expression, as done here for pop-1 (Murray et al. 2008). Fluorescent labels specific for particular lineages will be useful in screening for regulators of those lineages, and if sorted by flow cytometry (Fox et al. 2005) can be used to globally identify expression and other molecular attributes of different lineages. This data set makes it possible to identify genes differentially labeling nearly every pair of cells, providing a useful toolkit for such molecular characterization.
Methods
Data collection, imaging, editing, database, partial editing
We combined the list of C. elegans transcription-factor genes (Reece-Hoyes et al. 2005) with other important developmental regulators and genes with previously characterized embryonic expression. We prioritized genes for further analysis that were expressed differently in wild-type and homeotically transformed embryos in a previous study (Baugh et al. 2005). For each target gene, we designed PCR primers to amplify the upstream intergenic sequences (UIS) by using the program Primer3 (Rozen and Skaletsky 1998). For genes with short UIS, we used a minimum target length of 2250 bp, and for genes with long UIS we used a maximum target length of 5750 kb. We allowed Primer3 to pick the best distal primer within 250 bp of the target and fixed the proximal primer by anchoring it at the translation start site (including up to 6 aa of the endogenous protein, which increased PCR success rates). Prior studies have established that the type of long promoter regions we used here often produce patterns that are correct enough to allow genetic rescue, and even shorter (<2 kb) promoter regions either completely or partially match the endogenous expression patterns (e.g., Reece-Hoyes et al. 2007) We cloned each UIS PCR product into pJIM20 (containing a cloning site followed by histone-mCherry and a permissive let-858 3′ UTR) (Murray et al. 2008) using standard cloning methods and used the resulting plasmids to generate transgenic C. elegans by microparticle bombardment of the strain CB4845[unc-119(ed3)] (Praitis et al. 2001). Strains with visible histone::mCherry were followed for at least three generations to insure stable inheritance. A full list of strains generated for this project is available in Supplemental Table 1.
None of our promoter reporters are expressed in the germline, even when the endogenous gene is—this may be due to specific UTR requirements for germline expression (Merritt et al. 2008). Therefore, they provide information about onset time and spatial regulation of zygotic expression for each promoter. We observed expression beginning as early as the 28-cell stage, consistent with widespread zygotic transcription beginning at the eight-cell stage (Newman-Smith and Rothman 1998) and a lag of ∼30 min for mCherry translation, folding, maturation, and nuclear import (Murray et al. 2008; Supplemental Fig. 1A). The high stability of the histone-mCherry reporter allowed us to identify zygotic activity with a high sensitivity, but limits our ability to detect cases when expression dynamically turns off.
We crossed the strain RW10029 with each promoter reporter strain to generate strains homozygous for both the ubiquitous histone H3.3-GFP lineage tracing marker and the histone-mCherry reporter. We then imaged these strains and traced their lineages as described previously (Bao et al. 2006; Boyle et al. 2006; Murray et al. 2006, 2008). We curated each movie's lineage to the 350-cell stage, which, in general, was defined as the time when E has divided to produce 16 cells (E16), and C has divided to produce 31 cells (C31). While development is highly reproducible (each cell cycle length has a standard deviation of ∼2% across embryos), this low rate of variation still results in variation in the list of cells present in the last curated time point (e.g., some MS divisions occur before or after the last C31 cell in different embryos). A list of analyzed embryos is available in Supplemental Table 2. To store and organize the data, we developed a custom XML-based embryo database (source code and java executable available at http://waterston.gs.washington.edu/tools.html). Expression and position data for each cell at each time point in each embryo are available as comma-separated value files at http://waterston.gs.washington.edu/epic/. For 11 genes, we partially traced the lineage beyond the 350-cell stage to identify cells with later onset where this was possible and allowed the identification of all expressing cells (egl-5, mab-5, T28H10.3, ceh-6, ttx-3, lin-39, nob-1, mir-57, mir-61, dpy-31, ges-1). It was not done for all genes, as each case required a substantial amount of manual lineage tracing. For an additional 26 reporters, we generated movies but did not curate lineages because expression occurred only after the 350-cell stage (n = 21) or occurred uniformly in all cells (n = 5) (Supplemental Table 1).
The protein fusion strains were generated as part of the modENCODE project and their expression dynamics will be described in detail elsewhere. Briefly, a GFP-3XFLAG tag was introduced at the C terminus of each transcription-factor's coding region in a genomic fosmid clone by recombineering (Sarov et al. 2006). An unc-119 rescue marker was introduced by recombineering into the fosmid backbone, and integrated transgenic strains were made by bombardment. Data collection was the same as for the promoter fusions except that the strain RW10226 (itIs37[pie-1 promoter-mCherry::H2B-pie-1UTR + unc-119(+)]; stIs10226[his-72 promoter HIS-24::mCherry let-858 3′ UTR + unc-119(+); unc-119(ed3)]) was used for the lineage tracing marker, and the colors were reversed for all downstream analyses.
Data processing
To facilitate direct comparisons, we first corrected the expression values for z-bias using a calculated attenuation level of 3.3% per plane as described previously (Murray et al. 2008) and then aligned the data for each embryo onto a reference lineage with standard cell cycle lengths derived from Sulston et al. (1983). We then calculated peak expression for each of the 671 “leaf” (terminal) cells listed in Sulston et al. (1983) by creating a vector of the previous expression values for that cell or its ancestor, calculating the median expression over all windows of nine adjacent time points in the aligned data, and choosing the highest median expression value. These values are insensitive to the timing of reporter expression; if expression began in a single early cell or in all eight of its great-grandchildren, all eight daughter cells receive a high peak score. Thus, peak expression provides a useful way of aligning expression patterns by lineage, irrespective of timing.
Onset time was estimated by two methods. First, we fit a linear model to the first 50 time points and then detected the first time point for which the data deviate from that model with a P-value < 10−7. Second, we identified the first time point where median expression within a window of nine time points around that time point exceeded the expression cutoff (2000 units). We chose an empirical expression cutoff of 2000 based on the values seen in the negative control embryos (no cells more than 2000). In a subset of reporters, weak expression above the 2000-unit cutoff was present in many cells, but a restricted population of cells had clearly brighter expression. To identify these cells, we created a second criterion that considered a cell as expressing if it both exceeded a peak value of 2000 and was higher than 10% of the maximum peak value observed for that embryo. This 10% cutoff was chosen based on the observation that in reporters that appeared uniform and ubiquitous by eye on a compound microscope, the lower limit of peak expression was ∼20% of the maximum level. We used this more specific definition of expressing cells for all subsequent analyses. Supplemental Data set 1 contains lists of all expressing cells for each gene. Hierarchical clustering (Fig. 1C) was performed by first calculating peak expression levels for each cell, averaging the data for all embryos of a single reporter construct. The reporters were clustered with Cluster 3.0 (de Hoon et al. 2004) (average-linkage clustering using centered correlation as the distance metric) and visualized with Java TreeView (Saldanha 2004).
Establishing differential expression thresholds
We used empirically determined cutoffs to identify differential expression. These cutoffs differed depending on the type of comparison. The baseline cutoff for determining whether a single cell was expressing (>2000 and 10% of maximum) was determined by analysis of negative controls and was set so that no negative control cells were called as expressing. This strategy is designed to minimize false positives but will not identify weak expression (such as expression below the 2000-unit cutoff), and is thus a conservative expression call. The cutoff used to identify similarity in expression between replicates is described below (Analysis of replicates) and is based on the analysis methods typically used for data such as ChIP-seq, where small variations around the detection threshold can impact sensitivity. To identify genes that distinguish pairs of individual cells, we used a 10-fold cutoff; this was based on the observation that the same cell differed by this amount in replicate embryos of the same strain only 0.4% of the time and only in a few genes with high variability. This is a higher-fold difference cutoff than that used to identify lineage differences, largely because the lineage differences benefit from averaging across multiple cells. We identified genes that were more than 10-fold different across each pair of cells in either one or more than one replicate. To determine the fraction of cells expected to be distinguished by different numbers of genes and replicates chance (Table 1), we extrapolated from the 0.4% differences per cell pair rate observed in the same cells in replicates of the same strain. Finally, to identify sister lineages with differential expression where there was consistent expression across the cells in the expressing sister lineage, we required expression in >75% of the cells in the expressing lineage and a fivefold average difference across the cells in the sister lineages (described in more detail below in “Identification of lineage-correlated expression”). While the number of replicates excludes a statistical test for each individual event, most of the lineages passing this threshold were seen in multiple replicates where replicate data exist.
Literature comparison
Endogenous expression data generated by antibody staining or in situ hybridization were available in the literature for 29 of the genes whose promoters were studied here (Supplemental Table 3). For all but two of these (lin-26 and pgp-3) our patterns were completely consistent with the literature pattern (with the exception of maternal expression, which we do not see for promoter fusions as described above). The literature patterns frequently also listed “unidentified” embryonic cells that presumably correspond to cells identified in our data set. Notably, lin-26 is a downstream gene of an operon and therefore likely uses another promoter outside of its directly upstream intergenic sequence that was used in our construct. Consistent with this, >90% of the 5′ splice leader containing reads in the modENCODE RNA-seq data for lin-26 contain the SL2 leader that is trans-spliced onto internal operon-derived transcripts (Gerstein et al. 2010; Allen et al. 2011). For pgp-3, no obvious explanation is apparent, but the characterization of the antibody staining pattern primarily focused on postembryonic expression, making it possible that weak or transient embryonic expression exists (Broeks et al. 1995). Regardless of the differences between endogenous and reporter patterns, the reporter patterns provide a readout of an activity specific to each promoter DNA sequence, and our patterns demonstrate ways in which these activities vary between cells.
Analysis of replicates
We previously showed that lineage-based expression patterns are highly reproducible when comparing multiple movies of the same strain or of different strains made with the same reporter construct (Murray et al. 2008). To confirm this on the larger data set, we estimated the reproducibility of each pair of replicate embryos by two metrics. First, we calculated the correlation coefficient of the average fluorescence intensity of all cells in the replicate embryos as described previously (Murray et al. 2008). Second, we tested the reproducibility of the identity of expressing cells (replication frequency): A well-expressing cell (peak expression >5000) in one embryo was considered to replicate if it exceeded a peak expression of 2000 in a replicate embryo. This method is analogous to methods used for ChIP-seq reproducibility analysis (e.g., Li et al. 2008); use of a high and low cutoff avoids artifacts associated with random variation around the low (2000) cutoff. In control embryos expressing no reporter, peak expression never reached a value of 2000. For both metrics, we averaged multiple comparisons within the same gene. The results are available in Data set S1. Replication frequency was similar for genes expressed broadly or specifically; however, broadly expressed genes tended to have lower correlation coefficients, suggesting that the variation of expression between cells for these genes may not be biologically important. None of our experiments address what fraction of variability is biological vs. technical—characterization of promoters with more or less intrinsic variability would be an interesting area for future studies. In total, we assessed the reproducibility of expression (Fig. 2; Supplemental Table 4) for 86 genes (92 constructs), where we analyzed two or more embryos. Both the fraction of expressing leaf cells that replicate in a second embryo (median >99%) and the correlation coefficient of expression intensity for all cells including non-leafs (median r = 0.85) were high and similar to the levels we observed earlier for a smaller set of genes (Murray et al. 2008). Correlation is an imperfect metric because it does not account for overall brightness differences and is sensitive to the total number of expressing cells (we expect r = 0 for replicates with expression in either zero cells or all cells). However, normalizing for global brightness differences, a correlation coefficient of 0.85 for a gene expressed in <100 cells corresponds to a roughly twofold variation in intensity levels as assessed by analysis of simulated experiments with different levels of noise. For reporters expressed in more than 100 cells, twofold variation would lead to lower correlation levels, which is what we observe. The observed correlations are consistent with a less than twofold change (in normalized expression) on average across the full data set.
Identification of lineage-correlated expression
We used a heuristic scoring method to identify reporters differentially expressed between each pair of sister lineages. The goal was to identify genes expressed consistently across all of the progeny of one cell, but not in the progeny of its sister. For each division, we selected candidate genes that were expressed in >75% of the cells in one daughter lineage and with expression, on average, fivefold brighter than in the sister lineage. We excluded cases where the expressing cells were inconsistent over time (e.g., autocorrelation with shift of one time point <0.5). The full list of lineage blocks generated by this procedure is available in Supplemental Table 5. For genes with replicates, this table also lists how many replicates passed the fivefold cutoff as well as a relaxed threefold cutoff.
We generated a supplemental poster, meant as a screening tool, which provides a compact representation of differential expression in each lineage. To select trees for the poster, we combined differential expression calls (based on Supplemental Table 5) with additional cases of potential differential expression identified by examining each gene's expression pattern in detail. The manually curated lineages include cases where the differential expression falls below the fivefold criterion used for Supplemental Table 5, but were observed in replicate embryos. In some cases, additional expression occurred outside of the displayed lineages, which can be visualized by viewing the full lineage trees. We note under each gene name what fraction of replicate embryos showed expression consistent with the embryo selected for the poster by visual inspection.
To calculate the significance of a–p bias across the data set, we generated 1000 randomized data set where the a–p status of each expressing lineage was randomly assigned. We calculated the fraction of genes with different levels of a–p bias (e.g., <10% anterior, 10%–20% anterior, etc.) in the real data set, calculated the expected frequency in each bin from the randomized data set and assessed significance with a χ2 test.
A lineage pattern is a binary description of expression in the progeny derived by n divisions of a given cell. For example, a cell could match any of four motifs at a depth of n = 1: 11 (both daughters express), 10 (only anterior daughter expresses), 01 (only posterior daughter expresses), and 00 (neither daughter expression). Alternatively, it could have a more complex pattern that doesn't match any of these motifs. Some of these complex patterns could match one of the 12 nondegenerate patterns with n = 2 (0001, 0010, 0100, 1000, 1010, 1001, 0110, 0101, 1110, 1101, 1011, 0111). For n = 3, there are 240 nondegenerate motifs.
In identifying over-represented lineage patterns, we used a more stringent definition of both expressing and nonexpressing lineages to avoid being biased by weakly expressing lineages fluctuating around the threshold for calling expression. For expressing lineages, we required >75% of branches to express with peak expression >4000 and 20% of the maximum for that embryo. For nonexpressing lineages, we required an average peak expression <2000 and measured expression in <25% of leaf cells. We assigned each lineage for each gene a 1-division, 2-division, and 3-division pattern, except in cases where some branches were not classified as either expressing or nonexpressing—these were classified as “complex” and not used for the statistical analysis. We calculated the significance of the 1-division patterns by comparing to random expectation with a χ2 test. For 2-division patterns, we compared with the frequency expected based on the observed 1-division patterns. For 3-division patterns, there are many more possible incoherent patterns than coherent patterns, so we compared the observed distribution of patterns with that expected if patterns were randomly chosen from the set of all possible patterns. We observed only 31 of the 240 possible 3-division patterns. We classified these as either degenerate (e.g., 00110011 is the same as 0101), partially degenerate (e.g., 00000101 is a 0101 lineage with a nonexpressing sister), coherent (all expression decisions on branches of the same polarity such as 01110111), or discordant (expression decisions on branches of opposite polarity). We observed a significant bias for concordant patterns (15 patterns observed 22 times) compared with discordant patterns (four patterns observed eight times) (P = 2 × 10⁻⁷).
Physical position
For each reporter embryo, we calculated the mean and standard deviation of the anterior–posterior patterns (relative to the anterior end) for all cells at all time points with instantaneous expression (expression in a particular cell at a single time point) >2000 and >10% of the maximum peak expression level for that embryo. Supplemental Table 6 includes a list of genes where expression was restricted to a restricted a–p region (SD, <8 microns) in at least one embryo.
L–R symmetry
We directly compared analogous cells from L–R symmetric lineages, as defined by Sulston et al. (1983). A reporter was considered to be asymmetric in a L–R pair of cells if it was expressed in one of the cells (peak >2000 and 10% of maximum) and if the peak expression level was at least 10-fold higher in one cell relative to its symmetric counterpart. A list of all such divisions, including the number of replicates passing this cutoff and the number passing a relaxed fivefold cutoff (for genes with at least one embryo passing the 10-fold cutoff) is available in Supplemental Table 7. We see this type of pattern for not only promoter::histone reporters, but also for the protein-fusion reporters; for example, ALR-1::GFP is strongly L–R asymmetric in multiple lineages, and UNC-130, LIN-39, MAB-5, and EGL-5 GFP fusions are all differentially expressed among cells of the same tissues. This indicates that these patterns are not likely to be transient events occurring only in precursors of the symmetric lineages.
Tissue
We calculated the correlation coefficient between an embryo's peak expression levels and a Boolean vector describing the mapping of each fate term (Hypodermis, Blast, Glia, Muscle, Intestine, Pharynx, and Other) onto the cell list. Figure 4A includes all genes for which the correlation coefficient exceeded 0.4.
RNAi experiments
For pop-1 RNAi, we used the pop-1 clone from a previously reported genomic library for RNAi by feeding as previously described (Kamath et al. 2003). We placed worms on the RNAi bacteria at the L4 stage and harvested embryos for imaging and lineage analysis 12–48 h later. To ensure that all analyzed embryos had reduced pop-1 activity, we only analyzed embryos with the previously characterized MS→E lineage transformation, a transformation that is easily scored because it results in clear early changes in MS lineage division timing. Even with this filter, we saw some variability in the extent of expression changes for a given gene after pop-1 RNAi, suggesting that penetrance of pop-1 phenotypes after RNAi varies stochastically between lineages or that knockdown or sensitivity to partial knockdown varies between lineages. Still, the results are informative given the consistency of wild-type patterns and the fact that when we did observe changes, they were consistent with a role of pop-1 in anterior repression and posterior activation. The full lineages of all pop-1 RNAi embryos are available in the EPIC database at http://waterston.gs.washington.edu/epic/. In the EMS and C lineages we observed cell division defects consistent with previous studies, including partial transformations of the anterior MS lineage to an E-like pattern (Lin et al. 1995) and the Caa and Cpa lineage to Cap- and Cpp-like patterns (Fukushige and Krause 2005).
Multidimensional analysis of expression
We scored each gene as correlated with the different dimensions using the criteria described above for each individual dimension using all replicates for a–p lineage bias and genes with more than half of any replicate embryos passing the threshold for analysis of symmetry and physical position. A gene with more than three expressing branches and >75% of its expression in either anterior or posterior branches was included in the a–p bias column.
Comparison with larval patterns
We obtained L1 larval expression data from Liu et al. (2009) (linear scale data from that study's Supplemental Table 4B) and aligned with our expression data. Alignment was done cell-by-cell: The 671 terminal cells for which we calculated peak expression levels correspond to the 558 cells present in the L1 larva plus 113 cell deaths. We excluded 195 cells for which Liu et al. (2009) did not report data and focused on the remaining 363 cells measured in both data sets.
Data access
The quantitative data are freely available for download at our Expression Patterns in C. elegans (EPIC) database (http://epic.gs.washington.edu/) and at WormBase. This website also provides an image browser for viewing the raw image data. All software programs (Embryo Database, AceTree, Starrynite) are freely available from our website at http://waterston.gs.washington.edu/tools.html.
Acknowledgments
We thank members of the Waterston laboratory, Priess laboratory, and Thomas laboratory for helpful discussions, and Stuart Kim, Meera Sundaram, and the anonymous reviewers for critical comments on the manuscript. We also thank Mihail Sarov, Anthony Hyman, and Stuart Kim for help in generating the protein fusion strains. We are grateful to Max Heiman, Anjon Audhya, and Stuart Kim for providing promoter reporter strains prior to publication. LaDeana Hillier helped with analysis of lin-26 spliced-leader reads. We thank Dan Mace and Louis Gewirtzman for the software used in the analysis of some data sets. J.I.M. was a fellow of the Jane Coffin Childs Memorial Fund for Medical Research. Z.B. was a Damon Runyon Fellow supported by a Damon Runyon Cancer Research Fellowship (DRG-1813-04). This work was supported by NIH grants to J.I.M., Z.B., and R.H.W.
Footnotes
[Supplemental material is available for this article.]
Article published online before print. Article, supplemental material, and publication date are at http://www.genome.org/cgi/doi/10.1101/gr.131920.111.
Freely available online through the Genome Research Open Access option.
References
- Ahringer J 1996. Posterior patterning by the Caenorhabditis elegans even-skipped homolog vab-7. Genes Dev 10: 1120–1130 [DOI] [PubMed] [Google Scholar]
- Allen MA, Hillier LW, Waterston RH, Blumenthal T 2011. A global analysis of C. elegans trans-splicing. Genome Res 21: 255–264 [DOI] [PMC free article] [PubMed] [Google Scholar]
- Bao Z, Murray JI, Boyle T, Ooi SL, Sandel MJ, Waterston RH 2006. Automated cell lineage tracing in Caenorhabditis elegans. Proc Natl Acad Sci 103: 2707–2712 [DOI] [PMC free article] [PubMed] [Google Scholar]
- Baugh LR, Hill AA, Claggett JM, Hill-Harfe K, Wen JC, Slonim DK, Brown EL, Hunter CP 2005. The homeodomain protein PAL-1 specifies a lineage-specific regulatory network in the C. elegans embryo. Development 132: 1843–1854 [DOI] [PubMed] [Google Scholar]
- Baumeister R, Liu Y, Ruvkun G 1996. Lineage-specific regulators couple cell lineage asymmetry to the transcription of the Caenorhabditis elegans POU gene unc-86 during neurogenesis. Genes Dev 10: 1395–1410 [DOI] [PubMed] [Google Scholar]
- Bertrand V, Hobert O 2009. Linking asymmetric cell division to the terminal differentiation program of postmitotic neurons in C. elegans. Dev Cell 16: 563–575 [DOI] [PMC free article] [PubMed] [Google Scholar]
- Bertrand V, Hobert O 2010. Lineage programming: Navigating through transient regulatory states via binary decisions. Curr Opin Genet Dev 20: 362–368 [DOI] [PMC free article] [PubMed] [Google Scholar]
- Bischoff M, Schnabel R 2006. Global cell sorting is mediated by local cell-cell interactions in the C. elegans embryo. Dev Biol 294: 432–444 [DOI] [PubMed] [Google Scholar]
- Boeck ME, Boyle T, Bao Z, Murray J, Mericle B, Waterston R 2011. Specific roles for the GATA transcription factors end-1 and end-3 during C. elegans E-lineage development. Dev Biol 358: 345–355 [DOI] [PMC free article] [PubMed] [Google Scholar]
- Boyle TJ, Bao Z, Murray JI, Araya CL, Waterston RH 2006. AceTree: A tool for visual analysis of Caenorhabditis elegans embryogenesis. BMC Bioinformatics 7: 275 doi: 10.1186/1471-2105-7-275 [DOI] [PMC free article] [PubMed] [Google Scholar]
- Broeks A, Janssen HW, Calafat J, Plasterk RH 1995. A P-glycoprotein protects Caenorhabditis elegans against natural toxins. EMBO J 14: 1858–1866 [DOI] [PMC free article] [PubMed] [Google Scholar]
- Broitman-Maduro G, Lin KT, Hung WW, Maduro MF 2006. Specification of the C. elegans MS blastomere by the T-box factor TBX-35. Development 133: 3097–3106 [DOI] [PubMed] [Google Scholar]
- Broitman-Maduro G, Owraghi M, Hung WW, Kuntz S, Sternberg PW, Maduro MF 2009. The NK-2 class homeodomain factor CEH-51 and the T-box factor TBX-35 have overlapping function in C. elegans mesoderm development. Development 136: 2735–2746 [DOI] [PMC free article] [PubMed] [Google Scholar]
- Celniker SE, Dillon LA, Gerstein MB, Gunsalus KC, Henikoff S, Karpen GH, Kellis M, Lai EC, Lieb JD, MacAlpine DM, et al. 2009. Unlocking the secrets of the genome. Nature 459: 927–930 [DOI] [PMC free article] [PubMed] [Google Scholar]
- Chang HY, Chi JT, Dudoit S, Bondre C, van de Rijn M, Botstein D, Brown PO 2002. Diversity, topographic differentiation, and positional memory in human fibroblasts. Proc Natl Acad Sci 99: 12877–12882 [DOI] [PMC free article] [PubMed] [Google Scholar]
- Cowing DW, Kenyon C 1992. Expression of the homeotic gene mab-5 during Caenorhabditis elegans embryogenesis. Development 116: 481–490 [DOI] [PubMed] [Google Scholar]
- Cowing D, Kenyon C 1996. Correct Hox gene expression established independently of position in Caenorhabditis elegans. Nature 382: 353–356 [DOI] [PubMed] [Google Scholar]
- de Hoon MJ, Imoto S, Nolan J, Miyano S 2004. Open source clustering software. Bioinformatics 20: 1453–1454 [DOI] [PubMed] [Google Scholar]
- Dozier C, Kagoshima H, Niklaus G, Cassata G, Burglin TR 2001. The Caenorhabditis elegans Six/sine oculis class homeobox gene ceh-32 is required for head morphogenesis. Dev Biol 236: 289–303 [DOI] [PubMed] [Google Scholar]
- Duggan A, Ma C, Chalfie M 1998. Regulation of touch receptor differentiation by the Caenorhabditis elegans mec-3 and unc-86 genes. Development 125: 4107–4119 [DOI] [PubMed] [Google Scholar]
- Dupuy D, Bertin N, Hidalgo CA, Venkatesan K, Tu D, Lee D, Rosenberg J, Svrzikapa N, Blanc A, Carnec A, et al. 2007. Genome-scale analysis of in vivo spatiotemporal promoter activity in Caenorhabditis elegans. Nat Biotechnol 25: 663–668 [DOI] [PubMed] [Google Scholar]
- Fowlkes CC, Hendriks CL, Keranen SV, Weber GH, Rubel O, Huang MY, Chatoor S, DePace AH, Simirenko L, Henriquez C, et al. 2008. A quantitative spatiotemporal atlas of gene expression in the Drosophila blastoderm. Cell 133: 364–374 [DOI] [PubMed] [Google Scholar]
- Fox RM, Von Stetina SE, Barlow SJ, Shaffer C, Olszewski KL, Moore JH, Dupuy D, Vidal M, Miller DM 3rd 2005. A gene expression fingerprint of C. elegans embryonic motor neurons. BMC Genomics 6: 42 doi: 10.1186/1471-2164-6-42 [DOI] [PMC free article] [PubMed] [Google Scholar]
- Fukushige T, Krause M 2005. The myogenic potency of HLH-1 reveals wide-spread developmental plasticity in early C. elegans embryos. Development 132: 1795–1805 [DOI] [PubMed] [Google Scholar]
- Fukushige T, Hawkins MG, McGhee JD 1998. The GATA-factor elt-2 is essential for formation of the Caenorhabditis elegans intestine. Dev Biol 198: 286–302 [PubMed] [Google Scholar]
- Gerstein MB, Lu ZJ, Van Nostrand EL, Cheng C, Arshinoff BI, Liu T, Yip KY, Robilotto R, Rechtsteiner A, Ikegami K, et al. 2010. Integrative analysis of the Caenorhabditis elegans genome by the modENCODE project. Science 330: 1775–1787 [DOI] [PMC free article] [PubMed] [Google Scholar]
- Gilleard JS, McGhee JD 2001. Activation of hypodermal differentiation in the Caenorhabditis elegans embryo by GATA transcription factors ELT-1 and ELT-3. Mol Cell Biol 21: 2533–2544 [DOI] [PMC free article] [PubMed] [Google Scholar]
- Good K, Ciosk R, Nance J, Neves A, Hill RJ, Priess JR 2004. The T-box transcription factors TBX-37 and TBX-38 link GLP-1/Notch signaling to mesoderm induction in C. elegans embryos. Development 131: 1967–1978 [DOI] [PubMed] [Google Scholar]
- Harris TW, Antoshechkin I, Bieri T, Blasiar D, Chan J, Chen WJ, De La Cruz N, Davis P, Duesbury M, Fang R, et al. 2009. WormBase: A comprehensive resource for nematode research. Nucleic Acids Res 38: D463–D467 [DOI] [PMC free article] [PubMed] [Google Scholar]
- Horner MA, Quintin S, Domeier ME, Kimble J, Labouesse M, Mango SE 1998. pha-4, an HNF-3 homolog, specifies pharyngeal organ identity in Caenorhabditis elegans. Genes Dev 12: 1947–1952 [DOI] [PMC free article] [PubMed] [Google Scholar]
- Huang S, Shetty P, Robertson SM, Lin R 2007. Binary cell fate specification during C. elegans embryogenesis driven by reiterated reciprocal asymmetry of TCF POP-1 and its coactivator β-catenin SYS-1. Development 134: 2685–2695 [DOI] [PubMed] [Google Scholar]
- Hunt-Newbury R, Viveiros R, Johnsen R, Mah A, Anastas D, Fang L, Halfnight E, Lee D, Lin J, Lorch A, et al. 2007. High-throughput in vivo analysis of gene expression in Caenorhabditis elegans. PLoS Biol 5: e237 doi: 10.1371/journal.pbio.0050237 [DOI] [PMC free article] [PubMed] [Google Scholar]
- Hunter CP, Kenyon C 1996. Spatial and temporal controls target pal-1 blastomere-specification activity to a single blastomere lineage in C. elegans embryos. Cell 87: 217–226 [DOI] [PubMed] [Google Scholar]
- Kalb JM, Lau KK, Goszczynski B, Fukushige T, Moons D, Okkema PG, McGhee JD 1998. pha-4 is Ce-fkh-1, a fork head/HNF-3α,β,γ homolog that functions in organogenesis of the C. elegans pharynx. Development 125: 2171–2180 [DOI] [PubMed] [Google Scholar]
- Kaletta T, Schnabel H, Schnabel R 1997. Binary specification of the embryonic lineage in Caenorhabditis elegans. Nature 390: 294–298 [DOI] [PubMed] [Google Scholar]
- Kamath RS, Fraser AG, Dong Y, Poulin G, Durbin R, Gotta M, Kanapin A, Le Bot N, Moreno S, Sohrmann M, et al. 2003. Systematic functional analysis of the Caenorhabditis elegans genome using RNAi. Nature 421: 231–237 [DOI] [PubMed] [Google Scholar]
- Krause M 1995. MyoD and myogenesis in C. elegans. Bioessays 17: 219–228 [DOI] [PubMed] [Google Scholar]
- Lam N, Chesney MA, Kimble J 2006. Wnt signaling and CEH-22/tinman/Nkx2.5 specify a stem cell niche in C. elegans. Curr Biol 16: 287–295 [DOI] [PMC free article] [PubMed] [Google Scholar]
- Li XY, MacArthur S, Bourgon R, Nix D, Pollard DA, Iyer VN, Hechmer A, Simirenko L, Stapleton M, Luengo Hendriks CL, et al. 2008. Transcription factors bind thousands of active and inactive regions in the Drosophila blastoderm. PLoS Biol 6: e27 doi: 10.1371/journal.pbio.0060027 [DOI] [PMC free article] [PubMed] [Google Scholar]
- Lin R, Thompson S, Priess JR 1995. pop-1 encodes an HMG box protein required for the specification of a mesoderm precursor in early C. elegans embryos. Cell 83: 599–609 [DOI] [PubMed] [Google Scholar]
- Lin R, Hill RJ, Priess JR 1998. POP-1 and anterior-posterior fate decisions in C. elegans embryos. Cell 92: 229–239 [DOI] [PubMed] [Google Scholar]
- Liu X, Brutlag DL, Liu JS 2001. BioProspector: Discovering conserved DNA motifs in upstream regulatory regions of co-expressed genes. Pac Symp Biocomput 6: 127–138 [PubMed] [Google Scholar]
- Liu X, Long F, Peng H, Aerni SJ, Jiang M, Sanchez-Blanco A, Murray JI, Preston E, Mericle B, Batzoglou S, et al. 2009. Analysis of cell fate from single-cell gene expression profiles in C. elegans. Cell 139: 623–633 [DOI] [PMC free article] [PubMed] [Google Scholar]
- Maduro MF, Rothman JH 2002. Making worm guts: The gene regulatory network of the Caenorhabditis elegans endoderm. Dev Biol 246: 68–85 [DOI] [PubMed] [Google Scholar]
- Maduro MF, Hill RJ, Heid PJ, Newman-Smith ED, Zhu J, Priess JR, Rothman JH 2005a. Genetic redundancy in endoderm specification within the genus Caenorhabditis. Dev Biol 284: 509–522 [DOI] [PubMed] [Google Scholar]
- Maduro MF, Kasmir JJ, Zhu J, Rothman JH 2005b. The Wnt effector POP-1 and the PAL-1/Caudal homeoprotein collaborate with SKN-1 to activate C. elegans endoderm development. Dev Biol 285: 510–523 [DOI] [PubMed] [Google Scholar]
- Martinez NJ, Ow MC, Reece-Hoyes JS, Barrasa MI, Ambros VR, Walhout AJ 2008. Genome-scale spatiotemporal analysis of Caenorhabditis elegans microRNA promoter activity. Genome Res 18: 2005–2015 [DOI] [PMC free article] [PubMed] [Google Scholar]
- Merritt C, Rasoloson D, Ko D, Seydoux G 2008. 3′ UTRs are the primary regulators of gene expression in the C. elegans germline. Curr Biol 18: 1476–1482 [DOI] [PMC free article] [PubMed] [Google Scholar]
- Murray JI, Bao Z, Boyle T, Waterston RH 2006. The lineaging of fluorescently-labeled Caenorhabditis elegans embryos with StarryNite and AceTree. Nat Protoc 1: 1468–1476 [DOI] [PubMed] [Google Scholar]
- Murray JI, Bao Z, Boyle TJ, Boeck ME, Mericle BL, Nicholas TJ, Zhao Z, Sandel MJ, Waterston RH 2008. Automated analysis of embryonic gene expression with cellular resolution in C. elegans. Nat Methods 5: 703–709 [DOI] [PMC free article] [PubMed] [Google Scholar]
- Nakano S, Ellis RE, Horvitz HR 2010. Otx-dependent expression of proneural bHLH genes establishes a neuronal bilateral asymmetry in C. elegans. Development 137: 4017–4027 [DOI] [PMC free article] [PubMed] [Google Scholar]
- Neves A, Priess JR 2005. The REF-1 family of bHLH transcription factors pattern C. elegans embryos through Notch-dependent and Notch-independent pathways. Dev Cell 8: 867–879 [DOI] [PubMed] [Google Scholar]
- Newman-Smith ED, Rothman JH 1998. The maternal-to-zygotic transition in embryonic patterning of Caenorhabditis elegans. Curr Opin Genet Dev 8: 472–480 [DOI] [PubMed] [Google Scholar]
- Park FD, Priess JR 2003. Establishment of POP-1 asymmetry in early C. elegans embryos. Development 130: 3547–3556 [DOI] [PubMed] [Google Scholar]
- Phillips BT, Kidd AR III, King R, Hardin J, Kimble J 2007. Reciprocal asymmetry of SYS-1/β-catenin and POP-1/TCF controls asymmetric divisions in Caenorhabditis elegans. Proc Natl Acad Sci 104: 3231–3236 [DOI] [PMC free article] [PubMed] [Google Scholar]
- Pierce-Shimomura JT, Faumont S, Gaston MR, Pearson BJ, Lockery SR 2001. The homeobox gene lim-6 is required for distinct chemosensory representations in C. elegans. Nature 410: 694–698 [DOI] [PubMed] [Google Scholar]
- Poole RJ, Hobert O 2006. Early embryonic programming of neuronal left/right asymmetry in C. elegans. Curr Biol 16: 2279–2292 [DOI] [PubMed] [Google Scholar]
- Portales-Casamar E, Thongjuea S, Kwon AT, Arenillas D, Zhao X, Valen E, Yusuf D, Lenhard B, Wasserman WW, Sandelin A 2010. JASPAR 2010: The greatly expanded open-access database of transcription factor binding profiles. Nucleic Acids Res 38: D105–D110 [DOI] [PMC free article] [PubMed] [Google Scholar]
- Praitis V, Casey E, Collar D, Austin J 2001. Creation of low-copy integrated transgenic lines in Caenorhabditis elegans. Genetics 157: 1217–1226 [DOI] [PMC free article] [PubMed] [Google Scholar]
- Priess JR 2005. Notch signaling in the C. elegans embryo. In WormBook (ed. The C. elegans Research Community), doi: 10.1895/wormbook.1.4.1. http://www.wormbook.org [DOI] [PMC free article] [PubMed]
- Reece-Hoyes JS, Deplancke B, Shingles J, Grove CA, Hope IA, Walhout AJ 2005. A compendium of Caenorhabditis elegans regulatory transcription factors: A resource for mapping transcription regulatory networks. Genome Biol 6: R110 doi: 10.1186/gb-2005-6-13-r110 [DOI] [PMC free article] [PubMed] [Google Scholar]
- Reece-Hoyes JS, Shingles J, Dupuy D, Grove CA, Walhout AJ, Vidal M, Hope IA 2007. Insight into transcription factor gene duplication from Caenorhabditis elegans Promoterome-driven expression patterns. BMC Genomics 8: 27 doi: 10.1186/1471-2164-8-27 [DOI] [PMC free article] [PubMed] [Google Scholar]
- Rozen S, Skaletsky HJ 2000. Primer3 on the WWW for general users and for biologist programmers. In Bioinformatics methods and protocols: Methods in molecular biology (ed. S Krawetz, S Misener), pp. 365–386. Humana, Totowa, NJ. [Google Scholar]
- Saldanha AJ 2004. Java Treeview–extensible visualization of microarray data. Bioinformatics 20: 3246–3248 [DOI] [PubMed] [Google Scholar]
- Sarin S, Antonio C, Tursun B, Hobert O 2009. The C. elegans Tailless/TLX transcription factor nhr-67 controls neuronal identity and left/right asymmetric fate diversification. Development 136: 2933–2944 [DOI] [PMC free article] [PubMed] [Google Scholar]
- Sarov M, Schneider S, Pozniakovski A, Roguev A, Ernst S, Zhang Y, Hyman AA, Stewart AF 2006. A recombineering pipeline for functional genomics applied to Caenorhabditis elegans. Nat Methods 3: 839–844 [DOI] [PubMed] [Google Scholar]
- Sarov M, Murray J, Schanze K, Pozniakovski A, Niu W, Angermann K, Hasse S, Rupprecht M, Vinis E, Tinney M, et al. 2012. The TransgeneOme of C. elegans: A platform for protein centric systems biology. Cell (in press). [DOI] [PMC free article] [PubMed] [Google Scholar]
- Schnabel R, Bischoff M, Hintze A, Schulz AK, Hejnol A, Meinhardt H, Hutter H 2006. Global cell sorting in the C. elegans embryo defines a new mechanism for pattern formation. Dev Biol 294: 418–431 [DOI] [PubMed] [Google Scholar]
- Sulston JE, Schierenberg E, White JG, Thomson JN 1983. The embryonic cell lineage of the nematode Caenorhabditis elegans. Dev Biol 100: 64–119 [DOI] [PubMed] [Google Scholar]
- Tomancak P, Beaton A, Weiszmann R, Kwan E, Shu S, Lewis SE, Richards S, Ashburner M, Hartenstein V, Celniker SE et al. 2002. Systematic determination of patterns of gene expression during Drosophila embryogenesis. Genome Biol 3: RESEARCH0088 doi: 10.1186/gb-2002-3-12-research0088 [DOI] [PMC free article] [PubMed] [Google Scholar]
- Tucker M, Sieber M, Morphew M, Han M 2005. The Caenorhabditis elegans aristaless orthologue, alr-1, is required for maintaining the functional and structural integrity of the amphid sensory organs. Mol Biol Cell 16: 4695–4704 [DOI] [PMC free article] [PubMed] [Google Scholar]
- Wang L, Way JC 1996. Activation of the mec-3 promoter in two classes of stereotyped lineages in Caenorhabditis elegans. Mech Dev 56: 165–181 [DOI] [PubMed] [Google Scholar]
- Wang BB, Muller-Immergluck MM, Austin J, Robinson NT, Chisholm A, Kenyon C 1993. A homeotic gene cluster patterns the anteroposterior body axis of C. elegans. Cell 74: 29–42 [DOI] [PubMed] [Google Scholar]
- Way JC, Chalfie M 1988. mec-3, a homeobox-containing gene that specifies differentiation of the touch receptor neurons in C. elegans. Cell 54: 5–16 [DOI] [PubMed] [Google Scholar]
- Way JC, Run JQ, Wang AY 1992. Regulation of anterior cell-specific mec-3 expression during asymmetric cell division in C. elegans. Dev Dyn 194: 289–302 [DOI] [PubMed] [Google Scholar]
- Yoda A, Kouike H, Okano H, Sawa H 2005. Components of the transcriptional Mediator complex are required for asymmetric cell division in C. elegans. Development 132: 1885–1893 [DOI] [PubMed] [Google Scholar]
- Zhong M, Niu W, Lu ZJ, Sarov M, Murray JI, Janette J, Raha D, Sheaffer KL, Lam HY, Preston E, et al. 2010. Genome-wide identification of binding sites defines distinct functions for Caenorhabditis elegans PHA-4/FOXA in development and environmental response. PLoS Genet 6: e1000848 doi: 10.1371/journal.pgen.1000848 [DOI] [PMC free article] [PubMed] [Google Scholar]
- Zhu J, Hill RJ, Heid PJ, Fukuyama M, Sugimoto A, Priess JR, Rothman JH 1997. end-1 encodes an apparent GATA factor that specifies the endoderm precursor in Caenorhabditis elegans embryos. Genes Dev 11: 2883–2896 [DOI] [PMC free article] [PubMed] [Google Scholar]