

Abstract
It has been difficult to determine how cognitive systems change over the grand time scale of an entire life, as few cognitive systems are well enough understood; observable in infants, adolescents, and adults; and simple enough to measure to empower comparisons across vastly different ages. Here we address this challenge with data from more than 10,000 participants ranging from 11 to 85 years of age and investigate the precision of basic numerical intuitions and their relation to students’ performance in school mathematics across the lifespan. We all share a foundational number sense that has been observed in adults, infants, and nonhuman animals, and that, in humans, is generated by neurons in the intraparietal sulcus. Individual differences in the precision of this evolutionarily ancient number sense may impact school mathematics performance in children; however, we know little of its role beyond childhood. Here we find that population trends suggest that the precision of one’s number sense improves throughout the school-age years, peaking quite late at ∼30 y. Despite this gradual developmental improvement, we find very large individual differences in number sense precision among people of the same age, and these differences relate to school mathematical performance throughout adolescence and the adult years. The large individual differences and prolonged development of number sense, paired with its consistent and specific link to mathematics ability across the age span, hold promise for the impact of educational interventions that target the number sense.
Keywords: aging, analog magnitude, approximate number system, cognitive development, ensemble representation
Although the particulars of our minds may differ from person to person, some aspects of cognition are close to our core—they are universally shared, present in the young, and actively engaged throughout our lifetimes (1, 2). Investigating developmental changes in these core systems may present us with a picture of how the mind transforms from infancy to senescence. Here we investigated change in the approximate number system (ANS), the cognitive system that gives rise to our basic numerical intuitions (3). The ANS generates nonverbal representations of numerosity in nonhuman animals (4, 5), infants (6, 7), school-aged children (8–10), and adults from mathematically fluent cultures (11, 12) as well as cultures that do not practice explicit mathematics (13, 14). In humans, imaging results suggest that these basic intuitions are supported by neurons in the intraparietal sulcus (15–18), a role that can be observed shortly after birth (19). Given the phylogenetically widespread occurrence of this primitive cognitive resource, the ANS might make little or no contact with the formal mathematical abilities that humans struggle to master and that no other animals acquire (20). Alternatively, this system may be a critical foundation upon which formal mathematical abilities are constructed (21, 22). Although some evidence suggests a link between the ANS and formal mathematics in children (22–25), two fundamental questions remain regarding (i) how the precision of ANS representation transforms during the lifespan and (ii) whether there is a relationship between the ANS and more formal mathematical abilities beyond the school-age years, long after formal mathematical abilities have been acquired. We present evidence from more than 10,000 individuals between 11 and 85 years of age and identify developmental changes in the precision of the ANS, and a stable, modest relationship between ANS precision and school mathematics ability across the lifespan.
Measuring the precision of the number sense can be accomplished by modeling subjects’ performance on the simple intuitive task of judging which of two arrays of dots is more numerous (the reader can experience this task, receive an estimate of the precision of their number sense, and see how they stack up relative to the population at http://panamath.org/). We posted a brief version of this ANS dots test online (http://www.testmybrain.org/) and, over the course of 3 mo, more than 10,000 people from around the world freely chose to visit the page and assess their own number sense. Before taking this ANS dots test, participants filled out a questionnaire agreeing to participate, and reported on their age and their own internal sense of how well they performed relative to their peers in a variety of school subjects (e.g., school mathematics, science, writing, etc.). Previous results have demonstrated the reliability of Web-based samples, the efficacy of Web-based recruiting, and the convergence of Web-based and laboratory-based estimates of psychological performance metrics (26–30). For example, Web-based samples have recently been used to reveal cross-cultural universals in circadian rhythms as well as individual differences (31), and changes in cognitive abilities across the lifespan (29). Ultimately, Internet testing allowed us to recruit a larger and more diverse sample than would have been practically feasible in a laboratory setting (further discussion is provided in Methods and SI Appendix).
Results and Discussion
On each of 300 trials of the ANS dots test (∼8 min testing time), yellow and blue dots briefly flashed on the screen, and the participant reported whether there were more blue or more yellow dots. This judgment is easy with large numerical differences (e.g., seven blue vs. 14 yellow), but becomes more difficult when the ratio of blue to yellow dots is close (e.g., eight blue vs. seven yellow; Fig. 1). By varying this ratio across trials, it is possible to determine the precision of an individual’s ANS. This precision can be indexed by a Weber fraction (w) and an average response time (RT) on the ANS dots test. Estimates of w and RT from the ANS dots test were reliable despite the brevity of the assessment (Spearman–Brown corrected split-half reliability w relsb = 0.72; RT relsb = 0.98). w and RT scores were largely uncorrelated (r = −0.11), suggesting that they may index independent abilities. w is an estimate of the internal noise, or confusability, of an individual’s ANS number representations, and RT is the amount of time an individual takes to make their decision. A person with a more precise ANS will make faster and more accurate number decisions on the ANS dots test, whereas a person with a “noisier,” more variable ANS will perform more poorly and take a longer time to answer, often feeling that they are unsure whether there were more blue or more yellow dots.
Fig. 1.

Method. (A) A trial from the ANS dots test in which it is easier to tell that there are more yellow than blue dots with a brief glance. (B) A trial from the ANS dots test in which it is more challenging to tell that there are bluer than yellow dots with a brief glance.
Fig. 2A displays ANS precision (w, RT) and self-reported school mathematics ability (N = 10,548) from experiment 1—each person is represented by a dot, with the color of their dot indexing their self-reported school mathematics ability and the position of their dot indexing their w and RT scores on the ANS dots test. The diamond and circle insets were chosen to fall along the diagonal and their expansion appears at the top of Fig. 2A (magnification of ×7). Although the scatterplot of Fig. 2A displays the data in a raw form, the diamond and circle magnifications suggest that participants with better ANS precision (i.e., faster RT and lower w; Fig. 2A, diamond) tended to report being better in school mathematics relative to their peers (i.e., Fig. 2A, red/magenta) whereas participants with poorer ANS precision (i.e., slower RT and higher w; Fig. 2A, circle) tended to report being worse in school mathematics relative to their peers (i.e., variously colored, including many cyan/green; Fig. 2A). We explored these possible trends in detail.
Fig. 2.

Group performance. (A) Scatterplot of self-reported school mathematics ability raw score as a function of ANS precision (w, RT) across all ages (N = 10,548). Insets: Diamond and circle, magnifications of ×7 of small, uncrowded regions along the diagonal. The color differences within these insets, and similarly, any other positions along a diagonal in the image, suggest that participants in the lower left (i.e., better ANS performance with lower RT and lower w; diamond) tended to report being better in school mathematics (i.e., red/magenta) whereas participants in the upper right (i.e., poorer ANS performance with higher RT and higher w; circle) tended to report being worse in school mathematics relative to their peers (i.e., variously colored, including many cyan/green). (B) Decile plot of mathematics ability averages for each w/RT decile pair constructed by placing the highest and lowest averages at the extreme color values (i.e., red, yellow) and allowing the remaining averages to fall between these on a linear scale. (C) Ten decile plots of mathematics ability for each age group from Table 1 constructed by placing the highest and lowest averages in each group at the extreme color values (i.e., red, yellow) and allowing the remaining averages to fall between these on a linear scale; e.g., first age decile plotted as graph 1.
The large size of our sample allowed us to investigate the presence and stability of the relationship between ANS precision (w, RT) and school mathematics ability across ages (11–85 y). In the most basic analysis, a linear regression that included w and RT as predictors revealed that ANS precision (w, RT) significantly correlated with self-reported school mathematics ability collapsing across ages (Table 1). Next, dividing subjects into 10 roughly equal age deciles and performing this linear regression within each age group revealed that ANS precision (w, RT) significantly correlated with self-reported school mathematics ability (Table 1) across the age span, and the r values for w and RT remained fairly stable, suggesting that ANS precision (w, RT) and self-reported school mathematics ability were related across ages (an alternative depiction of this result using β-weights is provided in Fig. S1). We further investigated the stability of this relationship by controlling for age and running a linear regression relating mathematics ability to ANS precision (w, RT). Our sample size allowed us to subtract each age’s mean score from the individual scores within that age, creating age-controlled residuals without having to model any age-related curve (a powerful approach that avoids the vagaries of model selection). This approach revealed that ANS precision (w, RT) and school mathematics ability related irrespective of age (w, P < 1 × 10−89; RT, P < 1 × 10⁻²¹; w and RT, r = −0.21). These results suggest that a modest but consistent relationship between a brief assessment of ANS precision and an answer to a single self-reported query of school mathematics performance relative to peers is observable during the school years and remains observable throughout our entire lives, well after having completed formal schooling (e.g., age 85 y).
Table 1.
Correlations of self-reported school mathematics ability and ANS precision
|
r/relsb*/P value† |
||||
| Age group | No. of pts. | w | RT | w and RT |
| All subjects | 10,548 | −0.19/0.72/7.3 × 10−83 | −0.09/0.98/3.1 × 10−21 | −0.22/0.77/1.5 × 10−111 |
| 11–17 y (1st decile) | 994 | −0.13/0.73/3.5 × 10−5 | −0.11/0.98/5.4 × 10−4 | −0.19/0.74/1.9 × 10−8 |
| 18–20 y (2nd decile) | 1,267 | −0.21/0.74/5.4 × 10−14 | −0.04/0.98/1.1 × 10−1 | −0.22/0.75/7.0 × 10−15 |
| 21–22 y (3rd decile) | 919 | −0.19/0.70/5.5 × 10−9 | −0.09/0.98/7.0 × 10−3 | −0.23/0.73/3.3 × 10−11 |
| 23–24 y (4th decile) | 1,017 | −0.19/0.72/6.4 × 10−10 | −0.06/0.98/5.8 × 10−2 | −0.21/0.75/8.7 × 10−11 |
| 25–26 y (5th decile) | 1,013 | −0.23/0.70/5.6 × 10−14 | −0.08/0.98/7.1 × 10−3 | −0.26/0.74/1.7 × 10−16 |
| 27–28 y (6th decile) | 868 | −0.17/0.71/9.2 × 10−7 | −0.05/0.98/1.4 × 10−1 | −0.18/0.76/5.7 × 10−7 |
| 29–32 y (7th decile) | 1,310 | −0.19/0.69/1.4 × 10−12 | −0.04/0.98/1.8 × 10−1 | −0.20/0.76/1.6 × 10−12 |
| 33–37 y (8th decile) | 1,066 | −0.14/0.69/2.8 × 10−6 | −0.05/0.98/7.4 × 10−2 | −0.15/0.77/2.9 × 10−6 |
| 38–44 y (9th decile) | 991 | −0.20/0.70/2.2 × 10−10 | −0.07/0.98/3.6 × 10−2 | −0.21/0.78/7.8 × 10−11 |
| 45–85 y (10th decile) | 1,103 | −0.20/0.69/5.8 × 10−11 | −0.11/0.99/2.4 × 10−4 | −0.23/0.79/2.0 × 10−13 |
*Mean Spearman–Brown corrected split-half reliability. This mean was calculated across 75 separate, randomly determined splits of the data into two halves. The SD across splits was <0.02.
†P value indicates the significance of r.
Traditional laboratory-based psychological research typically involves homogenous samples of tens of people (e.g., a small group of American undergraduates) (32). Gathering large data sets from a varied population may become more common, as the internet allows scientists to engage ever larger groups (31). The diamond and circle magnifications in Fig. 2A (magnifications of ×7 of small uncrowded regions of the scatterplot) reveal the performance from more than 80 individuals. Large datasets of 10,000 individuals offer the reader an opportunity to interact with information in new ways, and interactive data plots (Movies S1 and S2) allow the reader to explore patterns on their own.
To see patterns, one can also adopt the model-neutral approach of displaying averages of school mathematics ability for groups of subjects who share similar ANS precision (e.g., w and RT deciles). In Fig. 2B, we have determined the decile position for each person based on their w and RT scores and computed an average mathematics ability score for each w/RT decile pair (this is roughly equivalent to laying a 10 × 10 grid on top of Fig. 2A and computing the average mathematics ability score inside each cell). The resulting Fig. 2B shows the population trend as a gradient from better mathematics ability and better ANS precision (Fig. 2B, red corner in lower left) to poorer mathematics ability and poorer ANS precision (Fig. 2B, yellow-green corner in upper right). These decile averages can also be viewed across age. In Fig. 2C we display the decile plots for each of the age decile groups, also summarized in Table 1. Although somewhat noisier than the overall decile plot (Fig. 2B), a color gradient from better school mathematics performance in the bottom left corner toward poorer school mathematics performance in the top right corner remains visible and significant in each of these plots (results of significance tests are shown in Table 1). This reveals a relationship between ANS precision (w, RT) and mathematics ability that is consistent across the age span. Movies S1 and S2 show interactive displays of this age trend.
To test the robustness and specificity of the observed relationship between ANS precision (w, RT) and school mathematics ability, we controlled for other cognitive abilities indexed by the self-report questionnaire. One might expect that school mathematics ability would be highly correlated with school science ability and, indeed, this was the case in our sample (r = 0.642 ± 0.011; P < 1 × 10−90). Despite this relationship, a linear regression of ANS precision (w, RT) and school mathematics ability controlling for school science ability, school writing ability, computer proficiency relative to peers, age, and sex returned coefficients for both w and RT that remained highly significant (both P < 1 × 10−65; w and RT, r = −0.17), suggesting a specific relationship between ANS precision (w, RT) and school mathematics ability across ages.
To test the reproducibility of this relationship, we conducted a second Web-based experiment in which a new sample of 3,006 participants (ages 11–85 y) completed both a questionnaire and a briefer 200-trial ANS dots test (∼5 min). Expectedly, estimates of w and RT were less reliable as a result of the brevity of this assessment (Spearman–Brown corrected split-half reliability w relsb = 0.56; RT relsb = 0.98). Despite this added measurement noise and a smaller sample size, the relationship between ANS precision (w, RT) and self-reported school mathematics ability was clearly present (w, P = 1.07 × 10⁻¹³; RT, P = 3.17 × 10⁻¹²; w and RT, r = −0.13), and coefficients for w and RT remained significant when controlling for school science ability, school writing ability, computer proficiency relative to peers, age, and sex (w, P = 4.8 × 10⁻⁹; RT, P = 2.6 × 10⁻⁵; w and RT, r = −0.13).
Although the relationship between ANS precision (w, RT) and self-reported school mathematics ability is consistent and holds across the lifespan, one may be concerned that self-report may not be an accurate estimate of formal school mathematics ability. To add a more standardized estimate of these abilities, a new entry on the questionnaire for this second experiment asked participants to report their scores on the mathematics (i.e., quantitative) and verbal subtests of the SAT, the most widely used standardized examination for gaining entry to US colleges (33). A subgroup of participants reported their scores (n = 458) and their level of confidence in their memory for their scores before taking the ANS dots test. Participants’ scores on the quantitative subtest of the SAT correlated with their self-reported mathematics ability (r = 0.67; additional SAT/questionnaire relationships that help validate the questionnaire measures are provided in Tables S1 and S2). Replicating the results from the self-report measure, individuals with a more precise ANS (w, RT) tended to report higher scores on the quantitative subtest of the SAT (w, P = 2.88 × 10⁻⁵; RT, P = 2.6 × 10⁻³; w and RT, r = −0.24) but not on the verbal subtest of the SAT (w, P = 0.11; RT, P = 0.34; w and RT, r = −0.09). This relationship held across all levels of confidence in the remembered scores, and the relationship between ANS precision (w, RT) and the quantitative subtest of the SAT remained significant when controlling for performance on the verbal subtest of the SAT (w, P = 2.2 × 10⁻⁴; RT, P = 4.9 × 10⁻³; w and RT, r = −0.22), ruling out general IQ as a mediating factor and controlling for previously reported associations between IQ and various RT measures (34, 35) (extended analyses showing unique contributions of w and RT are shown in Table S3). Similar effects have recently been found using official college transcripts (36) and in-lab mathematical tests (37), further validating the findings from this internet-based sample. These results suggest a specific relationship between ANS precision (w, RT) and school mathematics ability that is observable in nationally standardized tests of scholastic achievement.
The identified modest yet stable relationship between our intuitive sense of number (i.e., the ANS) and our more formal mathematical abilities across the age span (i.e., 11–85 y) helps to motivate an investigation into the developmental changes in these abilities during these years. One possibility, untested by the present study, is that the ANS may serve as a foundational intuitive workspace for building confidence concerning mathematical transformations, a confidence that may carry over throughout more formal mathematical learning.
Acquiring large heterogenous samples via the internet creates the opportunity to investigate developmental change across the lifespan. The present data reveal changes in w, RT, and self-reported mathematics ability across ages. Population trends reveal three dominant transitions in ANS precision (w, RT) across the age span with a rapid decrease in RT from 11 to 16 y of age, continued improvements in w from 16 to 30 y of age, and a sustained age-related decline in ANS precision (w, RT) from 30 to 85 y of age (Fig. 3). The initially high w scores at younger ages indicate noisier ANS representations that are gradually refined during the school-age years, with optimal precision (e.g., lowest w) attained surprisingly late in life at ∼30 y of age (Fig. 3). Most other cognitive abilities, with the notable exception of face recognition ability (29), appear to peak earlier. This extends previous studies, which suggested developmental changes in w in smaller laboratory-based samples (9, 10). The large overlap among interdecile ranges across the lifespan (Fig. 3, black bars) indicates that, even after developmental improvements, individual differences in w and RT remain large. For example, one adult in eight has a number sense that is less precise (i.e., a larger w and slower RT) than a typical 11-y-old child’s, indicating that a wide range of ages may stand to benefit from interventions designed to improve ANS precision.
Fig. 3.

Developmental changes. (A and B) w and RT (in ms) population trends computed as weighted cubic spline fit to w and RT means (blue lines) and interdecile ranges (10th to 90th; black vertical bars).
Developmental change across the lifespan is more easily experienced in dynamic graphs in which age is displayed across time. These developmental transitions are illustrated in the interactive scatterplot in Movie S1.
Success in school mathematics, and our performance in mathematics throughout our adult lives, emerges from many factors. The present findings suggest that one such cognitive component is the precision of the ANS, but this in no way implies that a person’s precision is immutable or is determined from birth. Indeed, the encouragingly protracted course of developmental change in ANS precision and the large individual differences across the lifespan raise the possibility of interventions to improve number sense across a range of ages.
Understanding how mental abilities change over the course of an entire life is a formidable challenge. One important approach has been to examine change longitudinally, following an individual person through maturation and changes in experience. However, the labor required for such studies is nearly prohibitive if one wishes to characterize change over the course of a full >70-y lifetime. Measuring abilities in tens of thousands of people across various ages throughout development is a complementary approach, and access to the enormous and varied population that uses the Internet holds great promise. Here, we measured the precision of the number sense in more than 10,000 individuals and present a picture of dramatic changes in this system of core cognition and its modest but highly stable and specific relationship with self-reported school mathematics performance across the lifespan.
Methods
Visitors freely navigated to the Web site www.testmybrain.org to participate in various psychological tests and chose the ANS number task. After self-reported school abilities were assessed by questionnaire, ANS precision was assessed with a version of the ANS dots test (current versions available at http://panamath.org/). In the versions of the ANS test presented here, participants were shown brief displays (200 ms) of intermixed blue and yellow dots with five to 20 dots per color and judged whether there were more blue dots or more yellow dots in each display. Stimuli were generated by using parameters described elsewhere (23). Our Web interface allowed us to record accuracy and RT on each trial within an error of ±15 ms. Individual trials with RTs longer than 4 s were excluded to control for inattention. In experiment 1, 10,590 unique participants completed the questionnaire and ANS dots test, 42 of whom were excluded from our final sample because their w deviated from the population mean by more than four SDs (w and RT scores were roughly normally distributed; Fig. S2). All results remain similar and significant if these subjects are retained, but w scores can run off toward infinity with poor performance and likely do not reflect true abilities (e.g., random guessing). In experiment 2, 3,033 unique participants completed the questionnaire and ANS dots test, 27 of whom were excluded from our final sample because their w deviated from the population mean by more than four SDs. Percent correct on the ANS test as a function of ratio was modeled for each individual subject as 1 minus error rate, with error rate defined in Eq. 1 in which “erfc” represents the complimentary error function:
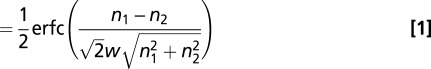 |
This model determines the amount of error in the underlying approximate number representations for the two sets displayed on a trial (n1 and n2, i.e., blue dots and yellow dots), specified by a single free parameter, w. Correlations presented were between this estimate of ANS precision (i.e., w), average RT, self-reported school abilities, and scholastic achievement scores (i.e., SAT).
Concerning our use of a Web-based sample, data collected from Web-based samples have been found to be trustworthy estimates of true abilities, given appropriate subject filtering methods as were used in the present study (26–28). Data collected from www.testmybrain.org, in particular, have been found to be highly reliable (30); to yield laboratory-replicated developmental, aging, and individual differences effects (29, 30, 38, 39); and to be comparable to data gathered in traditional laboratory-based samples on performance-related metrics (30, 39).
Supplementary Material
Acknowledgments
Methods development in this work was supported by National Science Foundation Grant DRL0937675 (to J.H.); and testing, analysis, and writing were supported by Grant EY-013602 (to K.N.), a Brachman--Hoffman Fellowship (to J.B.W.), and National Institutes of Health Grant HD057258 (to J.H.).
Footnotes
The authors declare no conflict of interest.
This article is a PNAS Direct Submission.
This article contains supporting information online at www.pnas.org/lookup/suppl/doi:10.1073/pnas.1200196109/-/DCSupplemental.
References
- 1.Spelke ES, Kinzler KD. Core knowledge. Dev Sci. 2007;10:89–96. doi: 10.1111/j.1467-7687.2007.00569.x. [DOI] [PubMed] [Google Scholar]
- 2.Carey S. The Origin of Concepts. New York: Oxford Univ Press; 2009. [Google Scholar]
- 3.Dehaene S. The Number Sense: How the Mind Creates Mathematics. New York: Oxford Univ Press; 1997. [Google Scholar]
- 4.Gallistel CR. Animal cognition: The representation of space, time and number. Annu Rev Psychol. 1989;40:155–189. doi: 10.1146/annurev.ps.40.020189.001103. [DOI] [PubMed] [Google Scholar]
- 5.Dehaene S, Dehaene-Lambertz G, Cohen L. Abstract representations of numbers in the animal and human brain. Trends Neurosci. 1998;21:355–361. doi: 10.1016/s0166-2236(98)01263-6. [DOI] [PubMed] [Google Scholar]
- 6.Libertus ME, Brannon EM. Behavioral and neural basis of number sense in infancy. Curr Dir Psychol Sci. 2009;18:346–351. doi: 10.1111/j.1467-8721.2009.01665.x. [DOI] [PMC free article] [PubMed] [Google Scholar]
- 7.Izard V, Sann C, Spelke ES, Streri A. Newborn infants perceive abstract numbers. Proc Natl Acad Sci USA. 2009;106:10382–10385. doi: 10.1073/pnas.0812142106. [DOI] [PMC free article] [PubMed] [Google Scholar]
- 8.Hubbard EM, et al. The evolution of numerical cognition: From number neurons to linguistic quantifiers. J Neurosci. 2008;28:11819–11824. doi: 10.1523/JNEUROSCI.3808-08.2008. [DOI] [PMC free article] [PubMed] [Google Scholar]
- 9.Halberda J, Feigenson L. Developmental change in the acuity of the “number sense”: The Approximate Number System in 3-, 4-, 5-, and 6-year-olds and adults. Dev Psychol. 2008;44:1457–1465. doi: 10.1037/a0012682. [DOI] [PubMed] [Google Scholar]
- 10.Piazza M, et al. Developmental trajectory of number acuity reveals a severe impairment in developmental dyscalculia. Cognition. 2010;116:33–41. doi: 10.1016/j.cognition.2010.03.012. [DOI] [PubMed] [Google Scholar]
- 11.Piazza M, Mechelli A, Price CJ, Butterworth B. Exact and approximate judgements of visual and auditory numerosity: An fMRI study. Brain Res. 2006;1106:177–188. doi: 10.1016/j.brainres.2006.05.104. [DOI] [PubMed] [Google Scholar]
- 12.Feigenson L, Dehaene S, Spelke ES. Core systems of number. Trends Cogn Sci. 2004;8:307–314. doi: 10.1016/j.tics.2004.05.002. [DOI] [PubMed] [Google Scholar]
- 13.Pica P, Lemer C, Izard V, Dehaene S. Exact and approximate arithmetic in an Amazonian indigene group. Science. 2004;306:499–503. doi: 10.1126/science.1102085. [DOI] [PubMed] [Google Scholar]
- 14.Gordon P. Numerical cognition without words: Evidence from Amazonia. Science. 2004;306:496–499. doi: 10.1126/science.1094492. [DOI] [PubMed] [Google Scholar]
- 15.Nieder A, Dehaene S. Representation of number in the brain. Annu Rev Neurosci. 2009;32:185–208. doi: 10.1146/annurev.neuro.051508.135550. [DOI] [PubMed] [Google Scholar]
- 16.Castelli F, Glaser DE, Butterworth B. Discrete and analogue quantity processing in the parietal lobe: A functional MRI study. Proc Natl Acad Sci USA. 2006:103, 4693–4698. doi: 10.1073/pnas.0600444103. [DOI] [PMC free article] [PubMed] [Google Scholar]
- 17.Cappelletti M, Muggleton N, Walsh V. Quantity without numbers and numbers without quantity in the parietal cortex. Neuroimage. 2009;46:522–529. doi: 10.1016/j.neuroimage.2009.02.016. [DOI] [PMC free article] [PubMed] [Google Scholar]
- 18.Roggeman C, Santens S, Fias W, Verguts T. Stages of nonsymbolic number processing in occipitoparietal cortex disentangled by fMRI adaptation. J Neurosci. 2011;31:7168–7173. doi: 10.1523/JNEUROSCI.4503-10.2011. [DOI] [PMC free article] [PubMed] [Google Scholar]
- 19.Izard V, Dehaene-Lambertz G, Dehaene S. Distinct cerebral pathways for object identity and number in human infants. PLoS Biol. 2008;6:e11. doi: 10.1371/journal.pbio.0060011. [DOI] [PMC free article] [PubMed] [Google Scholar]
- 20.Le Corre M, Carey S. One, two, three, four, nothing more: an investigation of the conceptual sources of the verbal counting principles. Cognition. 2007;105:395–438. doi: 10.1016/j.cognition.2006.10.005. [DOI] [PMC free article] [PubMed] [Google Scholar]
- 21.Gilmore CK, McCarthy SE, Spelke ES. Symbolic arithmetic knowledge without instruction. Nature. 2007;447:589–591. doi: 10.1038/nature05850. [DOI] [PubMed] [Google Scholar]
- 22.Butterworth B, Varma S, Laurillard D. Dyscalculia: From brain to education. Science. 2011;332:1049–1053. doi: 10.1126/science.1201536. [DOI] [PubMed] [Google Scholar]
- 23.Halberda J, Mazzocco MM, Feigenson L. Individual differences in non-verbal number acuity correlate with maths achievement. Nature. 2008;455:665–668. doi: 10.1038/nature07246. [DOI] [PubMed] [Google Scholar]
- 24.Libertus ME, Feigenson L, Halberda J. Preschool acuity of the approximate number system correlates with school math ability. Dev Sci. 2011;14:1292–1300. doi: 10.1111/j.1467-7687.2011.01080.x. [DOI] [PMC free article] [PubMed] [Google Scholar]
- 25.Mazzocco MMM, Feigenson L, Halberda J. Preschoolers’ precision of the approximate number system predicts later school mathematics performance. PLoS ONE. 2011;6:e23749. doi: 10.1371/journal.pone.0023749. [DOI] [PMC free article] [PubMed] [Google Scholar]
- 26.Gosling SD, Vazire S, Srivastava S, John OP. Should we trust web-based studies? A comparative analysis of six preconceptions about internet questionnaires. Am Psychol. 2004;59:93–104. doi: 10.1037/0003-066X.59.2.93. [DOI] [PubMed] [Google Scholar]
- 27.McGraw KO, Tew MD, Williams JE. The integrity of Web-delivered experiments: Can you trust the data? Psychol Sci. 2000;11:502–506. doi: 10.1111/1467-9280.00296. [DOI] [PubMed] [Google Scholar]
- 28.Krantz JH, Dalal R. Validity of web-based psychological research. In: Birnbaum MH, editor. Psychological Experiments on the Internet. San Diego: Academic; 2000. [Google Scholar]
- 29.Germine LT, Duchaine B, Nakayama K. Where cognitive development and aging meet: Face learning ability peaks after age 30. Cognition. 2011;118:201–210. doi: 10.1016/j.cognition.2010.11.002. [DOI] [PubMed] [Google Scholar]
- 30.Wilmer JB, et al. Human face recognition ability is specific and highly heritable. Proc Natl Acad Sci USA. 2010;107:5238–5241. doi: 10.1073/pnas.0913053107. [DOI] [PMC free article] [PubMed] [Google Scholar]
- 31.Golder SA, Macy MW. Diurnal and seasonal mood vary with work, sleep, and daylength across diverse cultures. Science. 2011;333:1878–1881. doi: 10.1126/science.1202775. [DOI] [PubMed] [Google Scholar]
- 32.Henrich J, Heine SJ, Norenzayan A. The weirdest people in the world? Behav Brain Sci. 2010;33:61–83. doi: 10.1017/S0140525X0999152X. [DOI] [PubMed] [Google Scholar]
- 33.The College Board . Why Take the SAT. 2011. Available at http://sat.collegeboard.org/about-tests/sat/why-take-the-test. Accessed February 2, 2012. [Google Scholar]
- 34.Kranzler JH, Jensen AR. Inspection time and intelligence: A meta-analysis. Intelligence. 1989;13:329–347. [Google Scholar]
- 35.Frey MC, Detterman DK. Scholastic assessment or g? The relationship between the Scholastic Assessment Test and general cognitive ability. Psychol Sci. 2004;15:373–378. doi: 10.1111/j.0956-7976.2004.00687.x. [DOI] [PubMed] [Google Scholar]
- 36.Dewind NK, Brannon EM. Malleability of the approximate number system: Effects of feedback and training. Front Hum Neurosci. 2012;6:68. doi: 10.3389/fnhum.2012.00068. [DOI] [PMC free article] [PubMed] [Google Scholar]
- 37.Lyons IM, Beilock SL. Numerical ordering ability mediates the relation between number-sense and arithmetic competence. Cognition. 2011;121:256–261. doi: 10.1016/j.cognition.2011.07.009. [DOI] [PubMed] [Google Scholar]
- 38.Germine LT, Hooker CI. Face emotion recognition is related to individual differences in psychosis-proneness. Psychol Med. 2011;41:937–947. doi: 10.1017/S0033291710001571. [DOI] [PubMed] [Google Scholar]
- 39.Germine L, et al. Downloadable science: Comparing data from internet and lab-based psychology experiments. J Vis. 2010;10:682. [Google Scholar]
Associated Data
This section collects any data citations, data availability statements, or supplementary materials included in this article.