

Abstract
Despite extensive culling of common vampire bats in Latin America, lethal human rabies outbreaks transmitted by this species are increasingly recognized, and livestock rabies occurs with striking frequency. To identify the individual and population-level factors driving rabies virus (RV) transmission in vampire bats, we conducted a longitudinal capture–recapture study in 20 vampire bat colonies spanning four regions of Peru. Serology demonstrated the circulation of RV in vampire bats from all regions in all years. Seroprevalence ranged from 3 to 28 per cent and was highest in juvenile and sub-adult bats. RV exposure was independent of bat colony size, consistent with an absence of population density thresholds for viral invasion and extinction. Culling campaigns implemented during our study failed to reduce seroprevalence and were perhaps counterproductive for disease control owing to the targeted removal of adults, but potentially greater importance of juvenile and sub-adult bats for transmission. These findings provide new insights into the mechanisms of RV maintenance in vampire bats and highlight the need for ecologically informed approaches to rabies prevention in Latin America.
Keywords: culling, disease thresholds, longitudinal, Lyssavirus, chiroptera, Desmodus
1. Introduction
Bats (Chiroptera) are increasingly recognized as reservoirs of emerging zoonotic RNA viruses, including severe acute respiratory syndrome coronavirus, Nipah virus, Ebolavirus and multiple Lyssaviruses [1]. Predicting the spatial and temporal dynamics of cross-species transmission requires understanding how highly lethal viruses are maintained in wild bat populations over space and time. Of particular relevance is the identification of the natural and anthropogenic factors that drive the prevalence of infection in bats and the subsets of bat populations and communities that enable long-term viral maintenance. In spite of their importance for understanding maintenance mechanisms, long-term field studies of virus dynamics in wild bat populations are exceedingly rare [2–4]. This substantially limits the development of epidemiologically informed strategies for controlling viruses in bat populations and parametrization of models to forecast transmission to humans and domesticated animals [1].
Rabies virus (RV), common in bat populations throughout the Americas, is the best-studied and arguably most important zoonotic virus of bats. In mammals, untreated infection causes an acute, lethal encephalitis; however, bats occasionally survive abortive infections that may provide some degree of naturally acquired immunity [5,6]. Among bat reservoirs, the common vampire bat (Desmodus rotundus) causes the greatest rabies burden in other species owing to its unique habit of feeding on mammalian blood, an ideal behavioural mechanism for virus transmission by biting events [7]. With greater human encroachment into Amazonian regions of South America, vampire-bat-transmitted human rabies outbreaks are increasingly recognized and now surpass the annual number of cases caused by dogs [8]. In the agricultural zones of Latin America, livestock constitute the primary food source for vampire bats and this resource supplementation has possibly inflated vampire bat population densities [9,10]. Although the number of vampire-bat-transmitted rabies cases in livestock appears to have declined from the more than 500 000 annual cases that were estimated throughout the 1960s, yearly economic losses from rabies continue to exceed US$30 million [5]. Estimates from Brazil alone indicate thousands of cases in cattle per year and under-reporting is likely throughout much of Latin America [11]. For example, 4 per cent of 1000 cattle slaughtered for human consumption in Mexico City were found rabid (reviewed in [12]). Because cattle-to-cattle transmission of RV is extremely rare, nearly all of these cases are transmitted by other species, and molecular epidemiological studies indicate transmission from vampire bats in the vast majority [13,14].
Strategies to control vampire-bat-transmitted rabies in Latin America include vaccination of humans and livestock and reduction of bat populations by culling. Vaccination of livestock is effective, but poses economic and logistical challenges that limit its practicality in the developing countries where the vampire bat rabies problem is most severe. For humans, although bat bites are common in many parts of the Amazon jungle, vaccination is predominately a reactive public health effort, initiated only after mortality is reported [8]. Unfortunately, the geographical isolation of human settlements in the Amazon where rabies outbreaks tend to occur can cause substantial delays in vaccine delivery [15]. Large-scale culling of vampire bats began in the 1970s with the development of ‘vampiricide’, an anticoagulent paste applied to captured bats and spread to the colony by allogrooming after treated bats return to the roost [16]. The paste can also be placed on bite wounds of livestock to kill bats that return to feed from the same wound [7]. Vampiricide is probably most effective at killing adult bats, but may have less impact on juveniles because they are unlikely to groom adults (thus exposing themselves to the poison) and have less interaction with livestock owing to maternal dependence during most of the first year of life [17]. Despite over three decades of culling in many Latin American countries, rabies cases continue to occur in livestock, suggesting that vampiricide is insufficient for RV elimination [11]. More troubling, culling in wildlife disease systems can sometimes increase disease prevalence when it stimulates the recruitment of susceptible individuals or increases host dispersal [18–20]. The perpetuation of vampire bat rabies despite culling could therefore be enhanced by immigration of bats from neighbouring colonies to fill vacant roost space, selective removal of adults that perhaps have protective immunity or an increase in births of susceptible bats following the relaxation of resource or space limitation.
Most knowledge of rabies in vampire bats has been inferred from patterns of livestock mortality or controlled infections in captive bats [21,22], leaving major gaps in our understanding of viral transmission that might aid the development of control strategies. For example, the theoretical basis underpinning culling vampire bats to prevent rabies rests on two untested assumptions: first, that adult bats are important for transmission, and second, that virus transmission scales positively with bat density. The question of density-dependent transmission is also important for anticipating the frequency of rabies outbreaks in humans and livestock. If transmission does not increase with host density, population thresholds for viral invasion are not expected to exist; so outbreaks in bats (and subsequent transmission to humans or livestock) would be less predictable and depend more heavily on stochastic factors [23].
Here, we report the results of a field study of RV exposure carried out over a total of 40 months in 20 geographically widespread vampire bat colonies in Peru. Our specific goals were: (i) to identify the population and individual-level factors that influence RV exposure in wild vampire bats, (ii) to test the relationship between bat density and virus transmission, and (iii) to compare rates of exposure in bat populations that are affected by contrasting anthropogenic forces of culling and resource supplementation through livestock rearing. We predicted that seroprevalence would increase with host colony size and livestock density (assuming a density-dependent component to rabies transmission). We further predicted that culling would reduce seroprevalence, owing to the potential removal of infected bats and the overall lowering of host population density.
2. Material and methods
(a). Field sites and sampling design
Between July 2007 and October 2010, we sampled 20 vampire bat colonies in four departments of Peru: Apurimac, Cajamarca, Lima and Madre de Dios (figure 1). Colonies represented the three major geographical regions of Peru that are inhabited by vampire bats (coastal deserts, Andean valleys and the Amazon jungle) and captured a range of livestock and bat densities [24]. The Peruvian Ministry of Health or the Peruvian Ministry of Agriculture had previously located most colonies. Colonies in Madre de Dios were located by capturing bats near livestock corrals or human settlements where bat bites had been reported and radio-tracking them back to their roosts via airplane, motorcycle and foot (Radiotag model BD-2, 1.48g, Holohil Inc.). Colonies inhabited both natural (trees and caves) and man-made structures (mines, tunnels) and were separated by a minimum of 10 km (though typically much greater), because natural movements between roosts have been reported at lesser distances [25]. A single exception was made for sites AP1 and AP3, which were only 2.2 km apart; however, no individuals moved between those two caves and grouping as a single site did not influence later results.
Figure 1.

Map of study sites in Peru with spatio-temporal patterns of rabies virus (RV) exposure. White points show sampling locations. Coloured regions indicate the governmental departments that were sampled (red, Apurimac; green, Madre de Dios; blue, Lima; orange, Cajamarca). Pie charts show the proportion of seropositive (white) vampire bats in each site in each year, with pie diameter proportional to sample size (range = 6–102). Colonies with less than or equal to five samples in a single year were classified as seropositive (open diamond) or seronegative (filled diamond). Dashed lines connect sites across years and orbits around Peru group sites by year.
(b). Capture and sampling of wild vampire bats
Pilot sampling in 2007 sampled each colony for a single day or night. From 2008 to 2010, we conducted 3–6 night capture–recapture studies per year at most colonies. During these sessions, bats were captured in mist nets or harp traps placed at the exits of roosts from approximately 18.00 until 05.00. An additional 2–5 mist nets were placed within 50 m of each roost over trails, streams and other likely flyways. In 2007 and 2010, diurnal captures were undertaken for colonies where it was possible to enter roosts to increase the sampling of juvenile bats. During these sessions, bats were captured using aerial insect nets, and mist nets were placed at the roost exit to catch escaping individuals.
Upon capture, each bat was issued one or two unique four-digit incoloy wing bands (3.5 mm, Porzana Inc.). Age was classified as juvenile, sub-adult or adult based on the degree of fusion of the phalangeal epiphyses. Juveniles included volant individuals that had a gap of 0.5 mm or greater in the phalangeal epiphyses, corresponding to an age of approximately two to six months. Sub-adults lacked complete fusion of the phalangeal epiphyses (less than 0.5 mm), but had otherwise adult features, corresponding to an age of approximately six to nine months [26]. Two independent observers confirmed classification of juveniles and sub-adults. Reproductive activity in adults was indicated in males by the presence of scrotal testes and in females by pregnancy or lactation. For serological assays, a maximum of 250 μl of whole blood was collected by lancing the propatagial vein with a sterile 23 gauge needle. Blood was collected with heparinized capillary tubes, centrifuged in the field using serum separator tubes and stored on cold packs until it could be frozen (typically 0–3 days). After sample collection, bats were released at the site of capture.
(c). Detection of rabies virus neutralizing antibodies in bat sera
The rapid fluorescent focus inhibition test (RFFIT) is a standard laboratory method for detecting the presence of RV neutralizing antibodies. We used a modified RFFIT described by Kuzmin et al. [27] using four-well (6 mm) Teflon-coated glass slides to accommodate the small volumes of serum that could be collected from bats. Serum samples were considered positive if they showed 100 per cent neutralization of at least five of 10 fields at the 1 : 10 dilution, or if they showed more than 50 per cent reduction of the area of infected cells relative to the negative control. To calculate the area of infected cells, we captured four to five digital images at the 1 : 10 dilution and counted the number of fluorescent green (infected cell area) and red (healthy cell area) pixels using Adobe Photoshop software with Fovea Pro plugins (Reindeer Graphics, Inc.). Samples were considered positive if the 95% CI of the proportion of infected cells fell outside that of the negative control × 0.5. Because antibody titres decline to undetectable levels within five months in other experimentally inoculated bats (Eptesicus fuscus), we assumed that the presence of virus neutralizing antibodies reflected recent exposure to RV [6,28].
(d). Estimation of bat colony sizes
We estimated the size of each bat colony using loglinear capture–recapture models in the rcapture package of R v. 2.12 [29]. Because multiple day sampling periods took place from 2008 to 2010 only, we restricted colony size inference to those years. We treated each 3–6 day sampling period per site per year as an independent, closed population. For each sampling period, a set of eight models with different assumptions on the sources of variation in capture probabilities (capture date, individual heterogeneity and behavioural responses to previous captures) were fit to the data and compared by Akaike's information criterion (AIC).
(e). Data on livestock rearing and culling activity
We calculated livestock density as the number of cows, sheep, pigs and goats within 5 km2 of each roost using district level data (approx. equivalent to US districts) from the Agricultural Census of Peru (CENAGRO III). Culling history was described at two time scales, using data and interviews of personnel from the regional offices of the Ministry of Health and/or the Ministry of Agriculture, the groups responsible for bat population control. First, a long-term variable categorized colonies that: (i) had never been culled, (ii) were periodically culled, and (iii) were regularly culled between 2007 and 2010. Second, we recorded whether colonies were culled during the 12-month period immediately prior to sampling as a binary variable. We considered culling to include several methods aimed at reducing vampire bat populations: application of vampiricide, direct killing of captured bats and destructive disturbance of roosts (e.g. logging of roost trees, lighting fires in caves).
(f). Statistical analysis
We tested the effects of culling and livestock density on the vampire bat colony sizes estimated from our capture–recapture studies (2008–2010 data) using generalized linear mixed models (GLMM). The full model included livestock density, long-term culling history, the department of Peru, and the interaction between culling and livestock density as fixed effects. Colony size and livestock density were square-root-transformed to fit model assumptions. Site was included as a random effect after comparing the AIC scores of competing random effects components under the full fixed effects model. Other random effects components considered included hierarchical nesting of site within department and department alone. For these and later GLMMs, model simplification used stepwise removal of terms, followed by nested likelihood ratio tests. Term removals that significantly reduced explanatory power (p < 0.05) were retained in the minimal adequate model. The 95% highest posterior densities (HPD) on effect sizes were generated using Markov Chain Monte Carlo sampling of the posterior distribution of the minimal adequate model using the mcmcsamp function in the lme4 package of R [29].
We assessed the factors contributing to RV exposure in individual vampire bats by applying a binomial GLMM (logit link) to the serological data from 2007 to 2010. The initial fixed effects component contained age, sex, reproductive status, forearm length (as a general measure of body size), colony size, livestock density and the two measures of culling history along with biologically meaningful two-way interactions (age by sex, sex by reproductive status). Colony sizes from 2007 were treated as missing data. As in the analysis of bat colony sizes, several competing random effects structures were tested. However, a variance component analysis indicated that no random effects explained substantial variation; so site was retained mainly based on our study design. Individual tag number could not be included as a random effect because these models failed to converge. The minimal fixed effect model structure was identified using a truncated dataset (n = 816 observations) to accommodate missing values for some explanatory values. The effect sizes of the minimal model were then estimated from the full dataset for which there were no missing observations in significant terms (n = 1040 observations).
3. Results
(a). Colony size and population dynamics of vampire bats
Over the 40-month period, we captured 1436 unique vampire bats. Recaptures were relatively common both within (n = 216) and between years (n = 132), with individuals recaptured up to 3 years after initial capture (the maximum duration permitted by our study design). Vampire bats demonstrated strong regional fidelity with no instances of roost switching observed during the study period. Colony size estimates ranged from 16 to 444 individuals and generally remained stable over years; however, in three sites the 95% CI on colony sizes did not overlap across years (see the electronic supplementary material, table S1). Both decreases in colony size (AP13, MD134) involved human destruction of roosts, and the increase in LM4 in 2010 may indicate re-colonization after the cessation of mining activity on the outer wall of that cave.
The GLMM analysis found no effect of culling on bat colony size (χ22 = 1.91, p = 0.38), but colony sizes differed among departments (χ23 = 10.8, p = 0.01) and according to livestock density (χ21 = 4.75, p = 0.03). On average, colonies were smaller in the Amazonian region of Madre de Dios (effect size, β = −12.89 (95% HPD = −22.48 to −3.89)) relative to the Andean regions of Cajamarca (β = 7.68 (95% HPD = 1.13–14.03)) and Apurimac (baseline effect size). Colony sizes in the coastal department of Lima overlapped with both Andean and Amazonian regions (β = −2.47 (95% HPD = −7.77–3.31)). Livestock densities varied by department in the same pattern as colony sizes (Cajamarca > Apurimac > Lima > Madre de Dios) leading to an overall positive relationship between livestock density and bat density. However, because ‘department’ explained much of the variance in livestock density, when both were included in the model, livestock density actually had a significant negative effect on colony size (β = −0.41 (95% HPD = −0.82–0.014)). This negative effect was driven by a single large colony in Lima (LM6) found in an area of relatively low livestock density.
(b). Spatial and temporal patterns of rabies virus exposure in vampire bats
Analysis of 1086 serum samples revealed a global seroprevalence of 10.2 per cent across all years and sites. The vast majority of individuals that were recaptured in multiple years were seronegative in all years (n = 78/86). Seroconversion, loss of detectable antibody titre and maintenance of antibodies occurred in two, five and one individuals, respectively. Across years, seropositive vampire bats were found in all sites where greater than four individuals were sampled and seroprevalence in these colonies varied from 3.3 to 28.6 per cent. Seroprevalence was relatively stable over time in most sites, but significant shifts or putative disease extinctions and re-colonizations occurred in AP13, LM10 and LM6 (χ2 test: p < 0.05 for each; figure 1). Within years, sites in the same department had significantly different levels of rabies exposure in Lima in 2009 (χ2 = 25.63, p < 0.001), and in Apurimac and Cajamarca in 2010 (Apurimac: χ2 = 10.56, p = 0.014; Cajamarca: χ2 = 12.99, p = 0.005), but other department–year combinations could not be differentiated statistically.
(c). Individual and population-level predictors of rabies virus exposure in vampire bats
The minimal GLMM retained only two factors: age and culling history between 2007 and 2010, as predictors of exposure to RV (table 1). Notably, RV seroprevalence did not increase uniformly with age, but instead was elevated in juveniles relative to adults (odds ratio (OR) = 3.01), peaked in sub-adults (OR = 3.58) and then declined in adult bats (figure 2a). Inspection of the culling effect showed that RV seroprevalence was higher in bat colonies that were subjected to periodic (OR = 2.03) and regular culling (OR = 1.43) compared with those that were never culled during the study. However, the seroprevalence in regularly culled colonies was not statistically different from that of undisturbed or periodically culled colonies (figure 2b).
Table 1.
Generalized linear mixed model analysis of the individual and population-level factors influencing rabies exposure in vampire bats. (Italic text indicates inclusion in the minimal model. Significance was determined by likelihood ratio tests comparing the minimal model to models including each term (or excluding in the case of age and 4 year culling). Two non-significant two-way interactions were omitted from the table. All models contained site as a random effect and a significant y-intercept term.)
| factor | χ2 | d.f. | p-value |
|---|---|---|---|
| age | 16.41 | 2 | < 0.001 |
| culling (4 year) | 6.72 | 2 | 0.035 |
| sex | 3.39 | 1 | 0.066 |
| reproductive | 2.39 | 1 | 0.121 |
| colony size | 2.02 | 1 | 0.225 |
| livestock density | 0.26 | 1 | 0.607 |
| forearm | 0.005 | 1 | 0.943 |
| culling (1 year) | 0.0005 | 1 | 0.982 |
Figure 2.

Effects of (a) age and (b) culling history on RV exposure in vampire bats. Error bars are 95% confidence intervals. Letters indicate statistically significant differences among groups (p < 0.05) in generalized linear mixed models. Sample sizes for groups are indicated below bar labels.
We also tested the robustness of the GLMM to different model structures. Results remained unchanged when year and department, which were excluded from the random effects component, were included as fixed effects and neither of these was significant (department: χ23 = 2.71, p = 0.44; year: χ22 = 1.17, p = 0.55). Next, we repeated the GLMM analysis using a single randomly selected blood sample per recaptured bat to account for possible non-independence of samples from the same individual. Finally, we repeated the analysis excluding six colonies that contained other bat species because cross-species exposures might cause seroconversion in D. rotundus. In each of the latter analyses, age and culling retained statistical support. However, in the analysis using roosts with D. rotundus only, females had significantly higher seroprevalence than males (OR = 1.98, χ21 = 5.0, p = 0.025), a marginally significant effect in the original GLMM (table 1).
Because the relationship between colony size and seroprevalence was central to our study but not supported in the GLMM analysis, we conducted a separate logistic regression analysis to confirm the absence of a relationship after removing potentially correlated factors. This analysis suggested a very weak positive association between colony size and seroprevalence, but this trend was significant only when excluding two site/year combinations that had unusually high seroprevalence (figure 3). Both models had a significantly positive y-intercept, suggesting the absence of lower population threshold for viral invasion.
Figure 3.
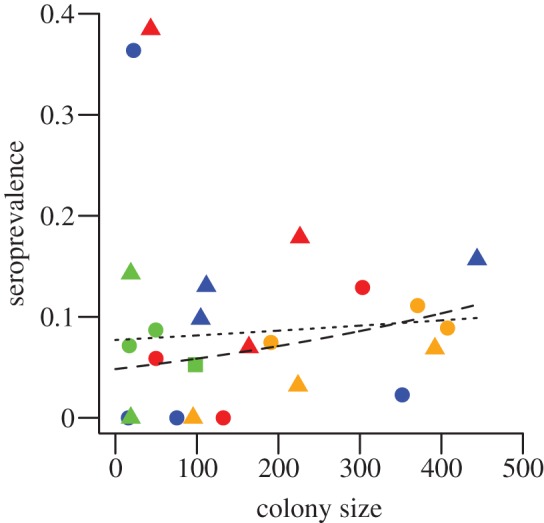
The relationship between vampire bat colony size and seroprevalence. Colours indicate the departmental region as in figure 1. A logistic regression found no significant association between colony size and seroprevalence (z1 = 0.71, p = 0.479). When the two sites with unusually high seroprevalence were removed (see top left portion of figure), this relationship became weakly, but significantly positive (z1 = 2.138, p = 0.031). However, the y-intercept remained significantly greater than zero, suggesting the absence of a strict population threshold for viral invasion. The dotted and dashed lines show model predictions of prevalence for the full and partial datasets, respectively. Squares, 2008; circles, 2009; triangles, 2010.
4. Discussion
Culling vampire bats is a central tool used by many Latin American countries to prevent rabies in humans and livestock. The core assumption behind culling to reduce wildlife disease is that reducing host population size decreases pathogen transmission [23]. We tested this assumption by surveying RV exposure in 20 vampire bat colonies in Peru that showed natural variation in population size, and in colonies with and without a history of culling. Our results demonstrated that exposure to RV was ubiquitous across geographically widespread vampire bat populations, was at best only weakly related to bat colony size, and tended to increase following sporadic culling.
The most powerful predictor of RV antibodies was host age class, with higher seropositivity in juvenile and sub-adult bats relative to adults (figure 2a). This pattern is unlikely to reflect maternally derived antibodies because average seroprevalence was higher in juveniles than adult females and did not decline during the first year of life (figure 2a). Moreover, although studies of paired mother-pup antibody titres are lacking for D. rotundus, maternally derived antibodies in the Mexican free-tailed bat (Tadarida brasiliensis) were lost by 10 weeks after birth, and antibody titres in wild caught big brown bats (E. fuscus) that were a few months old declined rapidly in captivity [30,31]. Therefore, the maintenance of elevated seroprevalence in the older juvenile and sub-adult bats in our study is more consistent with RV exposures during the first year of life, as was previously suggested in serological studies of T. brasiliensis [32]. A key role for juveniles in RV transmission was also indicated in a survey of bats submitted for diagnostic testing in Canada, where juveniles comprised 38.5–84.2% of rabid bats, depending on species [33]. Hence, RV exposure and infection may be common in juvenile and sub-adult vampire bats and might contribute to the high mortality rates (more than 50%) observed during their first year of life [34]. Frequent infection of juvenile bats may also aid long-term maintenance by capitalizing on seasonal pulses of susceptible individuals, as was suggested in mathematical models of RV in hibernating populations of E. fuscus [35].
Elevated rates of rabies in juvenile and sub-adult bats could also help explain the positive association between periodic culling and seroprevalence (figure 2b and table 1). Specifically, because juveniles are probably less likely to groom adults than adults are to groom each other or juveniles, vampiricide might preferentially kill adults. Because adults had lower seroprevalence, but perhaps greater immunity owing to repeated exposures, this selective removal might increase population-level seroprevalence [6]. Demographic mechanisms acting over longer time scales, such as re-colonization of culled colonies from neighbouring populations (the ‘vacuum effect’) or increased juvenile survival following a sudden release from density dependent constraints could further increase transmission by augmenting the susceptible bat population. At some locations, it is possible that bats were killed in response to the detection of rabies in nearby livestock. This may explain the high seroprevalence at site AP13 in September 2011, where farmers captured bats in nets and lit fires in caves after two cows died of rabies in August 2010 (SENASA Weekly Epidemiological Reports 32–2010 and 37–2010). However, if this were more generally the case, we would have expected culling during the 12 months prior to sampling, rather than the general culling strategy over the study period, to have been the better predictor of RV exposure in bats (table 1).
Regardless of whether culling increased RV transmission, numerically increased seroprevalence by disproportionately killing adults, or occurred in response to bat-transmitted rabies outbreaks in livestock, it is evident that culling vampire bats failed to eliminate regional RV circulation (figures 1 and 2b). Similar results have been observed in other wildlife disease systems, most notably bovine tuberculosis in badgers in the UK, where reactive culling of badgers actually increased prevalence in badgers and had mixed effects on incidence in cattle; and fox rabies in Europe, where models predicted that the need for unattainably high levels of culling might explain its limited success [19,20,36]. Given recent discussions of culling of bats for the control of pathogens (e.g. Hendra virus in Australia, white-nose syndrome in North America), the potential mechanisms underlying the perpetuation of RV despite culling of vampire bats deserve mention [37,38]. First, it is possible that culling was simply not implemented at a sufficient scale to affect the overall size of bat colonies. Indeed, regularly culled colonies were not significantly smaller than undisturbed colonies, and disturbance reduced colony sizes only when it involved major perturbations of roosts (see the electronic supplementary material, table S1). Sub-optimal culling might be sufficient to shift the age structure of bat colonies without having dramatic effects on total colony size (i.e. culled adults are replaced by greater juvenile and sub-adult survival). While this might have the unfortunate consequence of increasing RV transmission at low levels of culling, it leaves the open possibility that more intense culling or coordinated campaigns within and among regions might eliminate RV. A second explanation for the failure of culling to reduce RV seroprevalence is the lack of a strong relationship between bat density and RV transmission (table 1 and figure 3). Thus, contact rates between susceptible and infected bats might be independent of colony size, such that the per capita force of infection depends more heavily on the prevalence of infection than overall population density (i.e. frequency-dependent transmission) [23]. Although we know of no other study that has examined density dependence in virus transmission in bats, the absence of a relationship for RV is perhaps not surprising, given that even in large colonies, any single animal will have a limited number of neighbours to bite. For vampire bats, infectious contacts may be even less homogenous owing to social structure within colonies [17].
A consequence of the decoupling of transmission from population density is that bat population thresholds for RV invasion or persistence may not exist [23]. This implies a challenge for disease management because no reasonable level of culling will be sufficient to eliminate rabies or prevent re-invasion after stochastic viral extinctions. Indeed, even when vampire bat populations in northern Argentina were reduced by 95 per cent after gassing roosts with cyanide, rabies cases were reported as close as 1 km from the area of elimination [39]. Even if it were ecologically defensible, the feasibility of achieving this degree of bat population reduction over even modest spatial scales is at best daunting in flat agricultural landscapes and probably impossible in mountainous or jungle regions such as those in the Andes and the Amazon, where many roost sites are unknown or inaccessible. As additional field and laboratory data become available, mathematical modelling approaches will be useful to uncover the basic factors controlling viral maintenance and the effectiveness of different methods for control.
Important questions remain about the biology and spatial scale of vampire bat rabies maintenance. First, although rabies is traditionally considered a lethal disease, the relatively high seroprevalence that we observed and the survival of seropositive individuals across years indicates that exposure does not always kill vampire bats, and may instead result in some degree of immunity. Because these alternative outcomes of exposure will influence transmission dynamics, characterizing the probability of lethal infection versus naturally acquired immunity is critical to understanding long-term maintenance [40]. Second, previous studies of rabies incidence in livestock suggest that vampire bat rabies is maintained as a slowly migrating epizootic, where the virus spreads from colony to colony and cannot reinvade until some threshold number of susceptible bats recovers [39]. In support of this theory, livestock rabies mortality at the limit of the geographical distribution of vampire bats in northern Argentina appears episodic. Yet within the enzootic range of vampire bat rabies, several lines of evidence cast doubt on whether regional viral extinction occurs predictably and whether population thresholds exist for re-invasion. First, our serological data indicated the continual presence of RV in most sites across several years (figure 1). This was more likely to reflect the regional circulation of RV than long-term maintenance of antibodies in individual bats because we observed several instances of antibody loss in recaptured bats, and controlled infections of other bat species have shown that antibody titres decline to undetectable levels several months after initial infection and do not recover without additional exposures [6,28]. Second, in Peru as well as other Latin American countries, livestock rabies mortality recurs over many years in confined geographical regions, and phylogenetic studies have revealed these as independently circulating viral lineages [13].
In addition to spatial variation in transmission dynamics, the apparent conflict between hypotheses of a migrating epizootic versus enzootic regional maintenance might also be explained by the existence of two fundamentally different epizootic phases. Initial epizootic waves into naïve populations might be followed by local enzootic cycles that persist indefinitely, either at constant levels or through multi-annual cycles. This has been described most clearly for raccoon rabies, where the epizootic spread of the virus through raccoon populations in the eastern United States was followed by enzootic maintenance through recurrent small outbreaks that did not require immigration of infected individuals [41]. A re-assessment of livestock rabies mortality data suggests analogous dynamics in vampire bats. When patterns of vampire bat-transmitted livestock cases from the same region of Argentina were analysed by Fornes et al. [39] from 1959 to 1974 and by Delpietro & Russo [21] from 1984 to 1993, the spatial signatures of spread that were apparent in the first epizootic had disappeared in later years, consistent with regional enzootic maintenance. Rabies control programmes would benefit from considering these alternative scenarios because local enzootic maintenance implies that cross-species transmission will occur sporadically, making it far less predictable than in the scenario of slow viral spread across a landscape.
Finally, several areas of uncertainty accompany our results. First, although vampire bats maintain RV independently of other species, it is likely that some sympatric bats also maintain distinct transmission cycles [42]. RV transmission from other bats to D. rotundus has never been observed; however, we cannot exclude the possibility that some cross-species exposures resulted in seroconversion. We minimized this risk by focusing our captures on roosts that were occupied only by D. rotundus and by confirming the robustness of our results to the exclusion of sites where multiple species were present. We also faced uncertainty in the scale of vampire bat population sizes (single roost site to regional population size) that would be most relevant for modelling RV transmission. We attempted to generate an intermediate estimate by: (i) working in the largest known colony in each region, (ii) by placing arrays of mist nets in the area surrounding roost sites to survey passing individuals, and (iii) by working at each roost for multiple nights to catch individuals arriving from nearby roosts. Although we observed no roost switching between our sites (separated by 10 km or more), dispersal has been demonstrated between roosts within 2–5 km in Mexico and Brazil [25,43]. Therefore, our sampling strategy should have been sufficient to detect such individuals and give a closer approximation to the regional metapopulation size. Future studies should use genetic estimates of regional effective population sizes to confirm the absence of density dependence in RV transmission that we observed.
In conclusion, we provided evidence that RV is maintained regionally in vampire bat populations over multiple years in Peru, and this is perhaps mediated through frequency dependent transmission with a key role for juvenile and sub-adult bats. The absence of population thresholds for RV invasion and maintenance is consistent with the observed inefficacy of culling to eliminate viral circulation in bats and transmission to humans and domestic animals. Clearly, properly managed culling of vampire bats benefits agriculture through alleviating bat bites on livestock and possibly by reducing the total number of infected bats. However, the apparent positive effect of culling on seroprevalence, coupled with demographic and behavioural responses that might increase the proportion of susceptible bats, could have counterproductive consequences for RV transmission. Future field experiments should identify the mechanistic basis for the relationship between culling and seroprevalence and use that information to inform epidemiological models of optimal rabies control in Latin America. In the interim, integrated One Health programs aimed at preventing viral exposures, environmental education to minimize ecological disruptions and vaccination of susceptible populations are the best combined strategy to minimize the burden of vampire bat rabies.
Acknowledgements
The US Centers for Disease Control and Prevention (CDC) and the University of Georgia's Institutional Animal Care and Use Committee approved protocols for the capture and handling of bats (AUP no. A2009-10003-0) and collection and exportation permits were obtained from the Peruvian government (103-2008-INRENA-IFFS-DCB; RD-222-2009-AG-DGFFS-DGEFFS; RD-0299-2010-AG-DGFFS-DGEFFS; 003851-AG-DGFFS; 004692-AG-DGFFS and 005216-AG-DGFFS).
We thank numerous field assistants in Peru, especially Fernando Pancorbo, Oscar Centty, Liz Huamani and Jorge Carrera, for their hard work and dedication. For logistical support and personnel, we thank the Office of Epidemiology of the Ministry of Health, Peru, the Office of Animal Health SENASA, the regional offices of SENASA in Chota, Cutervo, Abancay, Andahuaylas and Puerto Maldonado, and the regional offices and/or hospitals of the Ministry of Health in Huacho, Barranca, Chancay, Mala, Huaral, Andahuaylas, Rio Blanco, Puerto Maldonado, Mazuko and Huepethue. We thank Steven Castleberry for lending radio-telemetry equipment, Andy Davis for assistance with the digital image analysis, and John Wares and two reviewers for insightful comments and discussion on the manuscript. This work was funded by grants to D.G.S. from the National Geographic Committee for Research and Exploration, the American Philosophical Society and the University of Georgia's Latin American and Caribbean Studies Institute; CDC/UGA seed grant no. FID-908 to S.A. and C.E.R.; and NSF grant DEB-1020966 to S.A. and P.R. D.G.S. was supported by an NSF Graduate Research Fellowship and a UGA Dissertation Completion Award. The findings and conclusions in this report are those of the authors and do not necessarily represent the official position of the Centers for Disease Control and Prevention.
References
- 1.Calisher C. H., Childs J. E., Field H. E., Holmes K. V., Schountz T. 2006. Bats: important reservoir hosts of emerging viruses. Clin. Microbiol. Rev. 19, 531–545 10.1128/CMR.00017-06 (doi:10.1128/CMR.00017-06) [DOI] [PMC free article] [PubMed] [Google Scholar]
- 2.Plowright R. K., Field H. E., Smith C., Divljan A., Palmer C., Tabor G., Daszak P., Foley J. E. 2008. Reproduction and nutritional stress are risk factors for Hendra virus infection in little red flying foxes (Pteropus scapulatus). Proc. R. Soc. B 275, 861–869 10.1098/rspb.2007.1260 (doi:10.1098/rspb.2007.1260) [DOI] [PMC free article] [PubMed] [Google Scholar]
- 3.Amengual B., Bourhy H., Lopez-Roig M., Serra-Cobo J. 2007. Temporal dynamics of European bat lyssavirus type 1 and survival of Myotis myotis in natural colonies. PLoS ONE 2, e566 10.1371/journal.pone.0000566 (doi:10.1371/journal.pone.0000566) [DOI] [PMC free article] [PubMed] [Google Scholar]
- 4.Wacharapluesadee S., Boongird K., Wanghongsa S., Ratanasetyuth N., Supavonwong P., Saengsen D., Gongal G., Hemachudha T. 2010. A longitudinal study of the prevalence of Nipah virus in Pteropus lylei bats in Thailand: evidence for seasonal preference in disease transmission. Vector-Borne Zoonotic Dis. 10, 183–190 10.1089/vbz.2008.0105 (doi:10.1089/vbz.2008.0105) [DOI] [PubMed] [Google Scholar]
- 5.World Health Organization 2005. WHO expert consultation on rabies: first report 5–8 Oct 2004. Geneva, Switzerland: World Health Organization. Technical report, vol. 931, pp. 1–88 [PubMed] [Google Scholar]
- 6.Turmelle A. S., Jackson F. R., Green D., McCracken G. F., Rupprecht C. E. 2010. Host immunity to repeated rabies virus infection in big brown bats. J. Gen. Virol. 91, 2360–2366 10.1099/vir.0.020073-0 (doi:10.1099/vir.0.020073-0) [DOI] [PMC free article] [PubMed] [Google Scholar]
- 7.Brass D. A. 1994. Epizootiology of vampire-bat rabies. In Rabies in bats: natural history and public health implications (ed. Brass D. A.), pp. 85–100 Ridgefield, CT: Livia Press [Google Scholar]
- 8.Schneider M. C., Romijn P. C., Uieda W., Tamayo H., da Silva D. F., Belotto A., da Silva J. B., Leanes L. F. 2009. Rabies transmitted by vampire bats to humans: an emerging zoonotic disease in Latin America? Rev. Panam. Salud Publica 25, 260–269 10.1590/S1020-49892009000300010 (doi:10.1590/S1020-49892009000300010) [DOI] [PubMed] [Google Scholar]
- 9.Voigt C. C., Kelm D. H. 2006. Host preference of the common vampire bat (Desmodus rotundus; Chiroptera) assessed by stable isotopes. J. Mammal. 87, 1–6 10.1644/05-MAMM-F-276R1.1 (doi:10.1644/05-MAMM-F-276R1.1) [DOI] [Google Scholar]
- 10.Delpietro H. A., Marchevsky N., Simonetti E. 1992. Relative population densities and predation of the common vampire bat (Desmodus rotundus) in natural and cattle-raising areas in north-east Argentina. Prev. Vet. Med. 14, 13–20 10.1016/0167-5877(92)90080-Y (doi:10.1016/0167-5877(92)90080-Y) [DOI] [Google Scholar]
- 11.Mayen F. 2003. Haematophagous bats in Brazil, their role in rabies transmission, impact on public health, livestock industry and alternatives to an indiscriminate reduction of bat population. J. Vet. Med. B Infect. Dis. Vet. Pub. Health 50, 469–472 [DOI] [PubMed] [Google Scholar]
- 12.Constantine D. G. 1988. Transmission of pathogenic microorganisms by vampire bats. In The natural history of vampire bats (eds Greenhall A. M., Schmidt U.), pp. 167–190 Boca Raton, FL: CRC Press [Google Scholar]
- 13.Kobayashi Y., et al. 2008. Molecular and geographic analyses of vampire bat-transmitted cattle rabies in central Brazil. BMC Vet. Res. 4, 44 10.1186/1746-6148-4-44 (doi:10.1186/1746-6148-4-44) [DOI] [PMC free article] [PubMed] [Google Scholar]
- 14.Velasco-Villa A., et al. 2006. Molecular diversity of rabies viruses associated with bats in Mexico and other countries of the Americas. J. Clin. Microbiol. 44, 1697–1710 10.1128/JCM.44.5.1697-1710.2006 (doi:10.1128/JCM.44.5.1697-1710.2006) [DOI] [PMC free article] [PubMed] [Google Scholar]
- 15.ProMED-mail. 2007. Rabies, human, vampire bat: Peru (03). (6 March: 20070306.0786) See http://www.promedmail.org/
- 16.Linhart S. B., Mitchell G. C., Crespo R. F. 1972. Control of vampire bats by topical application of an anticoagulant (chlorophacinone). Bol. Sanit. Panam. 73, 100. [PubMed] [Google Scholar]
- 17.Wilkinson G. S. 1988. Social organization and behavior. In Natural history of vampire bats (eds Greenhall A. M., Schmidt U.), pp. 85–97 Boca Raton, FL: CRC Press; [Google Scholar]
- 18.Choisy M., Rohani P. 2006. Harvesting can increase severity of wildlife disease epidemics. Proc. R. Soc. B 273, 2025–2034 10.1098/rspb.2006.3554 (doi:10.1098/rspb.2006.3554) [DOI] [PMC free article] [PubMed] [Google Scholar]
- 19.Donnelly C. A., et al. 2006. Positive and negative effects of widespread badger culling on tuberculosis in cattle. Nature 439, 843–846 10.1038/nature04454 (doi:10.1038/nature04454) [DOI] [PubMed] [Google Scholar]
- 20.Woodroffe R., et al. 2006. Culling and cattle controls influence tuberculosis risk for badgers. Proc. Natl Acad. Sci. USA 103, 14 713–14 717 10.1073/pnas.0606251103 (doi:10.1073/pnas.0606251103) [DOI] [PMC free article] [PubMed] [Google Scholar]
- 21.Delpietro H. A., Russo R. G. 1996. Ecological and epidemiological aspects of attacks by vampire bats in relation to paralytic rabies in Argentina, and an analysis of proposals for control. Rev. Sci. Tech. Off. Int. Epiz. 15, 971–984 [PubMed] [Google Scholar]
- 22.Moreno J. A., Baer G. M. 1980. Experimental rabies in the vampire bat. Am. J. Trop. Med. Hyg. 29, 254–259 [DOI] [PubMed] [Google Scholar]
- 23.Lloyd-Smith J. O., Cross P. C., Briggs C. J., Daugherty M., Getz W. M., Latto J., Sanchez M. S., Smith A. B., Swei A. 2005. Should we expect population thresholds for wildlife disease? Trends Ecol. Evol. 20, 511–519 10.1016/j.tree.2005.07.004 (doi:10.1016/j.tree.2005.07.004) [DOI] [PubMed] [Google Scholar]
- 24.Quintana H., Pacheco V. 2007. Identificación y distribución de los murciélagos vampiros del Perú. Rev. Peruana Med. Exper. Salud Pub. 24, 81–88 [Google Scholar]
- 25.Trajano E. 1996. Movements of cave bats in southeastern Brazil, with emphasis on the population ecology of the common vampire bat, Desmodus rotundus (Chiroptera). Biotropica 28, 121–129 [Google Scholar]
- 26.Delpietro H. A., Russo R. G. 2002. Observations of the common vampire bat (Desmodus rotundus) and the hairy-legged vampire bat (Diphylla ecaudata) in captivity. Mamm. Biol. Zeitschrift fur Saugetierkunde 67, 65–78 10.1078/1616-5047-00011 (doi:10.1078/1616-5047-00011) [DOI] [Google Scholar]
- 27.Kuzmin I. V., Niezgoda M., Franka R., Agwanda B., Markotter W., Beagley J. C., Urazova O. Y., Breiman R. F., Rupprecht C. E. 2008. Lagos bat virus in Kenya. J. Clin. Microbiol. 46, 1451–1461 10.1128/JCM.00016-08 (doi:10.1128/JCM.00016-08) [DOI] [PMC free article] [PubMed] [Google Scholar]
- 28.Jackson F. R., Turmelle A. S., Farino D. M., Franka R., McCracken G. F., Rupprecht C. E. 2008. Experimental rabies virus infection of big brown bats (Eptesicus fuscus). J. Wildl. Dis. 44, 612–621 [DOI] [PubMed] [Google Scholar]
- 29.R Development Core Team 2011. R: a language and environment for statistical computing. Vienna, Austria: R Foundation for Statistical Computing; (http://www.R-project.org) [Google Scholar]
- 30.Constantine D., Tierkel E., Kleckner M., Hawkins D. 1968. Rabies in New Mexico carvern bats. Public Health Rep. 83, 303–316 [PMC free article] [PubMed] [Google Scholar]
- 31.Shankar V., Bowen R. A., Davis A. D., Rupprecht C. E., O'Shea T. J. 2004. Rabies in a captive colony of big brown bats (Eptesicus fuscus). J. Wildl. Dis. 40, 403–413 [DOI] [PubMed] [Google Scholar]
- 32.Steece R. R., Altenbach J. J. S. 1989. Prevalence of rabies specific antibodies in the Mexican free-tailed bat (Tadarida brasiliensis mexicana) at Lava Cave, New Mexico. J. Wildl. Dis. 25, 490–496 [DOI] [PubMed] [Google Scholar]
- 33.Dorward W., Schowalter D., Gunson J. 1977. Preliminary studies of bat rabies in Alberta. Can. Vet. J. 18, 341–348 [PMC free article] [PubMed] [Google Scholar]
- 34.Wilkinson G. S. 1984. Reciprocal food sharing in the vampire bat. Nature 308, 181–184 10.1038/308181a0 (doi:10.1038/308181a0) [DOI] [Google Scholar]
- 35.George D. B., Webb C. T., Farnsworth M. L., O'Shea T. J., Bowen R. A., Smith D. L., Stanley T. R., Ellison L. E., Rupprecht C. E. 2011. Host and viral ecology determine bat rabies seasonality and maintenance. Proc. Natl Acad. Sci. USA 108, 10 208–10 213 10.1073/pnas.1010875108 (doi:10.1073/pnas.1010875108) [DOI] [PMC free article] [PubMed] [Google Scholar]
- 36.Anderson R. M., Jackson H. C., May R. M., Smith A. M. 1981. Population dynamics of fox rabies in Europe. Nature 289, 765–771 10.1038/289765a0 (doi:10.1038/289765a0) [DOI] [PubMed] [Google Scholar]
- 37.Hallam T. G., McCracken G. F. 2011. Management of the panzootic white-nose syndrome through culling of bats. Conserv. Biol. 25, 189–194 10.1111/j.1523-1739.2010.01603.x (doi:10.1111/j.1523-1739.2010.01603.x) [DOI] [PubMed] [Google Scholar]
- 38.ProMED-mail. 2011. Hendra virus, equine: Australia (23): (New South Wales). (18 August: 20110818.2512) See http://www.promedmail.org/
- 39.Fornes A., Lord R. D., Kuns M. L., Larghi O. P., Fuenzalida E., Lazara L. 1974. Control of bovine rabies through vampire bat control. J. Wildl. Dis. 10, 310–316 [DOI] [PubMed] [Google Scholar]
- 40.Keeling M. J., Rohani P. 2008. Modeling infectious diseases in humans and animals. Princeton, NJ: Princeton University Press [Google Scholar]
- 41.Biek R., Henderson J. C., Waller L. A., Rupprecht C. E., Real L. A. 2007. A high-resolution genetic signature of demographic and spatial expansion in epizootic rabies virus. Proc. Natl Acad. Sci. USA 104, 7993–7998 10.1073/pnas.0700741104 (doi:10.1073/pnas.0700741104) [DOI] [PMC free article] [PubMed] [Google Scholar]
- 42.Kobayashi Y., Sato G., Kato M., Itou T., Cunha E. M. S., Silva M. V., Mota C. S., Ito F. H., Sakai T. 2007. Genetic diversity of bat rabies viruses in Brazil. Arch. Virol. 152, 1995–2004 10.1007/s00705-007-1033-y (doi:10.1007/s00705-007-1033-y) [DOI] [PubMed] [Google Scholar]
- 43.Burns R. J., Crespom R. F. 1975. Notes on local movement and reproduction of vampire bats in Colima, Mexico. Southwest. Nat. 19, 446–449 [Google Scholar]