Abstract
A MATLAB® toolbox was developed for applying the logistic modeling approach to mammalian cell batch and fed-batch cultures. The programs in the toolbox encompass sensitivity analyses and simulations of the logistic equations in addition to cell specific rate estimation. The toolbox was first used to generate time courses of the sensitivity equations for characterizing the relationship between the logistic variable and the model parameters. Subsequently, the toolbox was used to describe CHO cell data from batch and fed-batch mammalian cell cultures. Cell density, product, glucose, lactate, glutamine, and ammonia data were analyzed for the batch culture while fed-batch analysis included cell density and product concentration. In all instances, experimental data were well described by the logistic equations and the resulting specific rate profiles were representative of the underlying cell physiology. The 6-variable batch culture data set was also used to compare the logistic specific rates with those from polynomial fitting and discrete derivative methods. The polynomial specific rates grossly misrepresented cell behavior in the initial and final stages of culture while those based on discrete derivatives had high variability due to computational artifacts. The utility of logistic specific rates to guide process development activities was demonstrated using specific protein productivity versus growth rate trajectories for the 3 cultures examined in this study. Overall, the computer programs developed in this study enable rapid and robust analysis of data from mammalian cell batch and fed-batch cultures which can help process development and metabolic flux estimation.
Keywords: Cell culture, CHO, Fed-batch, Logistic modeling, Metabolic flux analysis, Specific rates
Introduction
Biopharmaceuticals are therapeutics derived from biotechnology and are increasingly becoming a substantial component of the overall therapeutic landscape (Aggarwal 2007). Mammalian cells continue to be the organism of choice for producing complex biopharmaceuticals because of their ability to perform the desired post translational modifications that are essential for in vivo efficacy (Chu and Robinson 2001). Among the various classes of biopharmaceuticals, monoclonal antibodies are the dominant segment covering a broad range of medical indications and this trends expected to continue in the future (Kozlowski and Swann 2006; Reichert 2009). Fed-batch cultivation remains the method of choice for monoclonal antibody production given its operational simplicity. Stability of the product under culture conditions of elevated temperature, typically 37°C, is a prerequisite for fed-batch operation and this is true for most monoclonal antibodies. The perfusion mode of cultivation is typically limited to unstable products that are not amenable to fed-batch cultivation (Chuppa et al. 1997; Goudar et al. 2007; Trampler et al. 1994).
The typical duration of a mammalian cell fed-batch culture is 12–16 days with starting cell densities in the 0.2–1.0 × 10⁶ cells/mL range resulting in peak cell densities between 10 and 30 × 106 cells/mL. During the initial growth phase, cell viabilities are typically >97% and these values decline towards the end of the culture due to nutrient depletion. A combination of a well designed cell culture medium and robust feeding strategies is essential to maximize protein production and more importantly, to ensure correct and consistent post-translational modifications.
While mechanistic models such as the Monod equation are widely used to describe the dynamics of bacterial cell growth, such an approach is not directly applicable to mammalian cell culture given the complex interaction between multiple nutrients and metabolites. While theoretically feasible, it complicates practical application because a large number of kinetic parameters must be estimated using nonlinear optimization (Pörtner and Schäfer 1996; Tziampazis and Sambanis 1994). For mammalian cell cultures, it is generally accepted that cell specific rates for growth, metabolism, and protein production provide adequate quantitative characterization rather than complex kinetic models. In addition, cell specific rates are inputs for metabolic flux analysis (Stephanopoulos 2002) which further enhances the information content in the experimentally measured data set.
Computing cell specific rates in mammalian cell batch and fed-batch cultures essentially reduces to estimating derivatives of prime variables such as cell density, glucose, lactate, glutamine, ammonia, and product concentration. While the discrete derivative approach has perhaps been most commonly used because of simplicity, the resulting specific rates are very sensitive to measurement errors. Hence, polynomial fitting has been suggested as a more robust alternative (Linz et al. 1997; Ljumggren and Häggström 1994). The relative merits and shortcomings of these specific rate estimation approaches have been discussed before and analysis of data from multiple laboratories that spanned multiple cell lines and bioreactor types and sizes indicated that the logistic modeling approach was the most robust for estimating specific rates for mammalian cell batch and fed-batch cultures (Goudar et al. 2005). Only 3 or 4-parameter logistic models are necessary to fully describe the dynamics of nutrient consumption/product formation and cell growth in mammalian cell cultures and most of the model parameters can be related to biological attributes. This simplicity, coupled with their analytical differentiability, make the logistic models especially suited for specific rate estimation from batch and fed-batch culture data.
The objective of this study was to develop computer programs for robust specific rate estimation from mammalian cell batch and fed-batch cultures using logistic equations. Specifically, a MATLAB® toolbox was developed, which in addition to specific rate computation, also has the capability of sensitivity analysis and a priori simulations of variable time courses which can guide process development activities.
Theory
Batch and fed-batch culture dynamics
The dynamics of mammalian cell growth, metabolite and product formation, and nutrient consumption in batch and fed-batch systems can be described as
 |
1 |
 |
2 |
 |
3 |
where X, P, and N are the viable cell density (VCD), metabolite/product (lactate, ammonia, or recombinant protein of interest), and nutrient (primarily glucose and glutamine) concentrations, respectively, and μ, qP, and qN their respective specific rates. It is generally accepted that cell specific rates as described in Eqs. 1–3 adequately characterize the dynamics of cell growth, metabolism, and protein production in mammalian cell batch and fed-batch cultures.
Information of the variable (X, P, N) derivatives and the bioreactor cell density are necessary for estimating the specific rates from Eqs. 1–3. Since bioreactor cell density is experimentally measured, only the variable derivatives need to be determined, which given the relatively few experimental data points (typically 7–15), are difficult to compute accurately. Furthermore, sampling and measurement errors are amplified when derivatives are determined discretely using two consecutive experimental data points.
Logistic modeling
Logistic equations have been proposed as a robust alternative for describing viable cell density, metabolite/product, and nutrient concentrations in batch and fed-batch cultures (Goudar et al. 2005)
 |
4 |
 |
5 |
 |
6 |
where X, P, and N are nonlinear functions of parameters a1–a4, b1–b3, and c1–c3, respectively, and t is time. Setting  in Eq. 1 results in an exponential decline equation,
  , while setting
  results in an exponential growth equation,
  . It is thus clear from these limiting case exponential expressions that parameters a2 and a4 are analogous to the maximum death (kdmax) and growth (μmax) rates, respectively. In addition, by setting t = 0, a relationship between the initial cell density, X0, and parameters a1 and a3 can be derived as
 |
7 |
Another important attribute of a culture is the time required to reach the maximum cell density, tmax, which can be derived by setting dX/dt = 0
 |
8 |
Setting dP/dt = 0 results in b1 = Pmax, the maximum product concentration. Parameter b3 is analogous to a rate constant (non cell-specific) for product concentration increase while a direct interpretation of parameter b2 is not possible ( ). Parameter c2 in Eq. 6 is a rate constant for nutrient concentration decrease and c1 and c3 are related to Nmax, the maximum nutrient concentration, as Nmax = c1/c3.
A key advantage of the logistic equations is that they are analytically differentiable such that the differential forms of Eqs. 4–6 can be written as
 |
9 |
 |
10 |
 |
11 |
This is important because specific rate estimation from Eqs. 1–3 requires information on X (experimentally measured) and the derivatives of X, P, and N. Since analytical expressions for these derivatives are available, there is no error introduced during derivative estimation resulting in robust specific rate estimates. Thus specific rate estimation using the logistic equations first involves estimating parameters a1–a4, b1–b3, and c1–c3, by fitting experimental data to Eqs. 4–6 by nonlinear least squares, followed by derivative estimations from Eqs. 9–11. Once the derivatives for X, P, and N are known, the specific rates are determined from Eqs. 1–3.
Because X, P, and N in Eqs. 4–6 are nonlinear functions of the model parameters, initial estimates must be determined for use as starting points in nonlinear parameter estimation. This is typically done by a linear transformation of the nonlinear model and setting  in Eq. 4 results in an exponential decline equation,
  , while setting
  results in an exponential growth equation,
  , both of which can be respectively linearized as
 |
12 |
 |
13 |
Initial estimates of a1 and a2 can be obtained by fitting X versus t data from the declining phase to Eq. 12 and those for a3 and a4 by fitting data from the increasing phase to Eq. 13. Setting dP/dt = 0 in Eq. 5 results in Pmax (which can be determined from experimental data) as an initial estimate for b1 while those for b2 and b3 can be obtained from the following lineariziation of Eq. 5
 |
14 |
For Eq. 6, setting dN/dt = 0 results in  and because Nmax can be determined from experimental data, initial estimates for c1–c3 can be obtained from the following lineariziation of Eq. 6
 |
15 |
Logistic modeling of experimental data is thus initiated by obtaining initial estimates of a1–a4, b1–b3, and c1–c3, from Eqs. 12–15 followed by refinement of parameter estimates by nonlinear least squares.
Sensitivity analysis
In order to effectively use Eqs. 4–6 for analyzing data from batch and fed-batch cultures and also for a priori simulations, a good understanding of the dependence of X, P and N on a1–a4, b1–b3, and c1–c3, respectively, is necessary. Sensitivity equations for X can be derived as
 |
16 |
and those for the product concentration which describe the dependence of P on b1–b3 are as follows
 |
17 |
Similarly, the sensitivity equations for nutrient concentration can be derived as
 |
18 |
Analysis of Eqs. 16–18 provides useful insights into the relationships between X, P, and N and their associated parameters.
Materials and methods
Sources of experimental data
Data from mammalian cell batch and fed-batch cultures were used as representative data sets for logistic modeling. The batch data set was from therapeutic protein producing CHO cells cultivated in a 10 L bioreactor and experimental details have been presented earlier (Goudar et al. 2005). Data on viable cell density, product, glucose, lactate, glutamine, and ammonia concentrations were monitored over the course of the cultivation. For fed-batch evaluation, viable cell density and product concentration data from two previously-published industrial cultures were used for analysis. They included a CHO culture expressing human IgG1 MAb 4A1 at a final concentration of 4.1 g/L in a 2 L bioreactor (Combs et al. 2011) and a nonglycosylated human monoclonal antibody producing CHO cell line in a 5 L fed-batch bioreactor with a high final product concentration of 9.8 g/L (Huang et al. 2010). While the evaluation of logistic modeling in this study is limited to the above three experiments, the approach has general applicability for mammalian cell batch and fed-batch cultures.
Computer programs
All computations were performed in MATLAB® (Mathworks, Natick, MA) and a listing of the computer programs is shown in Table 1. Fitting of experimental data to Eqs. 4–6 is performed using programs x_fit, p_fit, and n_fit, respectively, which use Eqs. 12–15 for initial parameter estimation followed by nonlinear least squares using the function fminsearch which uses the Simplex method (Nelder and Mead 1965) for minimizing the error between experimental data and the logistic model fit. Inputs to these programs include experimental data and the outputs include parameter estimates, plots of experimental data and model fit, and specific rate time courses. The sensitivity equations as defined in Eqs. 16–18 can be generated using programs x_SensitivityEquations, p_SensitivityEquations, and n_SensitivityEquations, respectively.
Table 1.
Computer programs for logistic modeling of mammalian cell batch and fed-batch cultures
| Program | Intended use |
|---|---|
| Sensitivity analysis | |
x_SensitivityEquations |
Generates sensitivity curves for X from Eq. 16. Useful for characterizing the influence of a1–a4 on the X time profiles |
p_SensitivityEquations |
Generates sensitivity curves for P from Eq. 17. Useful for characterizing the influence of b1–b3 on the P time profiles |
n_SensitivityEquations |
Generates sensitivity curves for N from Eq. 18. Useful for characterizing the influence of c1–c3 on the N time profiles |
| Logistic modeling | |
x_fit |
Models experimental cell density data. Initial estimates of a1–a4 are determined from Eqs. 12 and 13 and are subsequently used for fitting X data to Eq. 4 by nonlinear least squares |
p_fit |
Models experimental product concentration data. Initial estimates of b1–b3 are determined from Eq. 14 and are subsequently used for fitting P data to Eq. 5 by nonlinear least squares |
n_fit |
Models experimental nutrient concentration data. Initial estimates of c1–c3 are determined from Eq. 15 and are subsequently used for fitting N data to Eq. 6 by nonlinear least squares |
Results and discussion
Sensitivity analysis
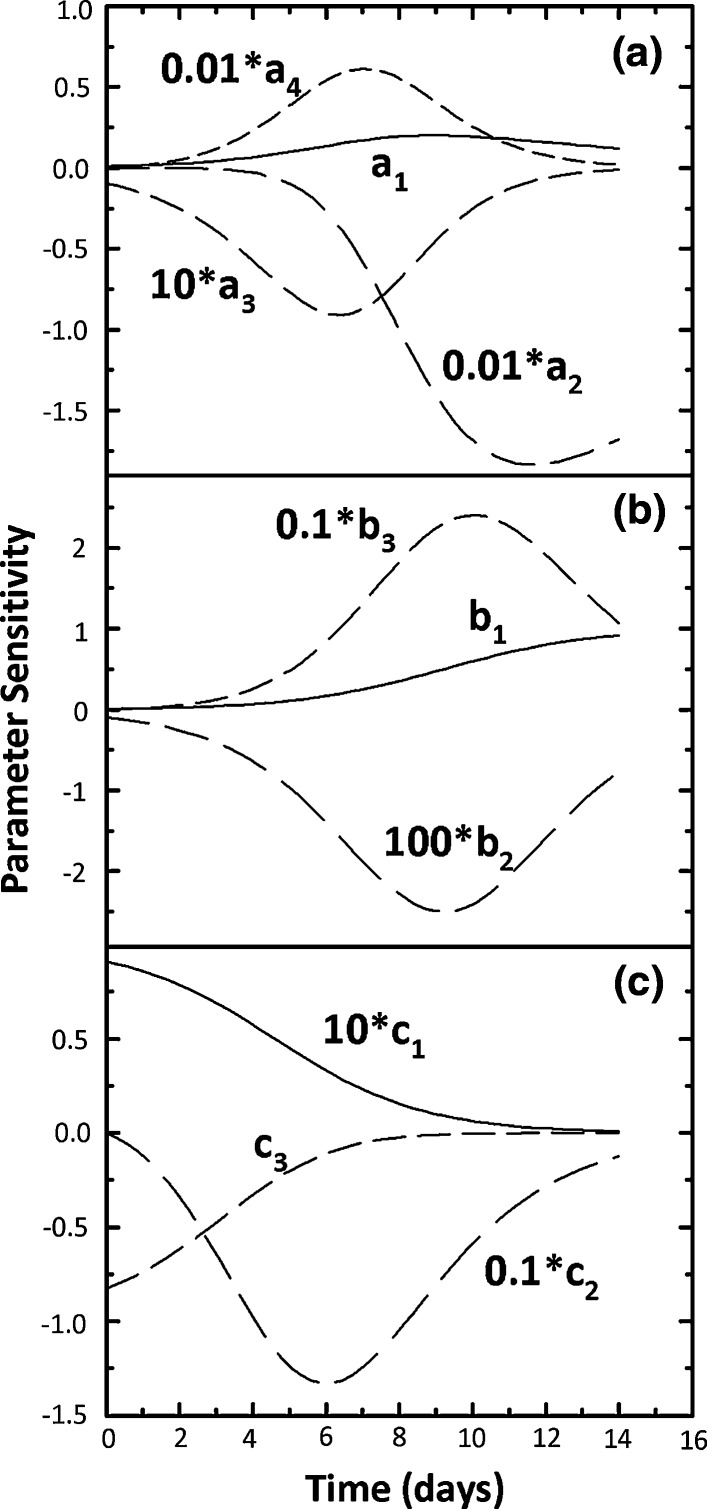
The sensitivity curves as defined by Eqs. 16–18 are shown in Fig. 1 for a1–a4 values of 100 × 106 cells/mL, 0.15 day−1, 100, and 0.5 day−1, b1–b3 values of 10 g/L, 100, and 0.5 day−1 and c1–c3 values of 100 g/L, 0.5 day−1, and 10, respectively. Multiplicative factors for the sensitivity curves are also included in Fig. 1 to compare sensitivity magnitudes among the model parameters. In Fig. 1a, a1 and a4 are positively correlated with X and their sensitivity curves are not proportional. Similar non-proportional sensitivity curves are seen for a2 and a3 which correlate negatively with X. This lack of proportionality is an indication of non-correlated model parameters (Robinson 1985) and is desirable because it increases the robustness of nonlinear parameter estimation. Also the magnitude of dX/da2 was the highest followed by dX/da4 while those for dX/da1 and dX/da3 were 2 and 3 orders of magnitudes lower, respectively, than those for dX/da2 and dX/da4. Clearly, small changes in a2 and a4 have a large impact on X while this is not the case for a1 and a3.
Fig. 1.
Sensitivity curves (Eqs. 16–18) for a1–a4 values of 100 × 106 cells/mL, 0.15 day−1, 100, and 0.5 day−1 (a), b1–b3 values of 10 g/L, 100, and 0.5 day−1 (b) and c1–c3 values of 100 g/L, 0.5 day−1, and 10 (c)
Sensitivity curves for P are shown in Fig. 1b where parameter b3 has the most impact followed by b1 while b2 has the least impact. This lack of sensitivity for b2 suggests that robust estimation of b2 may not be possible during nonlinear parameter estimation. Also, the non-proportional sensitivity curves in Fig. 1b should facilitate unique estimation of b1–b3. Figure 1c shows the sensitivity curves for N where c2 has the most impact. As in Fig. 1a, b, the lack of strong proportional trends for the sensitivity curves in Fig. 1c suggests that correlation between c1–c3 is not severe. However, lower sensitivity for parameter c1 (also a3 in Fig. 1a and b2 in Fig. 1b) might make its robust estimation difficult.
Overall, the exponential terms in Eqs. 4–6 have the most influence on the time courses of X, P, and N and because they are not severely correlated with other model parameters, unique estimation should be possible. Estimates of a3, b2 and c1 are likely to be associated with higher uncertainties and their values must be interpreted with caution, especially in the context of comparing data from multiple experiments. Figure 1 can be reproduced for any desired a1–a4, b1–b3, and c1–c3 values using programs x_SensitivityEquations, p_SensitivityEquations, and n_SensitivityEquations in the logistic modeling toolbox.
Analysis of batch bioreactor data
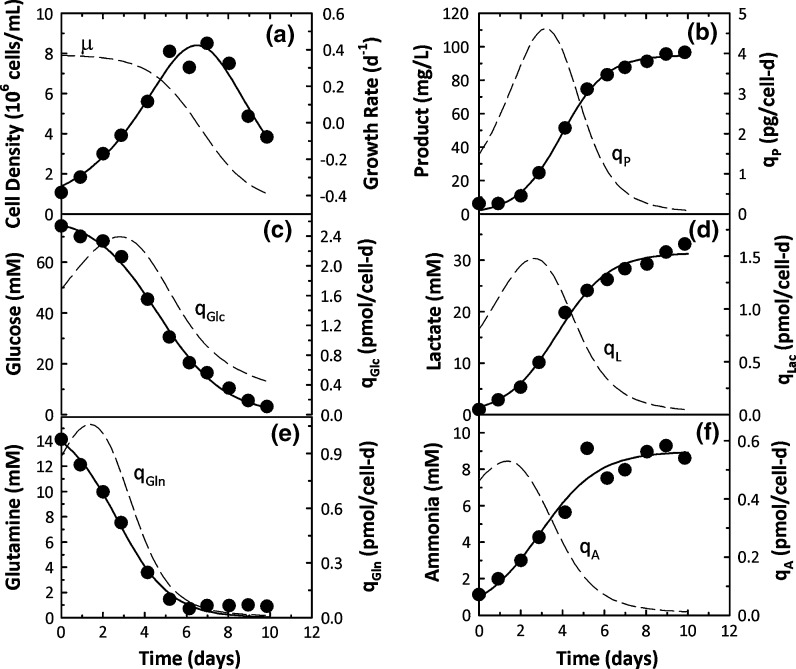
Time profiles of 6 cell culture variables related to cell growth, metabolism, and protein production are shown in Fig. 2a–f along with fits from the logistic equations and the associated specific rates. Eq. 4 was used to fit the cell density data (Fig. 6a) while product, lactate, and ammonia concentrations were described by Eq. 5 and glucose and glutamine concentrations by Eq. 6. In all 6 instances, experimental data were well described by the logistic equations resulting in smooth profiles for the associated specific rates clearly indicating the robustness of the logistic approach to describe mammalian cell batch culture data.
Fig. 2.
Experimental data (points) and logistic fits (solid lines) for cell density, product, nutrient, and metabolite concentrations for CHO cells in batch culture. Specific rates estimated from the logistic fits are shown as dashed lines
Fig. 6.
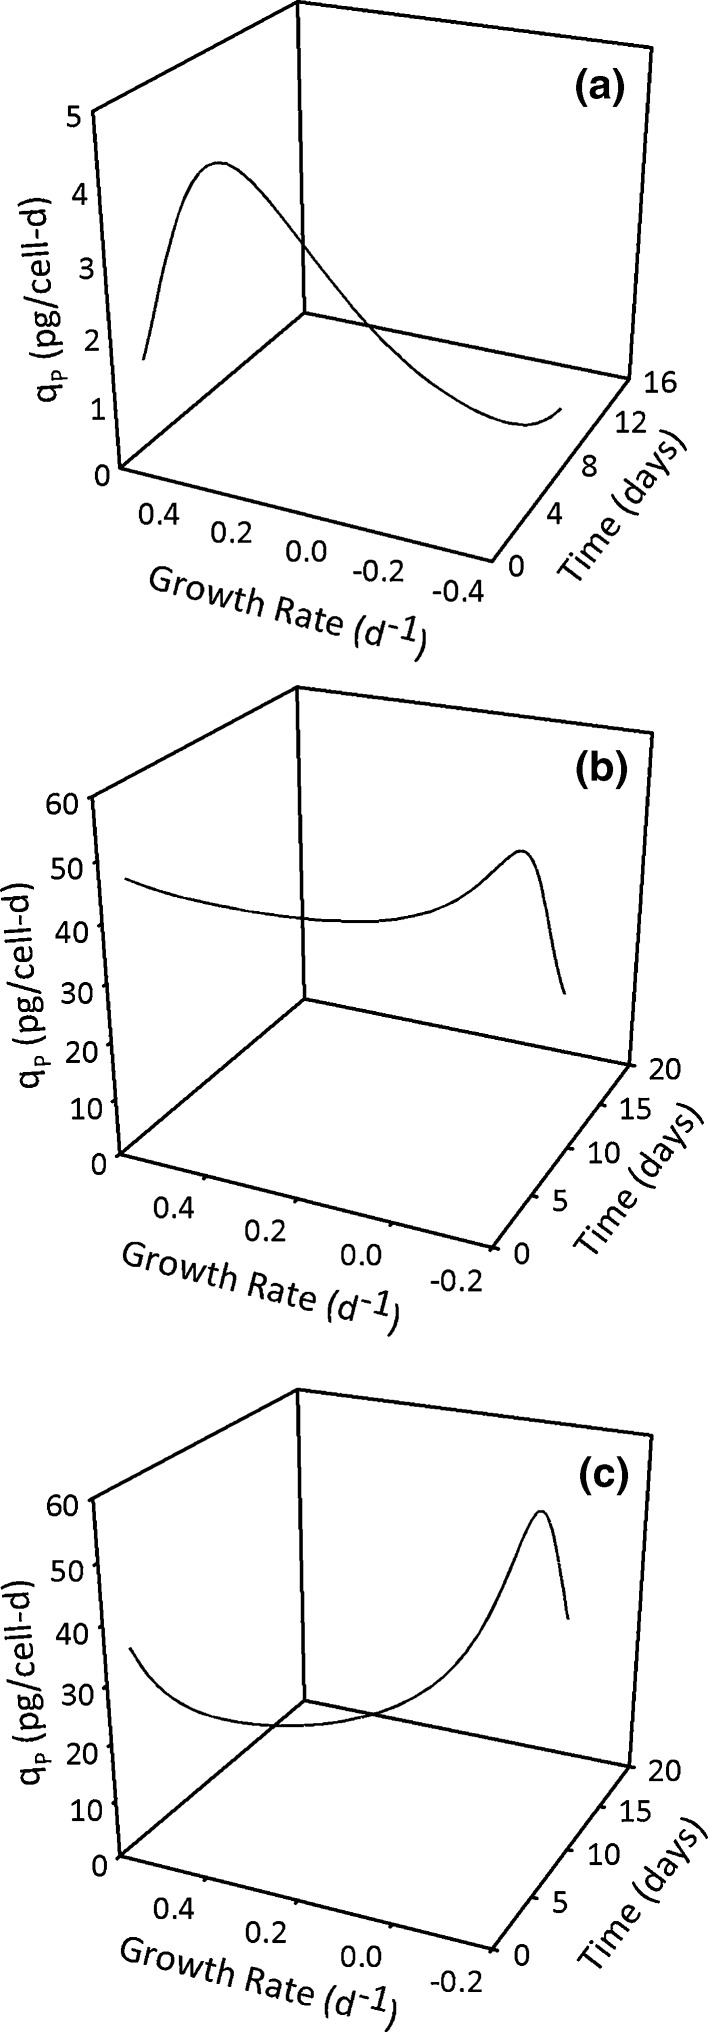
Time profiles of qp and μ estimated from logistic modeling of the experimental data in Figs. 2,3, and 4
The highest growth rates were seen in the first 4 days of culture (Fig. 2a) and were also associated with the highest rates of glucose consumption and lactate production (Fig. 2c, d). Specific productivity exhibited an initial increasing trend, reaching a peak value around day 4 and subsequently declined over the course of the culture (Fig. 2b). Glutamine consumption and ammonia production rates were also the highest at the beginning of the culture and steadily decreased with time (Fig. 2e, f). Overall, strong growth associated trends, both for cell metabolism and protein production, were seen in Fig. 2.
Analysis of fed-batch bioreactor data
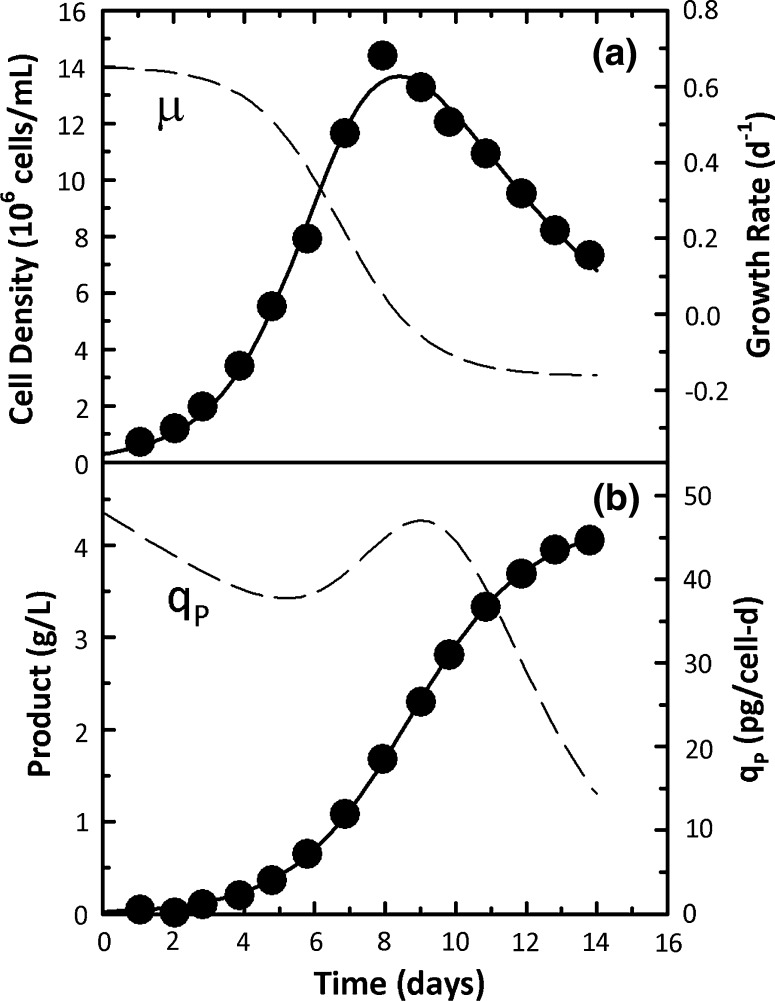
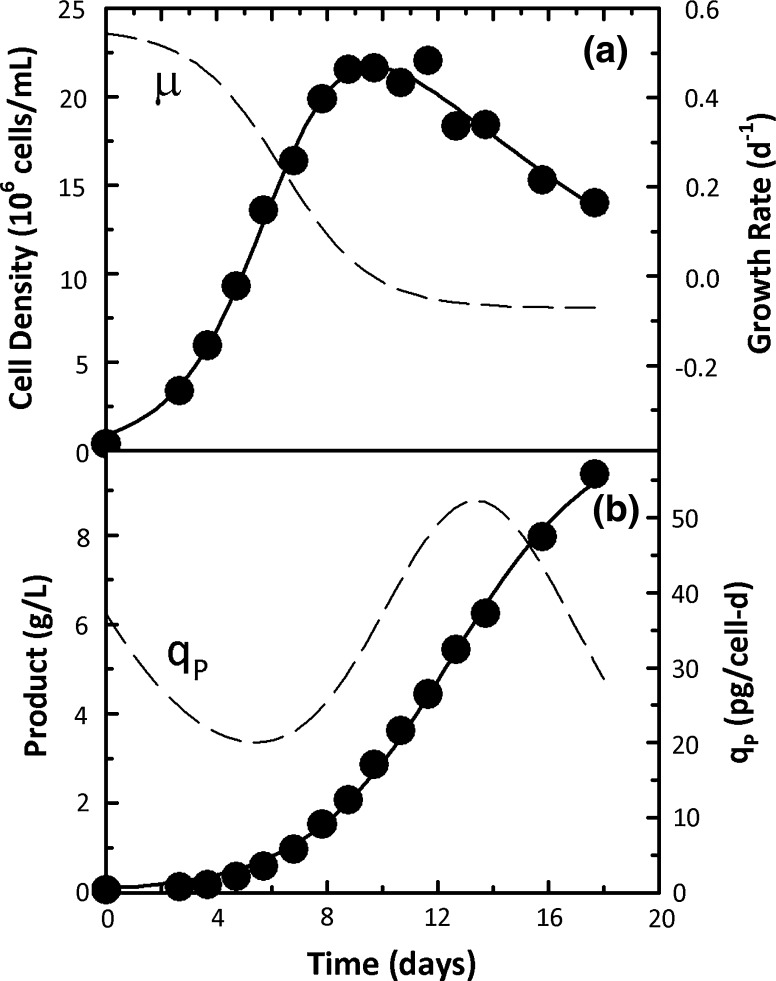
Time profiles of viable cell density and product concentration for the two CHO cell fed-batch cultures are shown in Figs. 3 and 4. The viable cell density data were fit to Eq. 4 while the product concentration data were fit to Eq. 5. In both Figs. 3 and 4, experimental data were well described by the logistic equations resulting in smooth μ and qp profiles. Specific growth rates were the highest in the initial stages of the culture followed by a steady decline and eventually levelled off to a constant death rate that corresponded to declining viable cell density. In Fig. 3b, qp was high from the beginning of the experiment and stayed at these high levels until day 9 when the maximum cell density was reached followed by a sharp decline. In Fig. 4b, an increasing qp trend was seen with a maximum value around day 13 followed by a declining trend.
Fig. 3.
Experimental data (points) and logistic fits (solid lines) for cell density and product concentration data from human IgG1 MAb 4A1 producing CHO cells in a 2L fed-batch bioreactor (Combs et al. 2011). Specific rates estimated from the logistic fits are shown as dashed lines
Fig. 4.
Experimental data (points) and logistic fits (solid lines) for cell density and product concentration data for CHO cells producing a nonglycosylated human monoclonal antibody in a 5L fed-batch bioreactor (Huang et al. 2010). Specific rates estimated from the logistic fits are shown as dashed lines
Logistic parameter estimates (a1–a4 and b1–b3) for the data in Figs. 3 and 4 are shown in Table 2. For both cell density data sets, a2 and a4 were almost identical to kdmax and μmax, respectively, while b1 values for both product concentration data sets were similar to Pmax values. Average qp values were estimated from the qp time courses corresponding to the logistic fit and were 36.5 and 33.3 pg/cell-day, respectively. Despite this similarity in qp averages, the final titers in Figs. 3b and 4b were substantially different. The much higher values in Fig. 4b were due to the higher cell density and longer cultivation time (due to lower kdmax)
Table 2.
Logistic parameters and related variables for antibody producing CHO cells in fed-batch culture
| Viable cell density | Product concentration | ||||
|---|---|---|---|---|---|
| Parameter | Combs et al. (2011) | Huang et al. (2010) | Parameter | Combs et al. (2011) | Huang et al. (2010) |
| a1 (106 cells/mL) | 67.6 | 48.9 | b1 (g/L) | 4.3 | 10.4 |
| a2 (day−1) | 0.16 | 0.07 | b2 | 184.6 | 117.8 |
| a3 | 236.8 | 53.6 | b3 (day−1) | 0.60 | 0.38 |
| a4 (day−1) | 0.65 | 0.55 | Pmax (g/L) | 4.1 | 9.8 |
| tmax (day) | 8.4 | 9.6 | Avg. qP (pg/cell-day) | 36.5 | 33.3 |
| Xmax (106 cells/mL) | 13.7 | 21.7 | Max. qP (pg/cell-day) | 47.6 | 54.4 |
| μmax (day−1) | 0.64 | 0.54 | |||
| kdmax (day−1) | 0.16 | 0.07 | |||
Comparison of the logistic method with discrete derivatives and polynomial fitting methods
Figures 2, 3, and 4 clearly indicate that experimental data from mammalian cell batch and fed-batch cultures can be well described by the logistic equations. More importantly, the resulting specific rates time courses are logically constrained and provide useful insights into cell physiology. Alternate methods such as discrete derivatives and polynomial fitting have also been used to obtain specific rates and some of their shortcomings have been described before (Goudar et al. 2005).
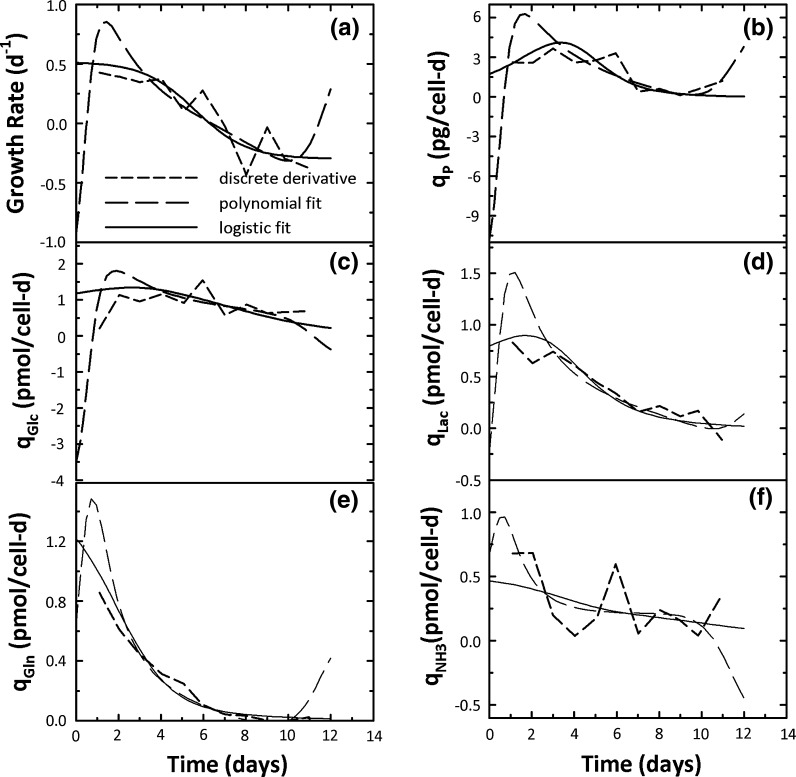
A comparison of specific rate time courses obtained from the discrete derivative, polynomial, and logistic modeling approaches is shown in Fig. 5. In the discrete derivative approach, consecutive data points were used for derivative computation while in the polynomial approach, coefficients from a 4th order polynomial fit to experimental data were used to compute the derivatives analytically. In all instances in Fig. 5, the polynomial specific rates grossly misrepresented cell behavior in the initial portion. For instance, the growth rate estimate from the polynomial fit at t = 0 was −0.93 day−1 (Fig. 5a), clearly a computational artifact and not reflective of cell physiology (positive values are expected since cells divide rapidly in the growth phase). This initial negative value was followed by a rapid increase up to day 3, and between days 3–10, the growth rate estimates from the polynomial and logistic fits were quite similar. Between days 10–12, an increasing trend for the polynomial fit growth rate was seen, again inconsistent with cell physiology towards the end of a fed-batch culture where a constant negative value is expected.
Fig. 5.
A comparison of discrete derivative, polynomial, and logistic specific rates for cell density, product, nutrient, and metabolite concentrations for CHO cells in batch culture
These non-representative polynomial fit growth rate estimates for days 0–3 and 10–12 in Fig. 5a are computational artifacts because the polynomial fit is not confined to the monotonic trends seen in experimental data. The logistic approach does not have this limitation because its underlying structure imposes constraints on the fits and the resulting specific rates. While growth rate estimates from the discrete derivative approach did not grossly misrepresent cell behavior, their time course was characterized by multiple upward and downward trends (Fig. 5a) which were clearly computational artifacts. Only the logistic growth rates in Fig. 5a were characterized by the initial constant high growth rate phase followed by a steady decline and ultimately a plateau at negative values, consistent with cell behavior in a batch system.
Similar to growth rate, non-representative polynomial fit specific rates in the early and late portions were seen in Figs. 5b–f. Specific rates at t = 0 were negative for product, glucose, and lactate concentrations, misrepresenting the culture dynamics. For all variables in Fig. 5, an initial increasing followed by decreasing trend over days 1–3 was seen for all specific rates after which both the polynomial and logistic fit specific rates were consistent until day 10 of the culture. For days 10–12, non-representative specific rates were seen for the polynomial fits, a clear illustration of the disconnect between the polynomial modeling aproach and cell physiology. Specific rates from the discrete derivatives were in general closer to the logistic ones in Figs. 5b–f but a high degree of variability between successive data points was seen with the exception of lactate (Fig. 5d) and glutamine (Fig. 5e). Furthermore, this variability is visually underrepresented in Fig. 5 because the y-axis scale accommodates the large variability in the polynomial fit specific rate data. The Fig. 5 data are a clear indication of the superiority of the logistic approach for obtaining representative specific rates from mammalian cell batch cultures.
Specific rate time courses
Figures 2, 3, 4, and 5 have indicated that the logistic equations result in specific rate estimates whose time profiles are robust representations of the underlying cell physiology. This information can be used to guide process development activities and as an illustration, specific productivity versus growth rate plots as a function of time are shown in Fig. 6 for all the three experiments analyzed in this study. The strongest association between qp and μ was seen in Fig. 6a where higher qp values were seen early in the culture where μ values were high. Subsequent qp decline over the course of the culture was linearly correlated with μ and both quantities had the lowest value at the end of the culture. In contrast, Fig. 6b had a relatively flat qp profile through both the initial high and subsequent declining μ phases and a qp reduction was seen only in the death phase of the culture. With the exception of the initial culture phase (up to 4 h) an inverse correlation between growth and productivity was seen in Fig. 6c up to the onset of the death phase. Similar to Fig. 6b, a rapid qp decline was seen in the death phase of the culture.
Given the diversity of qp versus μ correlations in Fig. 6 (positive in Fig. 6a, no correlation in Fig. 6b and negative in Fig. 6c) different process development approaches are necessary for process optimization. For instance, facilitating rapid cell growth to the highest possible density (through cell culture medium improvements and bioreactor temperature adjustments) can help increase product concentration in Fig. 6a rather than an extension of the culture. In Fig. 6b, an extension of the time required to reach the maximum cell density might be beneficial because this period was associated with high and constant qp values. Extension of the culture beyond 14 days would only offer minimal advantages given the rapidly declining qp and cell density (Fig. 6b) values. For Fig. 6c, accelerating the progress towards the highest cell density could prove beneficial given the increasing qp trend associated with cell density increase. The most benefit appears to be from maintaining the culture at the highest cell densities for the longest possible duration since that period was associated with the highest qp values. Moreover, culture extension beyond 18 days could also help increase product concentration as long as there was no adverse impact on product quality.
Overall, the Fig. 6 data are one of many illustrations of how biologically representative specific rate estimates from logistic modeling can be used for bioprocess optimization. Such an analysis is not possible from the polynomial fit specific rates given their inaccuracy in the initial and final culture phases (Fig. 5). This limitation is also associated with discrete derivative specific rates given their high variability. The Fig. 6 analysis can also be extended to nutrient and metabolite specific rates for additional insights into optimizing nutrient feeding strategies. In addition, specific rates are inputs for metabolic flux analysis and given the error propagation from specific rates into metabolic fluxes (Goudar et al. 2009), the logistic specific rates offer a robust input data set for accurate metabolic flux estimation in mammalian cell batch and fed-batch cultures.
Conclusions
The logistic framework was used to describe experimental data from mammalian cell batch and fed-batch cultures. In all cases, experimental data were well described by the computer programs developed in this study. The resulting specific rate trends were constrained and representative of cell behavior over the entire course of the culture. Specific rate time courses from polynomial fitting, however, misrepresented cell physiology in the initial and final stages of the culture despite good polynomial fits to experimental data while those estimated using discrete derivatives were characterized by high variability due to computational artifacts. These observations highlight the robustness of the logistic approach for modeling data from mammalian cell batch and fed-batch experiments. The computer programs developed in this study allow rapid specific rate estimation which can guide bioprocess development activities and also enable robust estimation of metabolic fluxes from mammalian cell batch and fed-batch cultures.
References
- Aggarwal S. What’s fueling the biotech engine? Nat Biotechnol. 2007;25:1097–1104. doi: 10.1038/nbt1007-1097. [DOI] [PubMed] [Google Scholar]
- Chu L, Robinson DK. Industrial choices for protein production by large-scale cell culture. Curr Opin Biotechnol. 2001;12:180–187. doi: 10.1016/S0958-1669(00)00197-X. [DOI] [PubMed] [Google Scholar]
- Chuppa S, Tsai SP, Yoon S, Shackelford S, Rozales C, Bhat R, Tsay G, Matanguihan R, Konstantinov K, Naveh D. Fermentor temperature as a tool for control of high-density perfusion cultures of mammalian cells. Biotechnol Bioeng. 1997;55:328–338. doi: 10.1002/(SICI)1097-0290(19970720)55:2<328::AID-BIT10>3.0.CO;2-D. [DOI] [PubMed] [Google Scholar]
- Combs RG, Yu E, Roe S, Piatchek MB, Jones HL, Mott J, Kennard ML, Goosney DL, Monteith D. Fed-batch bioreactor performance and cell line stability evaluation of the artificial chromosome expression technology expressing an IgG1 in Chinese hamster ovary cells. Biotechnol Prog. 2011;27:201–208. doi: 10.1002/btpr.505. [DOI] [PubMed] [Google Scholar]
- Goudar CT, Joeris K, Konstantinov K, Piret JM. Logistic equations effectively model mammalian cell batch and fed-batch kinetics by logically constraining the fit. Biotechnol Prog. 2005;21:1109–1118. doi: 10.1021/bp050018j. [DOI] [PubMed] [Google Scholar]
- Goudar CT, Matanguihan R, Long E, Cruz C, Zhang C, Piret JM, Konstantinov KB. Decreased pCO2 accumulation by eliminating bicarbonate addition to high cell-density cultures. Biotechnol Bioeng. 2007;96:1107–1117. doi: 10.1002/bit.21116. [DOI] [PubMed] [Google Scholar]
- Goudar CT, Biener R, Konstantinov KB, Piret JM. Error propagation from prime variables into specific rates and metabolic fluxes for mammalian cells in perfusion culture. Biotechnol Prog. 2009;25:986–998. doi: 10.1002/btpr.155. [DOI] [PubMed] [Google Scholar]
- Huang Y-M, Hu W, Rustandi E, Chang K, Yusuf-Makagiansar H, Ryll T. Maximizing productivity of CHO cell-based fed-batch culture using chemically defined media conditions and typical manufacturing equipment. Biotechnol Prog. 2010;26:1400–1410. doi: 10.1002/btpr.436. [DOI] [PubMed] [Google Scholar]
- Kozlowski S, Swann P. Current and future issues in the manufacturing and development of monoclonal antibodies. Adv Drug Delivery Rev. 2006;58:707–722. doi: 10.1016/j.addr.2006.05.002. [DOI] [PubMed] [Google Scholar]
- Linz M, Zeng AP, Wagner R, Deckwer WD. Stoichiometry, kinetics and regulation of glucose and amino acid metabolism of a recombinant BHK cell line in batch and continuous culture. Biotechnol Prog. 1997;13:453–463. doi: 10.1021/bp970032z. [DOI] [PubMed] [Google Scholar]
- Ljumggren J, Häggström L. Catabolic control of hybridoma cells by glucose and glutamine limited fed batch cultures. Biotechnol Bioeng. 1994;44:808–818. doi: 10.1002/bit.260440706. [DOI] [PubMed] [Google Scholar]
- Nelder JA, Mead R. A simplex method for function minimization. Comput J. 1965;7:308–313. [Google Scholar]
- Pörtner R, Schäfer T. Modelling hybridoma cell growth and metabolism—a comparison of selected models and data. J Biotechnol. 1996;49:119–135. doi: 10.1016/0168-1656(96)01535-0. [DOI] [PubMed] [Google Scholar]
- Reichert JM. Global antibody trends. mAbs. 2009;1:86–87. doi: 10.4161/mabs.1.1.7645. [DOI] [PMC free article] [PubMed] [Google Scholar]
- Robinson JA. Determining microbial kinetic parameters using nonlinear regression analysis. Advantages and limitations in microbial ecology. Adv Microb Ecol. 1985;8:61–114. doi: 10.1007/978-1-4615-9412-3_2. [DOI] [Google Scholar]
- Stephanopoulos G. Metabolic engineering: perspective of a chemical engineer. AIChE J. 2002;48:920–926. doi: 10.1002/aic.690480502. [DOI] [Google Scholar]
- Trampler F, Sonderhoff SA, Pui PW, Kilburn DG, Piret JM. Acoustic cell filter for high density perfusion culture of hybridoma cells. Bio/Technology. 1994;12:281–284. doi: 10.1038/nbt0394-281. [DOI] [PubMed] [Google Scholar]
- Tziampazis E, Sambanis A. Modeling of cell culture processes. Cytotechnology. 1994;14:191–204. doi: 10.1007/BF00749616. [DOI] [PubMed] [Google Scholar]


