

Abstract
Force drift is a significant, yet unresolved, problem in atomic force microscopy (AFM). We show that the primary source of force drift for a popular class of cantilevers is their gold coating, even though they are coated on both sides to minimize drift. Drift of the zero-force position of the cantilever was reduced from 900 nm for gold-coated cantilevers to 70 nm (N =10; rms) for uncoated cantilevers over the first 2 hours after wetting the tip; a majority of these uncoated cantilevers (60%) showed significantly less drift (12 nm, rms). Removing the gold also led to ~10-fold reduction in reflected light, yet short-term (0.1–10 s) force precision improved. Moreover, improved force precision did not require extended settling; most of the cantilevers tested (9 out of 15) achieved sub-pN force precision (0.54 ± 0.02 pN) over a broad bandwidth (0.01–10 Hz) just 30 min after loading. Finally, this precision was maintained while stretching DNA. Hence, removing gold enables both routine and timely access to sub-pN force precision in liquid over extended periods (100 s). We expect that many current and future applications of AFM can immediately benefit from these improvements in force stability and precision.
Keywords: Atomic force microscopy, scanning probe microscopy, single molecule force spectroscopy, drift, overstretching DNA, cantilever
In atomic force microscopy (AFM), drift is a long-standing problem that limits a range of applications in biology1 and, more generally, in nanoscience.2 We have previously addressed positional drift between the tip and sample, achieving atomic-scale (0.1 nm) tip-sample stability in three dimensions via optical stabilization.3 Yet, if one wants to make precise measurements over long periods (seconds to tens of minutes), positional drift is only part of the problem. Force drift also occurs.1,2 Force drift is particularly troublesome in force spectroscopy, an exciting class of experiments that includes mechanically unfolding and refolding individual proteins.4–10 A related problem is the extended periods of time, often hours or even overnight,11 required for the AFM to “settle” after loading an AFM tip. Ideally, one could routinely load cantilevers and have effectively zero force drift after a minimal settling time.
Many AFM-based experiments would also benefit from sub-picoNewton (pN) force precision, which has yet to be achieved over a broad bandwidth in liquid. Sub-pN force precision in a limited bandwidth has been demonstrated for protein folding using lock-in detection.12 However, this approach limits the force detection to a narrow bandwidth around the drive frequency (20 Hz), and complicates interpretation due to a significant drive amplitude (5 nm). Thus, both force stability and force precision in liquid need improvement. For broad utility, such improvements should use commercially available cantilevers.
Force measurements with AFM rely on an underlying assumption: changes in tip deflection (Δz) arise only from changes in the applied force (F). Or, in other words, the zero-force position of the cantilever (z0) does not depend on time. Force is then determined using F= −kΔ z = −k(ztip −z0) where k is the cantilever stiffness and ztip the instantaneous deflection of the cantilever (Figure 1a). In this letter, we show that, for an important class of silicon nitride cantilevers, z0 is not constant, but drifts significantly. Further, we show that the short-term (0.1–10 s) and the long-term (minutes to hours) force noise of these soft (k = 5–60 pN/nm) cantilevers is dominated by the gold coating. By removing the gold and the underlying chromium, we achieved a force precision of ~0.5 pN over a broad bandwidth (0.01–10 Hz) in liquid with a minimal settling time.
Figure 1.
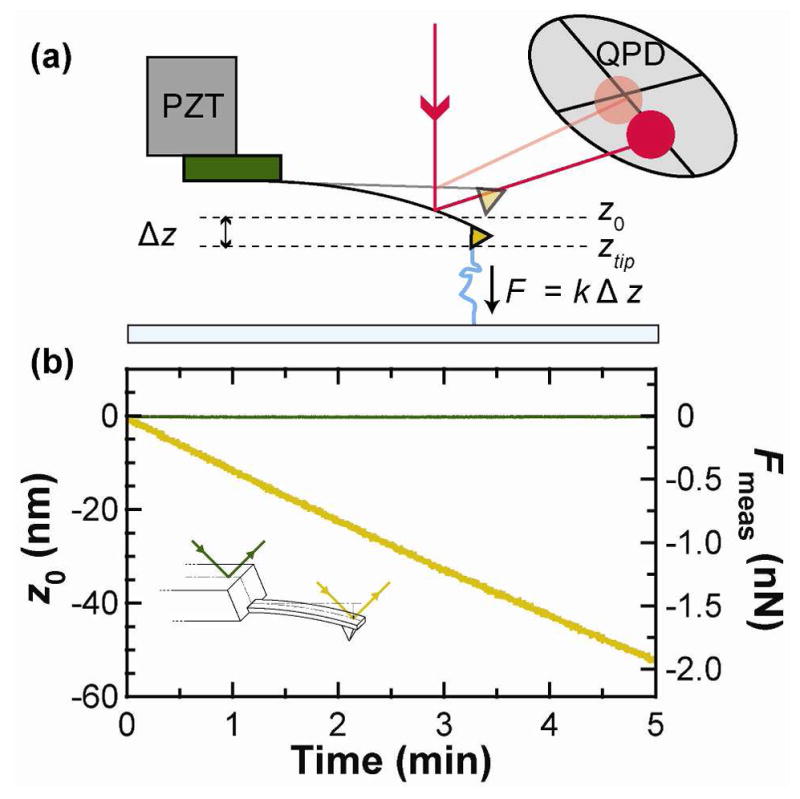
The cantilever is the primary source of force drift. (a) Schematic of a force spectroscopy experiment. The AFM tip is attached to a molecule and retracted from the surface. The force that the molecule exerts on the cantilever is determined by the deflection (ztip-z0), as measured on a quadrant photodiode (QPD). (b) With no molecule attached, the zero force position z0 (gold) of a cantilever (short Biolever) was measured as a function of time two hours after wetting. A similar record (green) was measured after repositioning the detection laser onto the chip holding the cantilever and scaled using the cantilever’s sensitivity (S = 0.043 V/nm) and stiffness (k = 37 pN/nm). This comparison demonstrates that the primary source of force drift is the cantilever.
Cantilevers are coated in gold primarily to enhance reflectivity, which is assumed to increase the signal-to-noise ratio.13 Yet, coating cantilevers only on the back side leads to a substantial thermal-induced force drift due to the bimetallic effect.14,15 Coating the cantilever on both sides maintains increased sensitivity while minimizing such temperature-induced drift (e.g., Supporting Information Figure S1).
Even for fully coated cantilevers, recent work points to material properties of the gold coating itself as the primary limit to low-frequency force precision.16 Paolino and Bellon uncovered this effect by measuring the positional power spectral density (PSD) of gold-coated and uncoated silicon cantilevers (k = 200 pN/nm) in air at room temperature.16 The main difference in the PSDs was at low frequency (f) in a bandwidth (3–100 Hz) well below the resonance frequency of the cantilever. Specifically, the low-frequency PSD of the gold-coated cantilevers rose as 1/f while those of the uncoated cantilevers remained flat, leading to a ~100-fold difference in the PSD at 3 Hz. The authors quantitatively modeled their data by incorporating a viscoelastic term into the mechanical response of the cantilever. More qualitatively, gold’s contribution to low-frequency force noise is described with terms like “cracking” and “aging”— in scientific discussions, if not often in the scientific literature.
We sought to determine the relevance of Paolino and Bellon’s work to biophysics by exploring (i) long times (hours), (ii) a liquid environment, (iii) softer cantilevers (5–60 pN/nm), and (iv) effects of a nearby surface. Our work focused on changes in z0 over hours as well as a bandwidth (0.01–10 Hz) useful for force spectroscopy. Force spectroscopy, like most biological applications of AFM, is done in liquid, where viscous damping is much larger than in air. Also, force spectroscopy typically uses the softest cantilevers available, where the positional PSD in liquid is >100-fold larger at low frequency (~1 Hz) than for the stiffer cantilevers (k = 200 pN/nm) in air. This difference arises because soft cantilevers are no longer resonant when they are within a few hundred nanometers of the surface.17 Rather, they are overdamped due to the increased hydrodynamic drag that distributes the thermal energy over a broad bandwidth.
A simple test using a commercial AFM (Cypher, Asylum Research) pointed to the cantilever as the primary source of force noise in liquid for a fully coated cantilever. In this test,14 we compared the drift of the cantilever to the apparent drift of the chip on which the cantilever was mounted (Figure 1b, inset). More specifically, we loaded a cantilever (k = 37 pN/nm, short Biolever, Olympus), let the AFM settle for 1 hr, and measured z0 for 5 min. Next, we positioned the detection laser to reflect off of the chip and acquired data for another 5 min. We determined an effective force drift for the chip by using the cantilever’s spring constant and sensitivity (S = 0.043 V/nm). As shown in Figure 1b, the drift rate on this cantilever (gold) was ~800-fold higher than effective drift rate on the chip (380 vs 0.5 pN/min, respectively). This experiment isolated the cantilever as the primary source of drift, rather than the external opto-mechanical system (e.g., laser-pointing noise, mechanical drift in the QPD, and voltage drift in the electronics).
Long-term drift in z0 was substantial, moving beyond the range of the AFM’s detection system. We accommodated this drift by periodically re-zeroing the QPD. Specifically, we mounted long Biolevers [k = 6 pN/nm (nominal); Olympus], performed a sensitivity calibration, retracted the tip 100 nm, and then started data acquisition. Every 5 min, the tip was touched to the surface, repositioned 100 nm above the surface, and the QPD was rezeroed. Individual 5-min records (Figures S2 and S3) were algorithmically stitched together into single long records (Figure 2). Using this protocol, we quantified drift over arbitrarily long periods, limited by evaporation from the fluid cell (a difficulty in our semi-arid climate).
Figure 2.

Drift in the zero force position (z0) on gold-coated (gold) versus uncoated (blue) cantilevers. (a) Three-hour-long traces of z0 show that gold-coated cantilevers drift significantly more than uncoated ones. (b) Ten-fold expanded scale shows residual drift on uncoated cantilevers.
All the gold-coated cantilevers tested exhibited significant drift in the initial several hours after mounting (Figure 2a, gold). The sign of the initial drift was not constant, nor was the drift monotonic. Hence, the transiently low drift rate seen in several traces did not imply a stable z0 was being reached. Rather, many of these traces showed an onset of substantial drift in the opposite direction. Therefore, a single observation of low drift at a particular time does not guarantee low force drift during subsequent experiments. Finally, independent of the details of individual records, the magnitude of this drift and its persistence is noteworthy.
We speculated that the cause of the drift was the laser damaging the gold. Under this hypothesis, the drift rate should be a function of laser intensity. Hence, we measured z0 for 100 s at three hours after mounting at different intensities both on the commercial AFM and on our custom AFM.3 The latter’s detection laser was very stable (~0.002%; Δf = 0.02–100 Hz). The resulting long-term drift rate on both instruments was independent of the laser power (Figure S4), suggesting that slow drift in z0 is not caused by straightforward light-induced effects.
In contrast, removing the gold from the cantilever had a profound effect on drift (Figure 2b, blue). Drift for uncoated long Biolevers was reduced 10-fold over 2 hrs in comparison to gold-coated ones: 70 nm vs. 900 nm (N = 10, rms), respectively. Moreover, a majority (60%) of the uncoated cantilevers were even quieter, with an average drift of 12 nm (rms). We obtained similar results for two other types of cantilevers (short Biolever and Biolever Mini; Figure S5) and using the custom AFM (Figure S6). Hence, gold was the primary cause of long-term drift in z0. This result is consistent with prior work using a variety of cantilevers and conditions (e.g., cantilevers coated on one side in liquid,14,15,18 and partially19 or fully16 coated on one side in air).
Removing the gold coating came with a ~10-fold loss in reflectivity from the cantilever. On the commercial AFM, this loss led to a substantial decrease in sensitivity (volts per nanometer) (Figure 3a). Despite the reduced reflectivity, uncoated cantilevers showed improved precision, both in position and in force. To highlight these improvements, we measured z0 for 100 s at ~3 hrs after mounting a long Biolever (Figure 3b). The trace for an uncoated cantilever (Figure 3b, blue) shows significantly less drift than one using a gold-coated cantilever (Figure 3b, gold). The PSD of uncoated records show less positional noise than corresponding gold-coated records (Figure 3c). Moreover, this improvement existed over three decades of bandwidth (0.01–10 Hz). At higher frequencies, the coated cantilevers had comparable noise to uncoated ones. Hence, reduced reflectivity does not limit the force precision. Rather, the gold coating limits force precision and stability on both short- and long-time scales (Figure 3d), a result confirmed on the custom AFM, which did not have reduced sensitivity due to differences in electronics (Figure S6 and S7). We expect that this insight will generalize to other classes of cantilevers, instruments and assays, as long as there is sufficient light incident upon the QPD so that signal is not limited by detector noise. To illustrate this generalization, improved force precision was maintained when using an uncoated cantilever in conjunction with a gold-coated substrate (Figure S8), a common surface preparation in biophysics20,21 and nanoscience.22,23
Figure 3.

Effect of gold removal on sensitivity and precision. (a) Sensitivity of gold-coated (gold) and uncoated (blue) cantilevers. (b) Time records of zero-force position (z0) for gold-coated (k = 6.8 pN/nm) and uncoated (k = 7.1 pN/nm) cantilevers. High-bandwidth data (2.5 kHz) is shown in dark colors and smoothed data (10 Hz) in light colors. Note that, while the gold-coated cantilever has an approximately linear drift, there can be significant short-term fluctuations. (c) Averaged power spectral density of five consecutive 100 s records such as those shown in (b). (d) Integrated force noise from the records shown in (c). Data taken on the commercial AFM.
Next, we investigated which cantilever yielded the best force precision, focusing on a popular class of cantilevers used in biophysical experiments (Figure 4). Specifically, we measured the positional and force noise for an uncoated Biolever Mini (k = 58 pN/nm; l = 38 μm), a short Biolever (k = 20 pN/nm; l = 60 μm), and a long Biolever (k = 6.2 pN/nm; l = 100 μm), all from Olympus. At the lowest frequencies, the positional PSDs of all three cantilevers were nearly identical, showing that instrumental noise dominated over thermal noise (Figure 4a). The crossover to thermally limited positional noise occurs when the PSD response becomes flat with respect to frequency. In this thermal regime, the smaller cantilevers had less positional noise, as expected.24 To determine which cantilever exhibited the highest force precision, we calculated the force PSD by scaling the positional PSD by the cantilever stiffness (Figure 4b). Our data show that while all three cantilevers had nominally similar force spectral sensitivity (~0.1 pN/√Hz) around 10–500 Hz, the shortest cantilever was the quietest, also as expected. However, at low frequencies where instrumental drift dominated, long Biolevers had decreased force noise because of their lower stiffness. We also note that the force precision depends weakly on the height of the cantilever over the surface (Figure S9).
Figure 4.

Noise on three different uncoated cantilevers. (a) Positional power spectral density (PSD) based on five consecutive 100 s records for a long Biolever (blue, k = 6.2 pN/nm), short Biolever (pink, k = 20 pN/nm), and Biolever Mini (orange, k = 58 pN/nm). Low-frequency positional noise was the same for each cantilever, since it was dominated by instrument noise. (b) Force PSD determined from the data in (a). (c) Integrated force noise shows that the softest lever has the lowest total noise over the full bandwidth of the measurement.
While spectral sensitivity is a common metric in AFM, many biophysical assays are sensitive to the total applied force. Thus, the crucial metric is the integrated force noise in a particular bandwidth. This bandwidth needs to encapsulate the total duration of the experiment, so that the dynamics under study are not altered. State-of-the-art AFM-based force spectroscopy experiments last up to ~10 s.5,11 We chose a 100 s window to encompass these and future studies. With this metric, the long Biolever showed 1 pN force precision from 0.01–76 Hz, while the short Biolever and the Biolever Mini had 1.9 pN and 4.7 pN of noise, respectively. Hence the softest cantilever studied, the long Biolever, exhibited the best force precision (Figure 4c).
Why does the longer and softer cantilever yield the best force precision? This result runs counter to the traditional wisdom for AFM. Typically one expects the best force precision to be achieved with shorter cantilevers with a reduced drag coefficient (β).25 This expectation is based on the fluctuation-dissipation theorem, which yields a force precision of . However, this theorem assumes that thermal fluctuations limit detection. Our work highlights that for applications on time scales longer than ~1 s, thermal noise does not limit the force precision.
Ideally, sub-pN force precision and stability would be routinely accessible without extended settling time using a commercial cantilever and instrument. To demonstrate this, we measured fifteen uncoated long Biolevers 30 min after wetting using the commercial AFM (Table S1). The average force precision of all fifteen cantilevers was 1.0 ± 0.7 pN (0.01–10 Hz) based on five consecutive 100 s records for each cantilever. Moreover, a majority (9 out of 15) of the cantilevers tested had a force precision below 1 pN (0.54 ± 0.02 pN). Hence, the simple removal of gold enables routine access to sub-pN force precision just 30 min after mounting.
This sub-pN force precision was also achieved in a common single-molecule biophysics assay, stretching DNA.20,26–29 DNA was nonspecifically adsorbed onto mica, and the tip was pressed onto the surface. In the first experiment, we retracted the stage at a slow velocity (vstage = 400 nm/s). The resulting force-extension curve was very quiet by AFM standards and shows the canonical overstretching transition at ~65 pN (Figure 5a).30,31 We quantified the force precision by stretching a DNA molecule that was attached to the tip by >30 nm and holding it at variable extensions for ~100 s (Figure 5b). Analysis shows that the force stability and precision was excellent, as demonstrated by full bandwidth records smoothed to 10 Hz (effective data rate = 20 pts/s). When the integrated force noise was calculated, we achieved better than 0.6 pN force precision (0.01–10 Hz) on three different cantilevers (Figure 5c).
Figure 5.

Stretching DNA with uncoated cantilevers exhibits sub-pN force stability. (a) Force-extension curve of DNA at a 400 nm/s pulling velocity. The high-bandwidth data (2.5 kHz) for approach (light pink) and retraction curve (light purple) was smoothed (100 Hz, purple and red). (b) Force-versus-time trace smoothed to 10 Hz while holding DNA at constant extension at 22.6 pN (pink), 27.1 pN (blue), and 62.1 pN (green). High-bandwidth data are shown in light colors and traces displaced for clarity. (c) Integrated force noise of traces shown in (b).
Force stability in single molecule force spectroscopy is now limited by tip-sample drift and the stability of the bio-molecular attachments, which is typically based on nonspecific adsorption. For live cell assays needing serum-based medium, removing gold dramatically reduces the long-term drift (Figure S10a). However, force precision in serum is worse than in buffer alone, consistent with particulates diffusing through the detector beam (Figure S10b,c).
In calculating force for AFM, researchers have typically assumed that the zero-force position of the cantilever was constant. Our work shows that this is a poor assumption for a fully gold-coated cantilever, even several hours after mounting a tip. However, the simple removal of gold led to sub-pN force precision 30 min after mounting for a majority of cantilevers tested, even though the cantilever’s reflectivity was reduced. Further, removing the gold dramatically reduced long-term drift. We speculate that the long-term drift in z0 over hours is tied to the mechanical stress of wetting. It is not uncommon for soft cantilevers to fold backwards and stick to the chip (Figure S11). One would expect that the residual stress after such a significant mechanical deflection is large. Within this hypothesis, such large deformations must affect gold-coated cantilevers differently than uncoated cantilevers. Moreover, the exact mechanics of wetting may be highly variable and therefore lead to the observed variability in the drift of nominally identical cantilevers. Independent of the exact mechanism, sub-pN force sensitivity, which is typically associated with optical traps and magnetic tweezers,24 is now routinely accessible with a commercial AFM in liquid using a simple modification to popular commercial cantilevers. Our results should generalize to any AFM with a sufficiently sensitive and stable detection system. Thus, we expect that this enhancement in AFM’s core function — measuring force — can immediately benefit research in biophysics and nanoscience.
Supplementary Material
Acknowledgments
The authors thank Jason Cleveland and Deron Walters for fruitful discussions. This work was supported by an NIH Molecular Biophysics Training Scholarship (ABC, T32 GM-065103), a Burroughs Wellcome Fund Career Award at the Scientific Interface (GMK), a Butcher Grant, the National Science Foundation [DBI-0923544, Phys-1125844, & MCB-1054832 (GMK)], and NIST. Mention of commercial products is for information only; it does not imply NIST’s recommendation or endorsement. TTP is a staff member of NIST’s Quantum Physics Division.
Footnotes
Supporting information available
Detailed description of removal of gold from cantilevers, DNA pulling, and spring constant calibration procedure. Further, we show raw long-time drift records; drift related to temperature and laser intensity; measurements of drift from various cantilevers; drift and noise data acquired with the custom AFM; force measurement on a gold-coated substrate; force stability in 2% horse serum; and electron micrographs of a folded cantilever and the resulting degradation of its gold coating. This material is available free of charge via the Internet at http://pubs.acs.org.
References
- 1.Casuso I, Scheuring S. Nanotechnology. 2010;21 doi: 10.1088/0957-4484/21/3/035104. [DOI] [PubMed] [Google Scholar]
- 2.Beyder A, Spagnoli C, Sachs F. Rev Sci Instrum. 2006;77 doi: 10.1063/1.2534889. [DOI] [PubMed] [Google Scholar]
- 3.King GM, Carter AR, Churnside AB, Eberle LS, Perkins TT. Nano Lett. 2009;9:1451. doi: 10.1021/nl803298q. [DOI] [PMC free article] [PubMed] [Google Scholar]
- 4.Rief M, Gautel M, Oesterhelt F, Fernandez JM, Gaub HE. Science. 1997;276:1109. doi: 10.1126/science.276.5315.1109. [DOI] [PubMed] [Google Scholar]
- 5.Fernandez JM, Li H. Science. 2004;303:1674. doi: 10.1126/science.1092497. [DOI] [PubMed] [Google Scholar]
- 6.Cecconi C, Shank EA, Bustamante C, Marqusee S. Science. 2005;309:2057. doi: 10.1126/science.1116702. [DOI] [PubMed] [Google Scholar]
- 7.Kessler M, Gottschalk KE, Janovjak H, Muller DJ, Gaub HE. J Mol Biol. 2006;357:644. doi: 10.1016/j.jmb.2005.12.065. [DOI] [PubMed] [Google Scholar]
- 8.Oesterhelt F, Oesterhelt D, Pfeiffer M, Engel A, Gaub HE, Muller DJ. Science. 2000;288:143. doi: 10.1126/science.288.5463.143. [DOI] [PubMed] [Google Scholar]
- 9.Stigler J, Ziegler F, Gieseke A, Gebhardt JC, Rief M. Science. 2011;334:512. doi: 10.1126/science.1207598. [DOI] [PubMed] [Google Scholar]
- 10.Hoffmann A, Woodside MT. Angew Chem Int Edit. 2011;50:12643. doi: 10.1002/anie.201104033. [DOI] [PubMed] [Google Scholar]
- 11.Junker JP, Ziegler F, Rief M. Science. 2009;323:633. doi: 10.1126/science.1166191. [DOI] [PubMed] [Google Scholar]
- 12.Schlierf M, Berkemeier F, Rief M. Biophys J. 2007;93:3989. doi: 10.1529/biophysj.107.114397. [DOI] [PMC free article] [PubMed] [Google Scholar]
- 13.Bippes CA, Muller DJ. Rep Prog Phys. 2011;74 [Google Scholar]
- 14.Radmacher M, Cleveland JP, Hansma PK. Scanning. 1995;17:117. [Google Scholar]
- 15.Wenzler LA, Moyes GL, Beebe TP. Rev Sci Instrum. 1996;67:4191. [Google Scholar]
- 16.Paolino P, Bellon L. Nanotechnology. 2009;20:405705. doi: 10.1088/0957-4484/20/40/405705. [DOI] [PubMed] [Google Scholar]
- 17.Kawakami M, Taniguchi Y, Hiratsuka Y, Shimoike M, Smith DA. Langmuir. 2010;26:1002. doi: 10.1021/la902472h. [DOI] [PubMed] [Google Scholar]
- 18.Shekhawat GS, Chand A, Sharma S, Verawati Dravid VP. Appl Phys Lett. 2009;95 doi: 10.1063/1.3251779. [DOI] [PMC free article] [PubMed] [Google Scholar]
- 19.Labuda A, Bates JR, Grütter PH. Nanotechnology. 2012;23:025503. doi: 10.1088/0957-4484/23/2/025503. [DOI] [PubMed] [Google Scholar]
- 20.Noy A, Vezenov DV, Kayyem JF, Meade TJ, Lieber CM. Chem Biol. 1997;4:519. doi: 10.1016/s1074-5521(97)90324-0. [DOI] [PubMed] [Google Scholar]
- 21.Denis FA, Hanarp P, Sutherland DS, Gold J, Mustin C, Rouxhet PG, Dufrene YF. Langmuir. 2002;18:819. [Google Scholar]
- 22.Piner RD, Zhu J, Xu F, Hong S, Mirkin CA. Science. 1999;283:661. doi: 10.1126/science.283.5402.661. [DOI] [PubMed] [Google Scholar]
- 23.Liu MZ, Amro NA, Chow CS, Liu GY. Nano Lett. 2002;2:863. [Google Scholar]
- 24.Greenleaf WJ, Woodside MT, Block SM. Ann Rev Bioph Biom. 2007;36:171. doi: 10.1146/annurev.biophys.36.101106.101451. [DOI] [PMC free article] [PubMed] [Google Scholar]
- 25.Viani MB, Schaffer TE, Chand A, Rief M, Gaub HE, Hansma PK. J Appl Phys. 1999;86:2258. [Google Scholar]
- 26.Bustamante C, Bryant Z, Smith SB. Nature. 2003;421:423. doi: 10.1038/nature01405. [DOI] [PubMed] [Google Scholar]
- 27.Rief M, Clausen-Schaumann H, Gaub HE. Nat Struct Biol. 1999;6:346. doi: 10.1038/7582. [DOI] [PubMed] [Google Scholar]
- 28.Clausen-Schaumann H, Rief M, Tolksdorf C, Gaub HE. Biophys J. 2000;78:1997. doi: 10.1016/S0006-3495(00)76747-6. [DOI] [PMC free article] [PubMed] [Google Scholar]
- 29.Liu N, Bu T, Song Y, Zhang W, Li J, Shen J, Li H. Langmuir. 2010;26:9491. doi: 10.1021/la100037z. [DOI] [PubMed] [Google Scholar]
- 30.Smith SB, Cui Y, Bustamante C. Science. 1996;271:795. doi: 10.1126/science.271.5250.795. [DOI] [PubMed] [Google Scholar]
- 31.Cluzel P, Lebrun A, Heller C, Lavery R, Viovy JL, Chatenay D, Caron F. Science. 1996;271:792. doi: 10.1126/science.271.5250.792. [DOI] [PubMed] [Google Scholar]
Associated Data
This section collects any data citations, data availability statements, or supplementary materials included in this article.