Abstract
Phosphorylated peptides and proteins play an important role in normal cellular activities, e.g., gene expression, mitosis, differentiation, proliferation, and apoptosis, as well as tumor initiation, progression and metastasis. However, technical hurdles hinder the use of common fractionation methods to capture phosphopeptides from complex biological fluids such as human sera. Herein, we present the development of a dual strategy material that offers enhanced capture of low molecular weight phosphoproteins: mesoporous silica thin films with precisely engineered pore sizes that sterically select for molecular size combined with chemically selective surface modifications (i.e. Ga3+, Ti4+ and Zr4+) that target phosphoroproteins. These materials provide high reproducibility (CV = 18%) and increase the stability of the captured proteins by excluding degrading enzymes, such as trypsin. The chemical and physical properties of the composite mesoporous thin films were characterized by X-ray diffraction, transmission electron microscopy, X-ray photoelectron spectroscopy, energy dispersive X-ray spectroscopy and ellipsometry. Using mass spectroscopy and biostatistics analysis, the enrichment efficiency of different metal ions immobilized on mesoporous silica chips was investigated. The novel technology reported provides a platform capable of efficiently profiling the serum proteome for biomarker discovery, forensic sampling, and routine diagnostic applications.
Introduction
Protein phosphorylation, as a molecular switch, functions in signaling pathways that drive cell division, proliferation, and apoptosis.1–4 This process is regulated by protein kinases and protein phosphatases. Deregulation of these two classes of enzymes has been linked to the etiology of several human diseases, including cancer. Phosphorylation of oncoproteins is a major contributing event in human cancer,5,6 for example, the constitutive phosphorylation and activation of the Bcr-Abl protein tyrosine kinase in Philadelphia chromosome-positive leukemia,7 the Her-2 receptor tyrosine kinase in breast cancer,8 and the EGFR receptor tyrosine kinase in multiple cancer types.9 Activation of these kinases may also trigger phosphorylation cascades affecting proteins downstream of the primary signal transduction pathway. Many enzymes that regulate protein phosphorylation are the focus of current drug discovery efforts. In fact, most of the recently developed cancer targeted drugs are based on inhibition or degradation of protein kinases, such as the small molecule drugs imatinib (a Bcr-Abl inhibitor)10,11 and gefitinib (an EGFR inhibitor),12,13 and the biological drugs trastuzumab (a Her-2 antibody)14 and cetuximab (an EGFR antibody).15 Additionally, regulation of protein phosphorylation also plays a key role in the treatment of human diseases by conventional chemotherapies; for example, paclitaxel treatment causes cell arrest at G2/M phase, and results in a unique phosphorylation pattern of anaphase-promoting complex proteins.16 By tracking the spectrum of phosphoproteins and their metabolites, it is highly possible to predict therapeutic outcomes of drug treatment. Early detection of phosphorylation of such key oncoproteins and/or their downstream substrates will dramatically improve treatment of cancer and other human diseases.17
Human blood contains a multitude of unstudied and unknown biomarkers that could reflect the ongoing pathological state of diseases such as cancers.18–20 Tumor vasculatures are extremely heterogeneous and permeable, with large pores ranging from 300 nm to over 700 nm in different tumor models. This allows interstitial proteins to leak into the blood circulation. Dead cells from necrotic and hemorrhagic areas also shed into the blood stream. These proteins and protein fragments, many of them phosphorylated small peptides, form unique cancer signatures. Since serum is dominated by high molecular weight proteins such as albumin and other carrier proteins, it is a challenge to isolate these small peptides from the serum proteome.
Recent advances in phosphoproteomics analysis has shed light on the mechanisms of disease progression and has contributed to the identification of biomarkers.21,22 The most common approach has been separation of proteins and peptides by 2-D gel electrophoresis followed by mass spectrometry.23,24 However, it is challenging to isolate small proteins and peptides with this approach. Protein phosphorylation is a dynamic process,25 so although at least one-third of all cellular proteins are estimated to be phosphorylated, their levels of phosphorylation can vary dramatically: from less than 1% to greater than 90%.26 Fittingly, new technologies designed for the enrichment of phosphopeptides have drawn great attention.27,28 Specific surface methods such as immobilized metal ion affinity chromatography (IMAC),29–35 metal oxide affinity chromatography (MOAC),36,37 ion-exchange chromatography38–40 and the preparation of IMAC on porous silicon substrates or silica nanoparticles41,42 have been explored in the past. However, novel approaches with more selectivity, specificity and higher throughput are needed to identify and detect these low molecular weight (LMW) and/or low abundance phosphoproteins and their metabolites from complex biological fluids such as human serum.
We previously reported the development of mesoporous silica (MPS) chips as the main vehicle for rapid on-chip fractionation.43–46 Since the pore sizes in the silica chips are around 4 nm in diameter, only small proteins and peptides can enter the pores, and thus be enriched in the chips and separated from the bulky of plasma proteins when serum samples were applied. Another advantage of the nano-size pores in the silica chips is that the small proteins and peptides become inaccessible to proteinases. They can be used to store precious samples for months.44 The ability of these chips to enrich previously undetectable LMW peptides opens the door to identification and analysis of these low abundance species by matrix-assisted laser desorption/ionization time-of-flight mass spectroscopy (MALDI-TOF MS) whose spectra would otherwise be clouded by larger, more abundant serum proteins. In this study, we present the post-synthetic functionalization of MPS chips for the purpose of enriching LMW phosphoproteins. To this end, metal ion species – zirconium(iv), gallium(iii) and titanium(iv) – similar to those used for metal affinity chromatography, have been immobilized onto the surface of MPS chips. These species are known to possess strong affinity for phosphate groups via coordination covalent bonds27 and increase the affinity of the MPS films for phosphorylated proteins. Post-functionalization of the MPS platform reduces the detectable concentration threshold, effectively augmenting the sensitivity and enhancing the ability of this phosphoprotein-specific technique to resolve the difference between a modified protein and its unmodified precursor.
Experimental
Fabrication of mesoporous silica chips
A typical preparation of the porous silica coating sol is as follows: 14 ml of tetraethyl orthosilicate (TEOS) (Sigma-Aldrich Co.) is dissolved in a mixture of 15 ml of ethanol, 6.5 ml of distilled water, and 0.5 ml of 6M HCl and stirred for 2 h at 75 °C to form a clear sol. Separately, 1.8 g of Pluronic F127 (Gifted by BASF Co.) was dissolved in 10 ml of ethanol by stirring at room temperature followed by the addition of 0.5 ml of deionized water to form a homogeneous polymer solution. The coating solution was prepared by mixing 7.5 ml of the silicate sol into the F127 solution followed by stirring of this solution for 0.5 h at room temperature. The pH of the mixture should remain around 1.5. The final sol was deposited on a silicon (1 0 0) wafer by spin-coating at a rate of 1500 rpm for 20 s. The thickness of the film was controlled by adjusting the concentration of polymer in the precursor solution, while the porosity mainly depends on the molar ratio of polymer and silicate in the starting material. To increase the degree of polymerization of the silica framework in the films and to further improve thermal stability, the as-deposited films were placed in an oven at 80 °C for 12 h. The films were then thermally calcinated at 425 °C in air to remove the organic surfactant. The furnace was heated at a rate of 1 °C per min and the furnace was maintained at the final temperature for 5 h. Afterwards the oven was cooled to room temperature over 10 h.
Chemical modification on chip surfaces
The mesoporous silica chip was pre-treated by oxygen plasma to establish a saturated hydroxyl-terminated surface. The treatment was performed in a Plasma Asher (March Plasma System) with an O2 flow rate at 80 sccm and a power of 300 W for 10 min. Surface phosphorylation was carried out via immersion of the chips in 80 ml of fresh 5 mM phosphorous oxychloride (POCl3, Sigma-Aldrich Co.) and 10 mM triethylamine (Sigma-Aldrich Co.) in acetonitrile (Fisher Scientific Co.) for 6 h at room temperature. The chips were spun dry using a spin-coater at a spin speed of 2500 rpm followed by overnight immersion in an aqueous solution of 5 mM zirconium(iv) oxychloride octahydrate/titanium(iv) chloride (Sigma-Aldrich Co.) at room temperature (see . S1 in the ESI†). Ga3+ was immobilized on the pore surface by immersing oxygen plasma-treated MPS chips43 in an aqueous solution of 5 mM gallium isopropoxide overnight at room temperature. The surfaces were rinsed with deionized H2O and spun dry at a spin speed of 3000 rpm for 20 s. Finally, the chips were heated at 120 °C for 30 min to remove residual water.
Characterization techniques
Several characterization techniques were used to study the spin-coated mesoporous silica thin films. The thicknesses of the thin films and their porosities were measured by fitting the Cauchy and Effective Medium Approximation (EMA) models with spectra collected using a variable angle spectroscopic ellipsometer (J. A. Woollam Co. M-2000DI) and modeling with WVASE32 software. Ellipsometric optical quantities, the phase (Δ), and amplitude (ψ), were acquired from spectra at incident angles of 65°, 70°, and 75° using wavelengths from 300 to 1800 nm. In the Cauchy model, the top layer’s thickness, refractive index, and model fit parameters An, Bn and Cn were determined by fitting experimental data with the model and minimizing the mean square error (usually less than 10). The EMA model was used to perform an iterative model fitting that took estimated porosity, film thickness and composition as inputs. These model outputs were subsequently matched against the obtained experimental curves in order to determine the optimal values for each of the fitted parameters. These values are presented in Table 1. X-Ray diffraction (XRD) patterns were obtained on a Philips X’Pert-MPD system with Cu-Kα ray (45 kV, 40 mA). θ–2θ scanning was recorded from all spin-coated films at 1 s/0.001° step over the angle range from 0.2° to 6°. Transmission electron microscopy (TEM; FEI Technai; FEI Co.) was used to acquire plan-view micrographs of the mesoporous silica thin films at an acceleration voltage of 200 kV. An EDX detector attached to the TEM was employed to analyze the chemical composition of the functionalized porous silica. X-Ray photoelectron spectroscopy (XPS) was performed using an X-ray photoelectron spectrometer (Kratos Axis Ultra) with a monochromated Al-Kα X-ray source (hν = 1486.5 eV.) Hybrid optics (simultaneously employing magnetic and electrostatic lens), a multi-channel plate, and delay line detector coupled to a hemispherical analyzer were used. The photoelectron take off angle was normal to the surface.
Table 1.
The ellipsometry, EDX quantitative analysis and contact angle results of an MPS chip and its different functionalized derivatives. (Each result is the average number from 15 spot tests.)
| Film thickness/nm | Film porosity (%) | Atomic % of metal (EDX) | Atomic % of metal (XPS) | Surface contact angle (°) | |
|---|---|---|---|---|---|
| MPS | 798.20 ± 8.22 | 55.27 ± 0.06 | 0 | 0 | 4.90 ± 0.24 |
| MPS/Ga3+ | 801.97 ± 10.04 | 46.47 ± 0.05 | Ga: 0.45 ± 0.04 | Ga: 0.55 | 5.13 ± 0.39 |
| MPS/Ti4+ | 813.01 ± 13.53 | 43.84 ± 0.06 | Ti: 0.55 ± 0.10 | Ti: 1.47 | 5.93 ± 0.27 |
| MPS/Zr4+ | 810.11 ± 5.27 | 46.83 ± 0.03 | Zr: 1.01 ± 0.07 | Zr: 2.01 | 5.65 ± 0.54 |
Phosphoproteins sample preparation
Phosvitin from egg yolk (Sigma-Aldrich Co) and α-casein from bovine milk (Sigma-Aldrich Co) were prepared per manufacturer’s instructions; 10 µg of each protein was trypsinized (Trpsin profile IGD kit, Sigma-Aldrich, Co) overnight at 37 °C. The trypsinized protein solution was then split into two halves. One was processed by on-chip fractionation directly as described below. In the other one, 10 µl of phosphatase (Sigma-Aldrich Co) was added and incubated at 30 °C for 30 min prior to on-chip fractionation. 10 µg of phosvitin was treated with the procedure described above as a control. For serum enrichment, 5 µg of trypsinized phosphoproteins were added into 1 ml of human serum (Sigma-Aldrich Co).
On-chip serum fractionation
For each experiment, a 5 µl sample of serum or proteins was transferred by automatic pipette onto the porous surface of the chip. The samples were incubated for 30 min at 25 °C (room temperature) in a humidity chamber to prevent evaporation. The samples were washed 5 times with 10 µl of sterile, deionized water to remove surface bound material. Peptides and proteins were eluted from the pores using a 1 : 1 (v/v) mixture of acetonitrile and 0.1% trifluoroacetic acid (TFA) (Sigma).
Matrix assistant laser deposition/ionization mass spectrometry (MALDI MS)
A matrix mixture (1 : 1) of 5 mg ml−1 α-cyano-4-hydroxycin-namic acid (CHCA, Sigma) in acetonitrile (Fluka) with 0.1% TFA (Sigma) was used for LMW peptide MALDI analysis. Each eluted sample was mixed with the matrix mixture in a 1 : 1.5 ratio and spotted on the MALDI plate in triplicate. During the interaction with TFA, all of the peptides and small proteins eluted from the nanopores became positively charged, so the positive mode was used to detect the signals of the proteins. Mass spectra were acquired on an AB 4700 Proteomics TOF/TOF analyzer (Applied Biosystems, Framingham, MA) in both linear positive-ion and reflection modes, using a 355 nm Nd-YAG laser. LMW proteins and peptides with m/z of 10 000–30 000 Da and 700–4000 Da were selected for the linear and reflection mode, respectively. For the linear mode, instrument settings were optimized at an acceleration voltage of 20 kV, grid voltage of 18.8 kV, focus mass of 4000 Da, and low mass gate of 700. For reflection mode, instrument settings were optimized at an acceleration voltage of 20 kV, grid voltage of 14 kV, focus mass of 2500 Da, and low mass gate of 700. Data Explorer software version 4.8 (Applied Biosystems) was used to process the raw spectra.
Statistical analysis
Processed data was imported into SpecAlign software for analysis. Peak Alignment by Fast Fourier Transform (PAFFT) correlation was used to align all spectra and their intensities normalized to total ion current (TIC). All spectra were smoothed and de-noised with factor of 4 and 0.5 respectively. Peaks were detected with a baseline of 0.5, mass window of 21 and height ratio 1.5; negative values were removed before analysis. Hierarchical clustering was performed using Cluster software and visualized with MapleTree. MALDI MS Data (m/z peak intensities) were log-transformed, normalized, and median-centered. Pearson correlation was used to calculate the statistical distance between the samples, and complete linkage clustering was performed. An unsupervised clustering was performed for peaks automatically picked.
Results and discussion
Synthesis and characterization of functionalized MPS chips
Zr4+ and Ti4+ are immobilized on the interior and exterior surfaces of the mesoporous film using terminal phosphate groups,47 by which each metal cation shares oxygen atoms with monohydrogen phosphate groups, as shown in Fig. S1.‡ Strong coordination covalent bonds formed between the metal ions and phosphate molecules maintain very stable and consistent interactions across the surface of the chip. The attached Zr4+ or Ti4+ ions maintain their ability to react with the phosphate groups of guest molecules. Ga3+ is immobilized on the pore surface by immersing oxygen plasma treated MPS chips43 in the aqueous solution of gallium isopropoxide. Table 1 lists the average ellipsometry, EDX, and contact angle results of the original MPS chip and its functionalized counterpart. As shown, the respective thickness and surface hydrophilicity are relatively unchanged despite the application of various surface modifications. However, their porosities decrease due to the conjugation of different metal ions and acid groups. A study previously reported by Kim and Lee has demonstrated that the thickness of zirconium phosphate monolayer films on phosphorylated silicon is approximately 0.7 nm. Assuming the nanopores have a uniform spherical structure, the coating would reduce the original pore size, leading to a subsequent reduction of the porosity from 55.27% to 35.03%. The porosities obtained from the ellipsometry fit analysis indicate a smaller percentage decrease, which can be attributed to the interconnected mesostructure possessed by MPS and to the incomplete penetration of the zirconium phosphate coating into the silica film thickness. While XPS only provides information regarding the relative elemental composition on the sample surface, the EDX results, indicative of elemental composition at a greater penetration depth, show atomic proportions consistent with this hypothesis. Since the peptides and proteins we hope to harvest are larger than the coating precursors, the lack of complete penetration of the phosphate coating should not affect negatively the ability of the films to capture successfully LMW targets.
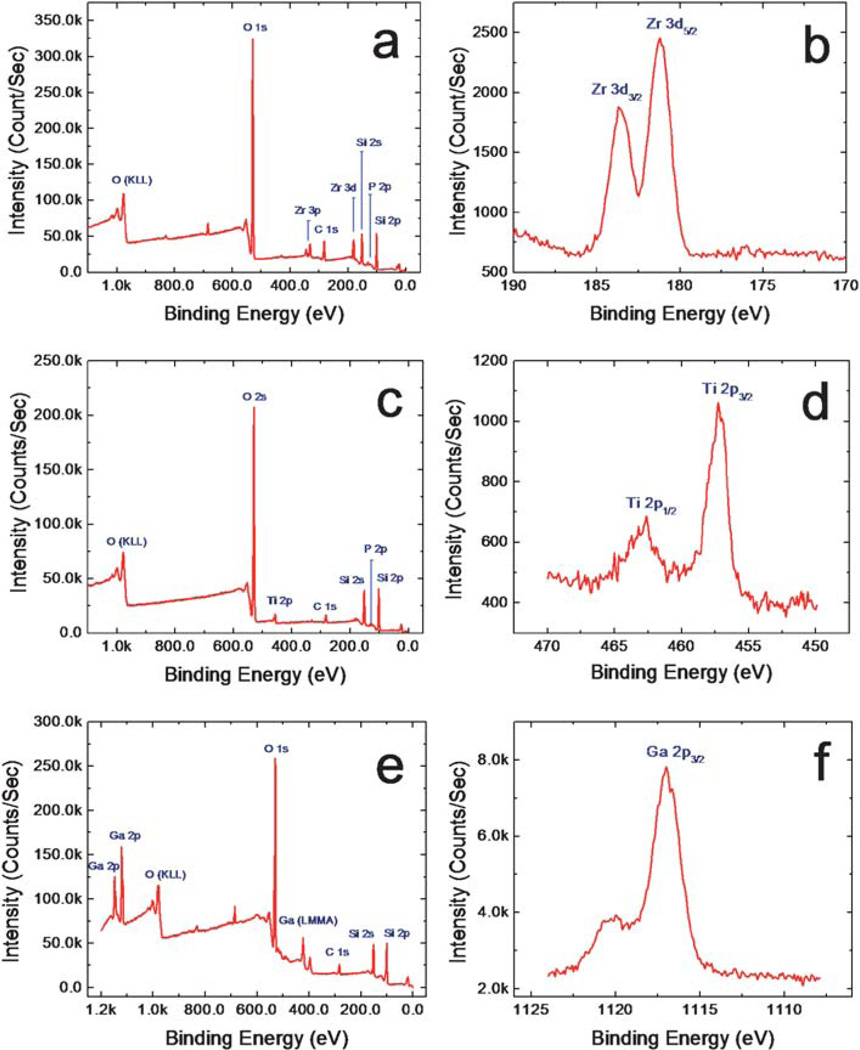
In order to confirm the successful functionalization of our mesoporous silica chips, we carried out elemental analysis using XPS for Zr4+ (Fig. 1a and b), Ti4+ (Fig.1c and d) and Ga3+ (Fig. 1e and f). As shown in Fig. 1a, 1c and 1e, all of the collected survey spectra show strong peaks corresponding to O 1s (531 eV), Si 2p (99.3 eV), and Si 2s (151 eV); the strong peak at 981.5 eV is an oxygen Auger peak. Quantitative analysis of non-Auger peaks was conducted using high resolution spectra and reveals an oxygen-to-silicon ratio close to 2 : 1, indicative of the silica which constitutes our mesoporous silica thin film platform. Additionally, Fig. 1a, 1c and 1e contain weak C 1s (284.5 eV) peaks, which can be attributed to the presence of surface contaminants, and a weak P 2p (131 eV) peak, which is due to the phosphate group used to link the hydroxy-terminated silica surface with desired metal ion species. Fig. 1b shows the XPS core level spectrum of the immobilized zirconium ion by way of a phosphonate chelating linker, revealing a pair of sharp, symmetric Zr 3d peaks. The presence of these peaks, as well as secondary Zr 3p peaks at 330–340 eV, confirms the presence of zirconium on the surface of our modified MPS chips and validates our conjugation method. Fig. 1d and 1f are high-resolution spectra of the characteristic peaks corresponding to titanium (Ti 2p1/2: 464 eV, 2p3/2: 457 eV) and gallium (Ga 2p: 1117 eV), respectively. Gallium’s presence is also indicated by an Auger peak at 420.5 eV which can be seen in Fig. 1e. Weak F 1s (685.7 eV) and F Auger (833.0 eV) peaks in Fig. 1a and 1e can be attributed to trace contaminants most likely resulting from hydrofluoric acid treatment prior to film coating. These peaks are unlabeled and their presence does not undermine the strength of our conclusions.
Fig. 1.
XPS survey scans providing the elemental composition of the functionalized pore surfaces (a, Zr4+, c. Ti4+ and e. Ga3+), and XPS high resolution scans of the core elements providing information about the immobilized metal ions (b, Zr4+, d. Ti4+ and f. Ga3+).
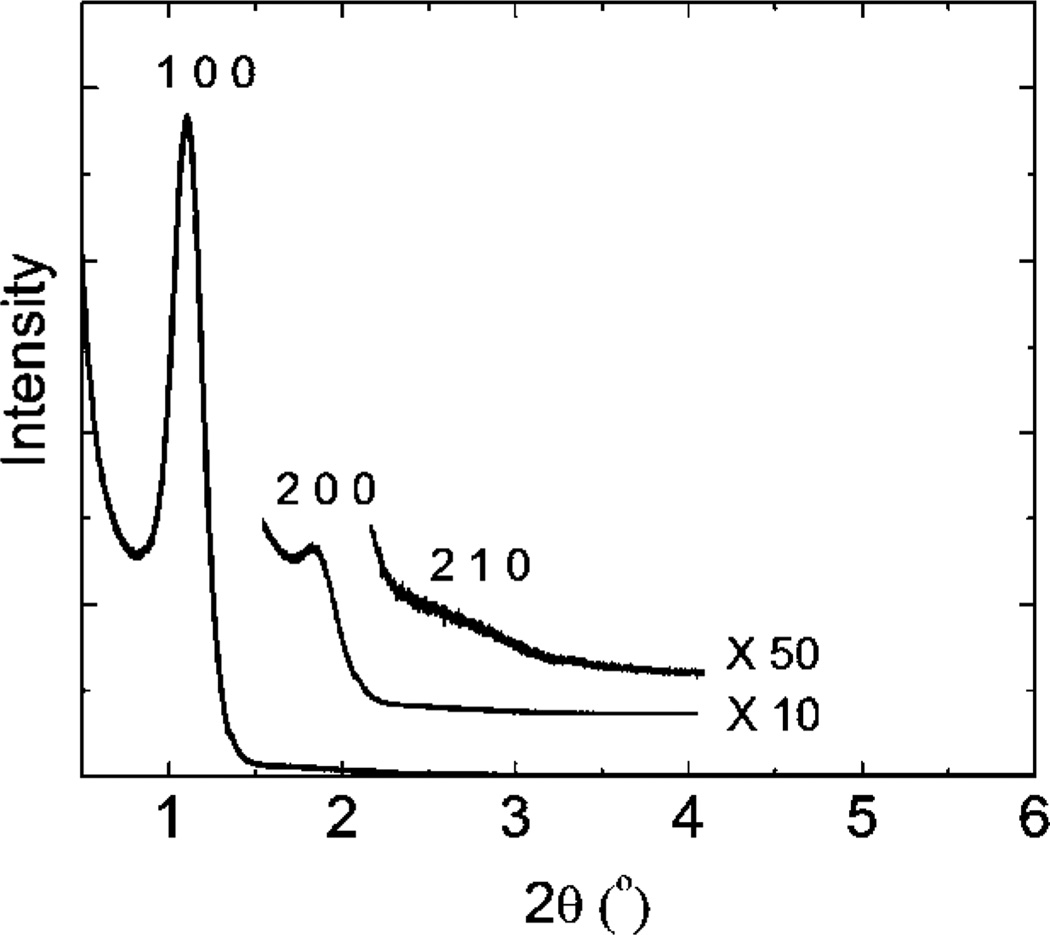
As shown in Fig. 2, calcined MPS chips templated with triblock polymer F127 exhibited a well-resolved XRD pattern with a sharp diffraction peak and two low intensity diffraction peaks corresponding to d-spacings of 8.22, 4.10, and 3.10 nm, respectively. These three diffraction peaks can be further indexed as (100), (200), and (210), planes characteristic of hexagonally arranged mesostructures. Functionalized MPS chips show consistent nanostructures with cell parameters similar to the prefunctionalized chips, indicating that postsynthetic modification using metal ions preserves the hexagonal order of the nanopores.
Fig. 2.
Small angle XRD patterns (0.2–6°) for the MPS thin film.
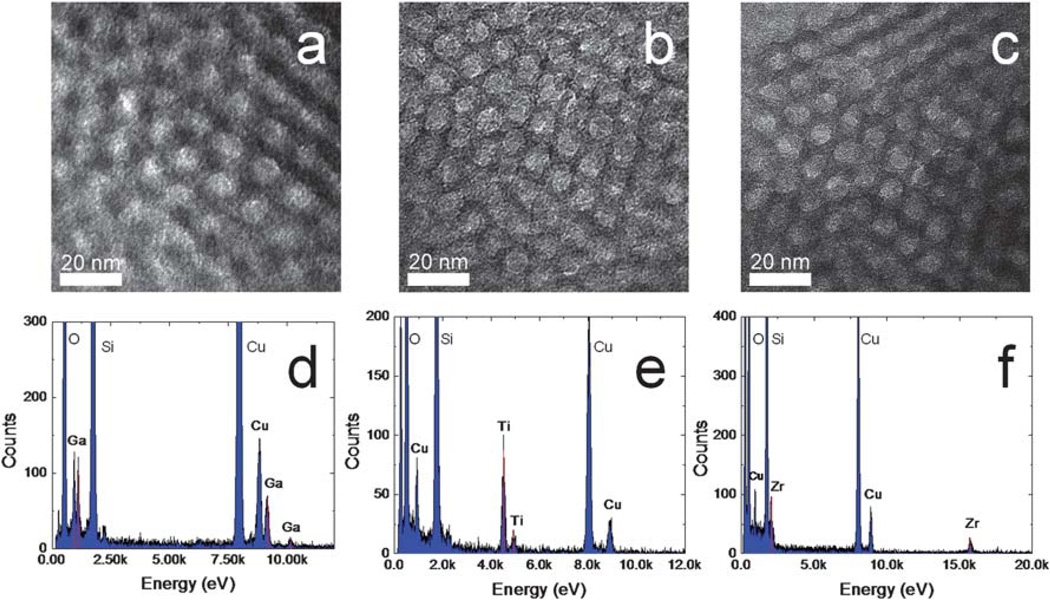
Fig. 3a, 3b and 3c show TEM micrographs of the metal ion immobilized MPS chips. The pores are shown to be uniformly distributed across the imaged area and, in accordance with the obtained XRD data, present themselves in a hexagonal nanoporous structure. Fig. 3d, 3e and 3f show EDX spectra corresponding to each of the imaged TEM samples. EDX peaks for Si (1.740 keV), O (0.523 keV), C (0.282 keV), and Cu (8.041 keV) are seen on each of the displayed spectra, indicating the silica thin film and background of the TEM sample grid. More importantly, the EDX also detects peaks characteristic of each of the functionalizing metals: Ga (Kα: 9.243 keV, Lα1: 1.096 keV), Ti (Kα: 4.508 keV), and Zr (Kα: 15.746 keV, Lα1: 2.042 keV) on Fig. 3d, 3e, respectively. Their atomic percentages have been listed in Table 1.
Fig. 3.
TEM imaging of the MPS thin film functionalized by (a) Ga3+, (b) Ti4+ and (c) Zr4+ and their EDX spectra: (d) Ga3+, (e) Ti4+ and (f) Zr4+.
Phosphoprotein enrichment by mesoporous silica (MPS) chips
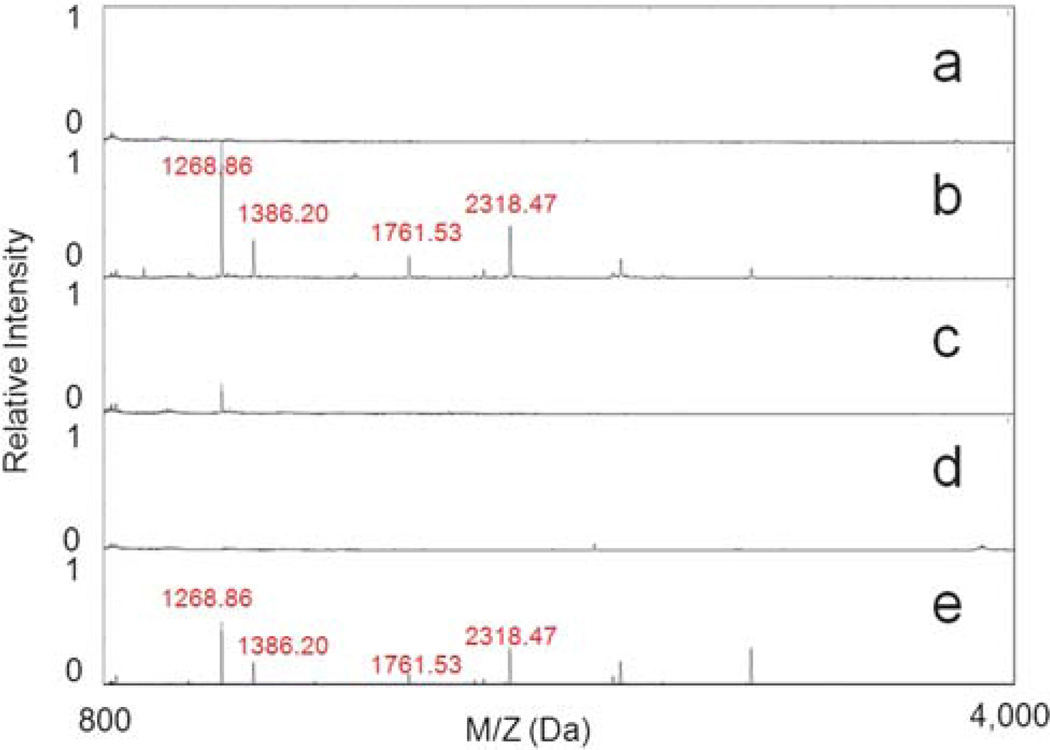
We used 23 kDa α-casein to test the effectiveness of the functionalized MPS chips. The S1 form of this protein was digested with trypsin, a serine protease that specifically cleaves at the carboxylic sites of lysine and arginine residues. The digestion mixture was then spotted on a Zr4+ immobilized mesoporous silica thin film, and the captured peptides were recovered for MALDI TOF MS analysis. Peptides in the range of 800 to 4000 Da were observed in the spectra (Fig. 4). As anticipated, no peptides were detected from the undigested sample either in the low mass range (Fig. 4a and 4d) or high mass range (10 000–30 000 Da) due to the efficient exclusion of large proteins, consistent with the size-exclusive principles of the MPS chip. Several peaks were detected from the digested samples, indicating that peptides were effectively captured by the Zr4+ immobilized chip (Fig. 4b). In a parallel experiment, we also treated the trypsinized α-casein peptides with phosphatase to dephosphorylate. As shown in Fig. 4c, the same peaks in Fig. 4b could not be detected after phosphatase treatment, suggesting that the dephosphorylated peptides could not be captured by the same chip. This result suggests that the functionalized MPS chips offer selectivity in the recovery of phosphopeptides. In a separate experiment, trypsin (24 kDa) and phosphatase (69 kDa) were treated with the same protocol and no peaks were detected in the spectrum, indicating that both enzymes were removed during the washing steps. As a control, the trypsinized α-casein was fractionated using the original MPS chip. The results, seen in Fig. 4e, show that peaks with similar m/z as those in Fig. 4b were detected, albeit at lower normalized intensities, indicating enhanced phosphoprotein selectivity from MPS chips with zirconium ion functionalization. Tests with Ti4+ and Ga3+ immobilized chips showed similar improvements in their ability to provide enrichment of LMW phosphoproteins (Figures S2 and S3 in the ESI†).
Fig. 4.
MALDI TOF MS spectra of fractionated peptides processed by Zr4+ immobilized chip from (a) raw α-casein, (b) trypsinized α-casein, (c) trypsinized α-casein treated with phosphatase, (d) raw α-casein treated with phosphatase and (e) trypsinized α-casein on the control MPS chip.
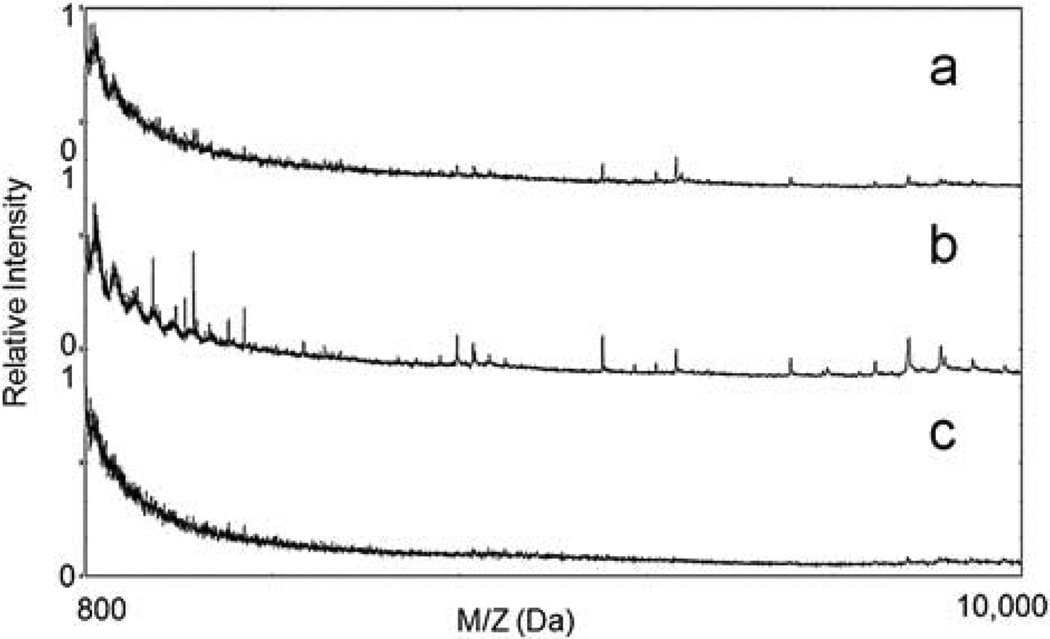
To test whether phosphopeptides could also be captured efficiently from complex samples such as human serum, we mixed trypsinized phosphoprotein phosvitin with serum, and processed the samples with the Zr4+ immobilized MPS chips. No significant phosphopeptides were detected from undigested samples of human serum (Fig. 5a). Peptides from trypsinized phosphoproptein phosvitin were captured and enriched using the Zr4+ immobilized MPS chip (Fig. 5b). However, no significant peaks were detected by MALDI TOF after dephosphorylation with phosphatase (Fig. 5c), consistent with the anticipated selectivity of the coating. This result indicates that the Zr4+ immobilized MPS chip has specificity in capturing phosphopeptides. The MS profiles demonstrated that the metal immobilized chips were able to specifically harvest the phosphopeptides from complex samples and represent a viable platform for the rapid detection of LMW peptides from serum or other body fluids.
Fig. 5.
MALDI TOF MS spectra of the fractionated samples on the Zr4+ immobilized chip from (a) raw phosvitin in human serum, (b) trypsinized phosvitin in human serum and (c) trypsinized phosvitin, treated with phosphatase, in human serum.
Furthermore, fractionation reproducibility and reliability are mandatory for the development of reliable proteomic and peptidomic screening techniques for clinical applications. To assess the consistency of our post-functionalized MPS chips in enriching LMW phosphoproteins, we screened 7 replicate Zr(iv) immobilized MPS chip with 7 aliquots of the same serum sample mixed with phosphoproteins. An average coefficient of variation (CV) at 18.0% represents an improvement over other techniques.48
Hierarchical clustering analysis
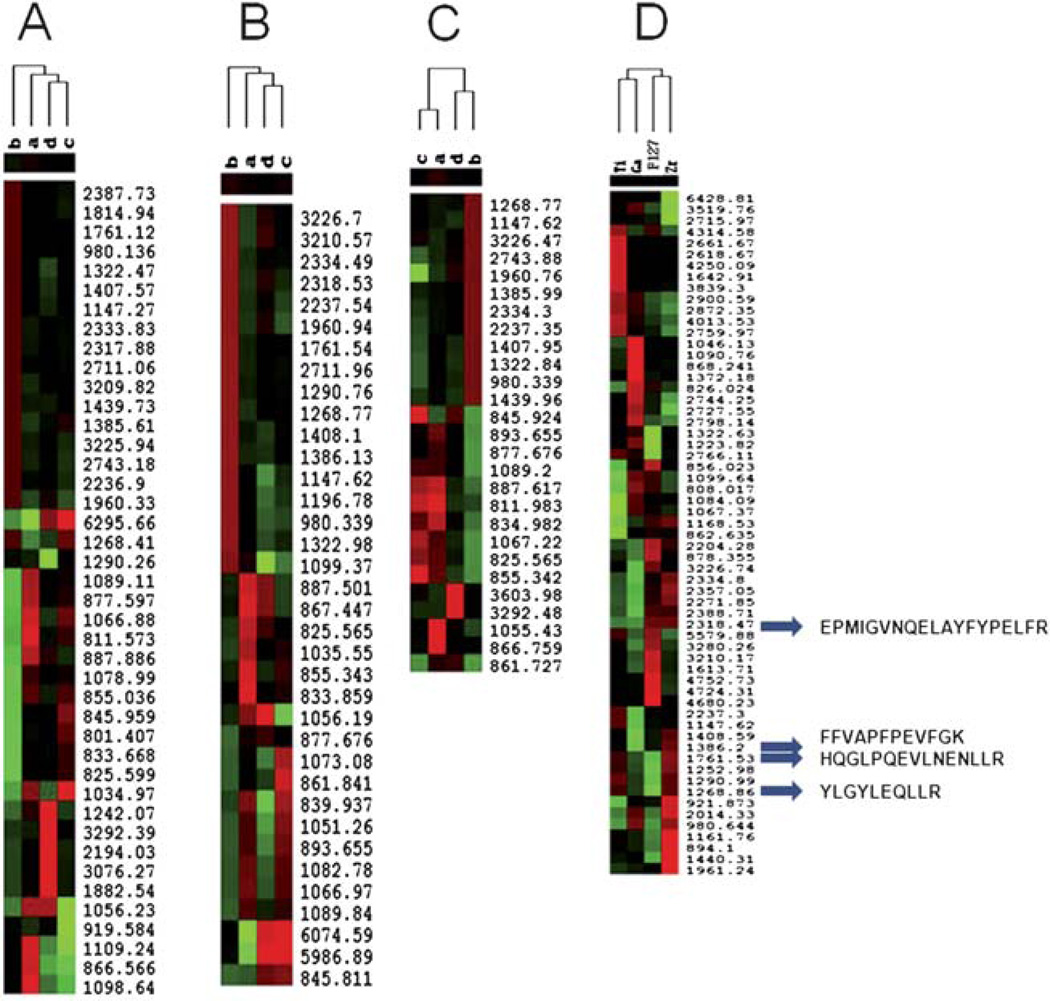
A hierarchical clustering analysis of peptides extracted from processed phosphopeptides as well as unprocessed peptides was performed. As shown in Fig. 6A, B and C, their columns b, representing trypsinized α-casein processed by the functionalized MPS chips, exhibited superior enrichment of LMW phosphopeptides compared to either α-casein without treatment or the dephosphorylated peptides. As shown in Fig. 6D, the proteomic patterns fall into four clusters representing the ability of the MPS chips functionalized by Zr4+, Ga3+, Ti4+ and control MPS chip to enrich phosphopeptides. Using the Peptide Cutter program (ExPASy Proteomics Server, Swiss Institute of Bioinformatics), predicted alpha casein peptides masses digested by trypsin were labeled as shown in Fig. 6D. Four phosphopeptides with their amino acid sequences are: 2318.47 Da (EPMIGVNQELAYFYPELFR); 1386.20 Da (FFVAPFPEVFGK); 1761.53Da (HQGLPQEVLNENLLR) and 1268.86 Da (YLGYLEQLLR). The Zr4+ and Ti4+ chips show better enrichment in the LMW mass range than the Ga3+chip, which suggests that the unique coordination specificity of Zr4+ or Ti4+ ions immobilized on the MPS chips greatly improves the selectivity of phosphopeptide binding by preventing acidic peptide binding.
Fig. 6.
Unsupervised hierarchical clustering analysis for the ability of the MPS chips immobilized with different metal ions for LMW phosphopeptide recovery (Cluster A: Zr4+, Cluster B: Ga3+, and Cluster C: Ti4+). Red indicates peak intensity higher than the median value, green indicates peak intensity lower than the median value, and black represents peak intensity equal to the median values. Each row represents an individual MALDI MS mass peak and each column represents a type of fractionated sample, with an unprocessed phosphopeptide sample as a negative control. The samples are divided by (a) raw α-Casein, (b) trypsinized α-Casein, (c) trypsinized α-Casein treated with phosphatase, (d) raw α-Casein treated with phosphatase. Cluster D shows phosphopeptide enrichment by the three MPS chips immobilized with Zr4+, Ga3+, Ti4+ and the control MPS chip prepared by Pluoronic F127.
Conclusion
Phosphopeptides are present in the serum proteome at concentrations that require accordingly low detection thresholds for early biomarker identification. We reported the immobilization of various metal ions (Zr4+, Ti4+ and Ga3+) on the mesoporous silica chips. Their physico/chemical properties were fully characterized. The functionalized MPS chips, which offer high surface areas, large pore volumes and uniform pore size distributions, were used to isolate and enrich efficiently the low mass phosphopeptides from complex human serum samples. The use of functionalized MPS chips with engineered binding characteristics thus provides a novel platform for the profiling of posttranslational modifications in the human proteome and the potential diagnosis of early symptoms of cancer and other diseases. Combining tunable size fractionation with metal ion selectivity for phosphopeptides, we have created a platform for the identification of LMW biomarkers that offers simpler preparation, higher reproducibility and greater stability of LMW phosphoprotein samples than prior approaches.
Acknowledgements
The authors thank the Microelectronic Research Center (MRC) at the University of Texas at Austin. We thank Dr Ali Bouamrani ’s advice and Diana Chan for her assistance. These studies were supported by the following grants issued in the US: State of Texas’s Emerging Technology Fund, National Institute of Health (NIH) (R21/R33CA122864, R01CA128797), National Aeronautics and Space Administration (NASA) (NNJ06HE06A), Department of Defense (DoD) Breast Cancer Research Program Innovator Award (W81XWH-09-1-0212). The authors would like to recognize the contributions and support from the Alliance for NanoHealth (ANH).
Footnotes
Electronic supplementary information (ESI) available. See DOI: 10.1039/c0nr00720j
References
- 1.Cohen P. Nature. 1982;296:613–620. doi: 10.1038/296613a0. [DOI] [PubMed] [Google Scholar]
- 2.Stock JB, Ninfa AJ, Stock AM. Microbiol. Mol. Biol. Rev. 1989;53:450–490. doi: 10.1128/mr.53.4.450-490.1989. [DOI] [PMC free article] [PubMed] [Google Scholar]
- 3.Ubersax JA, Ferrell JE., Jr Nat. Rev. Mol. Cell Biol. 2007;8:530–541. doi: 10.1038/nrm2203. [DOI] [PubMed] [Google Scholar]
- 4.Schulze WX. Curr. Opin. Plant Biol. 2010;13:279–286. doi: 10.1016/j.pbi.2009.12.008. [DOI] [PubMed] [Google Scholar]
- 5.Xu Y-M, Zhu F, Cho Y-Y, Carper A, Peng C, Zheng D, Yao K, Lau ATY, Zykova TA, Kim H-G, Bode AM, Dong Z. Cancer Res. 2010;70:3218–3227. doi: 10.1158/0008-5472.CAN-09-4306. [DOI] [PubMed] [Google Scholar]
- 6.Moody CA, Laimins LA. Nat. Rev. Cancer. 2010;10:550–560. doi: 10.1038/nrc2886. [DOI] [PubMed] [Google Scholar]
- 7.Sala-Torra O, Radich JP. Acute Leukemias. 2008;2:177–189. [Google Scholar]
- 8.Bentires-Alj M, Neel BG. Cancer Res. 2007;67:2420–2424. doi: 10.1158/0008-5472.CAN-06-4610. [DOI] [PubMed] [Google Scholar]
- 9.Wu W, O’Reilly MS, Langley RR, Tsan RZ, Baker CH, Bekele N, Tang XM, Onn A, Fidler IJ, Herbst RS. Mol. Cancer Ther. 2007;6:2652–2663. doi: 10.1158/1535-7163.MCT-06-0759. [DOI] [PubMed] [Google Scholar]
- 10.Druker BJ, Sawyers CL, Kantarjian H, Resta DJ, Reese SF, Ford JM, Capdeville R, Talpaz M. N. Engl. J. Med. 2001;344:1038–1042. doi: 10.1056/NEJM200104053441402. [DOI] [PubMed] [Google Scholar]
- 11.Shah NP, Kasap C, Weier C, Balbas M, Nicoll JM, Bleickardt E, Nicaise C, Sawyers CL. Cancer Cell. 2008;14:485–493. doi: 10.1016/j.ccr.2008.11.001. [DOI] [PubMed] [Google Scholar]
- 12.Maemondo M, Inoue A, Kobayashi K, Sugawara S, Oizumi S, Isobe H, Gemma A, Harada M, Yoshizawa H, Kinoshita I, Fujita Y, Okinaga S, Hirano H, Yoshimori K, Harada T, Ogura T, Ando M, Miyazawa H, Tanaka T, Saijo Y, Hagiwara K, Morita S, Nukiwa T. N. Engl. J. Med. 2010;362:2380–2388. doi: 10.1056/NEJMoa0909530. [DOI] [PubMed] [Google Scholar]
- 13.Kris MG, Natale RB, Herbst RS, Lynch TJ, Jr, Prager D, Belani CP, Schiller JH, Kelly K, Spiridonidis H, Sandler A, Albain KS, Cella D, Wolf MK, Averbuch SD, Ochs JJ, Kay AC. JAMA, J. Am. Med. Assoc. 2003;290:2149–2158. doi: 10.1001/jama.290.16.2149. [DOI] [PubMed] [Google Scholar]
- 14.Carter P, Presta L, Gorman CM, Ridgway JB, Henner D, Wong WL, Rowland AM, Kotts C, Carver ME, Shepard HM. Proc. Natl. Acad. Sci. U. S. A. 1992;89:4285–4289. doi: 10.1073/pnas.89.10.4285. [DOI] [PMC free article] [PubMed] [Google Scholar]
- 15.Cunningham D, Humblet Y, Siena S, Khayat D, Bleiberg H, Santoro A, Bets D, Mueser M, Harstrick A, Verslype C, Chau I, Van Cutsem E. N. Engl. J. Med. 2004;351:337–345. doi: 10.1056/NEJMoa033025. [DOI] [PubMed] [Google Scholar]
- 16.Steen JA, Steen H, Georgi A, Parker K, Springer M, Kirchner M, Hamprecht F, Kirschner MW. Proc. Natl. Acad. Sci. U. S. A. 2008;105:6069–6074. doi: 10.1073/pnas.0709807104. [DOI] [PMC free article] [PubMed] [Google Scholar]
- 17.Macek B, Mann M, Olsen JV. Annu. Rev. Pharmacol. Toxicol. 2009;49:199–221. doi: 10.1146/annurev.pharmtox.011008.145606. [DOI] [PubMed] [Google Scholar]
- 18.Liotta LA, Petricoin EF. J. Clin. Invest. 2005;116:26–30. doi: 10.1172/JCI27467. [DOI] [PMC free article] [PubMed] [Google Scholar]
- 19.Maciel C, Junqueira M, Paschoal M, Kawamura M, Duarte R, Carvalho Mda G, Domont G. J. Exp. Ther. Oncol. 2005;5:31–38. [PubMed] [Google Scholar]
- 20.Liotta LA, Ferrari M, Petricoin E. Nature. 2003;425:905–905. doi: 10.1038/425905a. [DOI] [PubMed] [Google Scholar]
- 21.Ficarro SB, McCleland ML, Stukenberg PT, Burke DJ, Ross MM, Shabanowitz J, Hunt DF, White FM. Nat. Biotechnol. 2002;20:301–305. doi: 10.1038/nbt0302-301. [DOI] [PubMed] [Google Scholar]
- 22.Raggiaschi R, Gotta S, Terstappen G. Biosci. Rep. 2005;25:33–44. doi: 10.1007/s10540-005-2846-0. [DOI] [PubMed] [Google Scholar]
- 23.Lee I, Chen C, Sheu J, Lee H, Huang G, Yu C, Lu F, Chow L. J. Proteome Res. 2005;4:2062–2069. doi: 10.1021/pr0502018. [DOI] [PubMed] [Google Scholar]
- 24.Kresge N, Simoni RD, Hill RL. J. Biol. Chem. 2006;281:e26. [Google Scholar]
- 25.Mann M, Ong S-E, Grønborg M, Steen H, Jensen ON, Pandey A. Trends Biotechnol. 2002;20:261–268. doi: 10.1016/s0167-7799(02)01944-3. [DOI] [PubMed] [Google Scholar]
- 26.Cohen P. Eur. J. Biochem. 2001;268:5001–5010. doi: 10.1046/j.0014-2956.2001.02473.x. [DOI] [PubMed] [Google Scholar]
- 27.Han G, Ye M, Zou H. Analyst. 2008;133:1128–1138. doi: 10.1039/b806775a. [DOI] [PubMed] [Google Scholar]
- 28.Dunn JD, Reid GE, Bruening ML. Mass Spectrom. Rev. 2010;29:29–54. doi: 10.1002/mas.20219. [DOI] [PubMed] [Google Scholar]
- 29.Andersson L, Porath J. Anal. Biochem. 1986;154:250–254. doi: 10.1016/0003-2697(86)90523-3. [DOI] [PubMed] [Google Scholar]
- 30.Jin W-H, Dai J, Zhou H, Xia Q-C, Zou H-F, Zeng R. Rapid Commun. Mass Spectrom. 2004;18:2169–2176. doi: 10.1002/rcm.1604. [DOI] [PubMed] [Google Scholar]
- 31.Feuerstein I, Morandell S, Stecher G, Huck CW, Stasyk T, Huang H-L, Teis D, Huber LA, Bonn GK. Proteomics. 2005;5:46–54. doi: 10.1002/pmic.200400899. [DOI] [PubMed] [Google Scholar]
- 32.Feng S, Pan C, Jiang X, Xu S, Zhou H, Ye M, Zou H. Proteomics. 2007;7:351–360. doi: 10.1002/pmic.200600045. [DOI] [PubMed] [Google Scholar]
- 33.Ndassa YM, Orsi C, Marto JA, Chen S, Ross MM. J. Proteome Res. 2006;5:2789–2799. doi: 10.1021/pr0602803. [DOI] [PubMed] [Google Scholar]
- 34.Posewitz MC, Tempst P. Anal. Chem. 1999;71:2883–2892. doi: 10.1021/ac981409y. [DOI] [PubMed] [Google Scholar]
- 35.Qiao L, Roussel C, Wan J, Yang P, Girault HH, Liu B. J. Proteome Res. 2007;6:4763–4769. doi: 10.1021/pr0705284. [DOI] [PubMed] [Google Scholar]
- 36.Ficarro SB, Parikh JR, Blank NC, Marto JA. Anal. Chem. 2008;80:4606–4613. doi: 10.1021/ac800564h. [DOI] [PubMed] [Google Scholar]
- 37.Lin H-Y, Chen C-T, Chen Y-C. Anal. Chem. 2006;78:6873–6878. doi: 10.1021/ac060833t. [DOI] [PubMed] [Google Scholar]
- 38.Ballif BA, Villén J, Beausoleil SA, Schwartz D, Gygi SP. Mol. Cell. Proteomics. 2004;3:1093–1101. doi: 10.1074/mcp.M400085-MCP200. [DOI] [PubMed] [Google Scholar]
- 39.Beausoleil SA, Jedrychowski M, Schwartz D, Elias JE, Villén J, Li J, Cohn MA, Cantley LC, Gygi SP. Proc. Natl. Acad. Sci. U. S. A. 2004;101:12130–12135. doi: 10.1073/pnas.0404720101. [DOI] [PMC free article] [PubMed] [Google Scholar]
- 40.Dai J, Jin W-H, Sheng Q-H, Shieh C-H, Wu J-R, Zeng R. J. Proteome Res. 2007;6:250–262. doi: 10.1021/pr0604155. [DOI] [PubMed] [Google Scholar]
- 41.Zhou H, Xu S, Ye M, Feng S, Pan C, Jiang X, Li X, Han G, Fu Y, Zou H. J. Proteome Res. 2006;5:2431–2437. doi: 10.1021/pr060162f. [DOI] [PubMed] [Google Scholar]
- 42.Pan C, Ye M, Liu Y, Feng S, Jiang X, Han G, Zhu J, Zou H. J. Proteome Res. 2006;5:3114–3124. doi: 10.1021/pr0600125. [DOI] [PubMed] [Google Scholar]
- 43.Hu Y, Bouamrani A, Tasciotti E, Li L, Liu X, Ferrari M. ACS Nano. 2010;4:439–451. doi: 10.1021/nn901322d. [DOI] [PMC free article] [PubMed] [Google Scholar]
- 44.Bouamrani A, Hu Y, Tasciotti E, Li L, Chiappini C, Liu X, Ferrari M. Proteomics. 2010;10:496–505. doi: 10.1002/pmic.200900346. [DOI] [PMC free article] [PubMed] [Google Scholar]
- 45.Gaspari M, Ming-Cheng Cheng M, Terracciano R, Liu X, Nijdam AJ, Vaccari L, di Fabrizio E, Petricoin EF, Liotta LA, Cuda G, Venuta S, Ferrari M. J. Proteome Res. 2006;5:1261–1266. doi: 10.1021/pr050417+. [DOI] [PubMed] [Google Scholar]
- 46.Geho D, Ming-Cheng Cheng M, Killian K, Lowenthal M, Ross S, Frogale K, Nijdam J, Lahar N, Johann D, Herrmann P, Whiteley G, Ferrari M, Petricoin E, Liotta L. Bioconjugate Chem. 2006;17:654–661. doi: 10.1021/bc0503364. [DOI] [PubMed] [Google Scholar]
- 47.Stanghellini PL, Boccaleri E, Diana E, Alberti G, Vivani R. Inorg. Chem. 2004;43:5698–5703. doi: 10.1021/ic049565c. [DOI] [PubMed] [Google Scholar]
- 48.De Bock M, de Seny D, Meuwis MA, Servais AC, Minh TQ, Closset J, Chapelle JP, Louis E, Malaise M, Merville MP, Fillet M. Talanta. 2010;82:245–254. doi: 10.1016/j.talanta.2010.04.029. [DOI] [PubMed] [Google Scholar]


