

Abstract
Objectives/Hypothesis
The purpose of this work is to apply nonlinear laser scanning microscopy (NLSM) for visualizing the morphology of extracellular matrix proteins within human vocal folds. This technique may potentially assist clinicians in making rapid diagnoses of vocal fold tissue disease or damage. Microstructural characterization, based on NLSM, provides valuable information for better understanding the molecular mechanisms and tissue structure.
Study Design
Experimental. Ex-vivo human vocal fold
Methods
A custom built multi-modal nonlinear laser scanning microscope was utilized to scan fibrillar proteins in three 4% formaldehyde-fixed cadaveric samples. Collagen and elastin, key extracellular matrix proteins in the vocal fold lamina propria, were imaged by two nonlinear microscopy modalities: second harmonic generation (SHG) and two-photon fluorescence (TPF), respectively. An experimental protocol was introduced to characterize the geometrical properties of the imaged fibrous proteins.
Results
The NLSM revealed the biomorphology of the human vocal fold fibrous proteins. No photobleaching was observed for the incident laser power of ~60 mW before the excitation objective. Types I and III fibrillar collagen were imaged without label in the tissue by intrinsic SHG. Imaging while rotating the incident laser light-polarization direction confirmed a helical shape for the collagen fibers. The amplitude, periodicity and overall orientation were then computed for the helically-distributed collagen network. The elastin network was simultaneously imaged via TPF and found to have a basket-like structure. In some regions, particularly close to the epithelium, co-localization of both extracellular matrix components were observed.
Conclusions
A benchmark study is presented for quantitative real-time ex-vivo nonlinear laser scanning microscopy imaging of the extracellular macromolecules in human vocal fold lamina propria. The results are promising for clinical applications.
Level of Evidence
None
Keywords: Human vocal folds, Nonlinear laser scanning microscopy, Laser microsurgery, Collagen, Elastin
INTRODUCTION
Voice disorders that are caused by organic lesions, like nodules and polyps, require surgical treatment. Many benign lesions involve the superficial layer of the lamina propria and they should be removed as atraumatically as possible without damaging the lamina propria. An accurate diagnosis is therefore essential in order to plan the proper surgical procedure. Histopathological assessments of the vocal fold tissue have been established to characterize the type of lesion. The molecular composition of abnormal tissue is different from that of healthy tissue1. The extracellular matrix of the vocal fold lamina propria is composed of fibrous proteins, including collagen and elastin, entangled inside interstitial proteins such as proteoglycans and polysaccharides2,3,4. The pathological examinations could be significantly improved by performing real-time optical sectioning of the distribution of extracellular matrix proteins.
Scarred vocal fold lamina propria, resulting from surgery or voice abuse, are commonly treated by the injection of soft viscoelastic hydro-gels and tissue-engineering biomaterials5. The efficiency of the method depends on the injection site6. Recent developments in ultrafast laser microsurgery allow clinicians to easily control the injecting region7. Femtosecond laser-based nonlinear laser scanning microscopy (NLSM) has the capability of performing in-vivo diagnostic imaging in synchrony with laser surgery8. NLSM is a powerful technique for the imaging of tissue morphology with a high spatial and temporal resolution9. This technique has previously been used, for example, to image corneal collagen in living rabbits before and after cutting lamellar flaps, demonstrating the clinical feasibility of microsurgery at the cellular level10. This idea was then exploited by Hoy et al.11 to create a sub-epithelial void in the porcine lamina propria in a confined location.
The collagen and elastin networks are the main sources of intrinsic contrast in second harmonic generation (SHG) and two-photon fluorescence (TPF) in tissues9,12. The central physical principle of SHG is that two incident photons are annihilated to produce one emitted photon with twice the energy (frequency)9. The nonlinear intensity dependence of SHG entails that emission is restricted to the tight focus of a femtosecond laser beam allowing optical section imaging within 3D samples. Fibril-forming collagens, including types I and III, are highly ordered non-centrosymmetrical molecular structures that interact with ultrafast laser light pulses to cause nonlinear light scattering. They are extremely bright emitters of SHG with a hyper-polarizability that is only 10-fold lower than crystalline quartz13,14. Due to a non-negligible back scattered signal, SHG is applicable for thick tissues and intravital preparations (i.e., reflective mode)15. It could be used to identify the location of scar tissue throughout the lamina propria. For example, it was used for pericardial tissue16. The use of an appropriate in-vivo probe17 makes the technique suitable for a rapid diagnostic scan to provide pathological information. The elastin fibers, due to pyridinoline based cross-links in their composition12, emit intrinsic two-photon excited autofluorescence (TPF). The nonlinear TPF process also allows optical sectioning of their spatial distribution and orientation relative to the collagen fibrils.
NLSM requires no labeling or pre-processing for collagen and elastin imaging, thus avoiding the distortion of the cellular and extracellular matrix through labeling artefacts. The potential for NLSM optical sectioning for human vocal folds is assessed here by determining the optimal parameters for the incident laser beam. The geometry of the fibrous proteins, in the sagittal plane, was obtained by optical sectioning imaging in the tissue slice to characterize the vocal fold microstructure. Adjacent equal-thickness layers of cadaveric human vocal folds were extracted from the epithelium to the deep layer of the lamina propria. SHG and TPF were then applied to simultaneously optically section image the collagen and elastin fibers, respectively. Area fractions of collagen and elastin were also calculated. The morphology and spatial distribution of the collagen and elastin fibers recorded in the images may aid in the differentiation between healthy and diseased tissues. Hence the current work can be established as a baseline for future NLSM studies through in-vitro and in-vivo pathological examinations. Furthermore, the results are useful in understanding the biomechanics of vocal folds because the elastic fiber network supports the majority of the mechanical loads to which the tissue is exposed18 (see also Chan et al.19).
MATERIALS AND METHODS
Sample Preparation
Excised human vocal folds were obtained from the cadaver unit of the Montreal Children Hospital, in accordance with ethics approval. They were fixed in 4% formaldehyde within 24 hours postmortem and stored in a freezer at −20°C. Larynges were harvested from two male cadavers and one female cadaver, with no history of pathology or smoking. A rectangular area of approximately 3×5 mm was dissected with sharp blades from the central region of the vocal fold in the horizontal plane. The thickness of the specimen was at least 4 mm to ensure the inclusion of the lamina propria. A schematic of the location from which the tissues were removed is shown in the next section. The surface of all samples was marked along the longitudinal direction with a blue tissue dye for reference.
With no wash or dehydration, the tissue was embedded in OCT (Optimal Cutting Temperature Compound, Sakura Finetek, Dublin, OH) medium. It was then sectioned using a cryostat machine (Leica CM-3505-S) working at −24°C. It was sequentially sectioned into 100-μm thick layers from the epithelium. The tissue was cut into 200-μm thick samples after the tenth layer. The layers were then placed between two 22×22 mm cover slips (Fisher Scientific, Ottawa, ON), and the OCT gel minimized the movement of the samples. The anterior-posterior direction of the vocal fold was dyed as the baseline of the orientation analysis. A circular area of nearly 1-mm diameter was marked on each set of cover slips to demark the scanning region. The slides were then placed on the NLSM stage for imaging as explained in the following section.
Nonlinear Laser Scanning Microscopy (NLSM)
A custom-built multimodal nonlinear laser scanning microscope was used to record the images (Fig. 1). The laser source for this microscope is a Mira OPO (Coherent, Santa Clara, CA, USA) that is linearly polarized in the horizontal direction. The OPO is pumped at a 780-nm wavelength by a Mira 900 Ti:Sapphire (Coherent) at an average power of 1.9 W, which itself is pumped by a V18 Verdi laser (Coherent) at 13 W average power. The wavelength of the OPO is tunable from 1000 to 1300 nm with an average power of 300 mW, which gives pulses of less than 150 fs at a laser pulse repetition rate of 76 MHz. The SHG and TPF emissions were imaged following excitation at a wavelength of 1050 nm from the OPO, with a pulse width of ~ 100 fs. To scan the sample, we used VM2000 moving magnet scanners (GSI Lu-monics, Moorpark, CA, USA). The excitation and collection objectives (Carl Zeiss, Toronto, Canada) are a 63x 0.9 NA water immersion lens with a 2-mm working distance and a 20x 0.75 NA water immersion lens with a 0.61-mm working distance, respectively. The sample holder can be manually moved along the X-Y plane and is controlled by a piezoelectric actuator (Thorlabs, Newton, NJ, USA) for Z positioning. For photon detection, two H7422P-40 photomultiplier tubes (Hamamatsu Photonics, Bridgewater, NJ, USA) were used for simultaneous detection of SHG and TPF signal in two channels with splitting via a dichroic mirror (Chroma, 540dcxr that transmits the TPF signal and reflects the SHG signal). Two cutoff filters were used to select the signal detection range for SHG (Chroma, HQ525/50m-2p) and TPF (Chroma, HQ600/50m-2p). The analog-to-digital conversion of the signal from the PMT was done using a 16-bit DAQ (National Instrument, Austin, TX, USA), which can acquire 1.25 MSamples/s. All instrument control and image acquisition were done with custom written Labview programs. Further details about this transmission-mode nonlinear microscope were described previously20. The excitation laser polarization experiments were carried out by inserting a half-wave Fresnel Rhomb Retarder (FR600HM, Thorlabs, USA) in the laser path.
Figure 1.

Schematic of the nonlinear laser scanning microscopy (NLSM) system.
A constant incident laser power level (~ 60 mW before the excitation objective) was found to be most efficient by trial and error. Over the scanning time, the tissue did not show any effect of photo-bleaching in either channel. The same level of incident laser power was maintained for each sample by using neutral density (ND) filters with different transmission percentages. The laser beam was scanned over a 204×204-μm field of view using both (horizontal) axes of the scanning mirrors. Digital images of 512×512 pixels were saved in a tagged image file format. Three points were selected on the first five layers and one point was selected on the rest of the layers. A stack of images covering 204×204 μm were imaged from the surface down to a depth of 20 μm at 1-μm intervals. For each case, the optical sectioning imaging process was completed in less than 10 minutes. Imaging areas were chosen far enough from the edges to display the natural configuration of matrix proteins. If the polarization of the incident laser beam is systematically rotated, the intensity of the detected SHG signal will vary depending on the orientation of the collagen fibrils13. Polarizing the SHG objectives in a vertical plane and varying the excitation polarization direction with respect to this reference plane was done to explore the spatial distribution of the collagen fibrils.
Image processing
A script was written in MATLAB to calculate the geometric properties of collagen fibrils. A simple drawing in Fig. 2 illustrates the characteristic waveform of the collagen fibrils. Ten random edge segments were selected manually in each image. The period of each component was determined through a regression fit to a periodic sinusoidal function (see Fig. 2). The orientation of the fiber was determined by enclosing the fitting in an ellipse (produced by Prony series) and measuring the angle from the major axis, which was defined by the longitudinal axis of the vocal folds. The amplitude was determined by measuring the mean of the amplitudes of several cycles. The data were saved in units of pixels and then converted to physical units via the known image pixel resolution.
Figure 2.

Schematic diagram showing the different scales and geometries of the tissue slices and collagen fibrils. The ellipsoid shows an approximation to the point spread function (PSF) focal volume for the NLSM with estimated diffraction-limited axial and lateral radii22 of 1.13 μm and 0.27 μm, respectively and the corresponding effective focal volume is 0.67 μm3. The figure also illustrates the sinusoidal waveform model used to fit to the imaged collagen fibrils to obtain the geometry and orientation in the tissue slice.
Open source software “ImageJ” (Wayne Rasband, NIH, Bethesda, MD) was used to extract additional quantitative information from the images. It was initially utilized to merge the results from the two channels, i.e., SHG and TPF. Collagen fibrils and elastin fibers are colored green and red, respectively. Using grayscale values in the images, the density of the imaged proteins can be estimated via the NLSM measurement. The software was used to estimate the average intensity and calculate the protein-filled area in each image using mean thresholding. It was calculated for the 20-μm stacks imaged in each slide. Also, for the data reported from the polarization imaging experiments, twenty random small square regions of interest were selected for each image and then the intensities were averaged for all images.
To establish a baseline for diagnosis imaging and biomechanics, identifying the three-dimensional configuration of the interacting proteins is crucial. After sequential optical sectioning imaging through the sample over a 20-μm thickness, in 20 steps, the “volume viewer” command in ImageJ was used for spatial reconstruction. Finally, it should be noted that conventional histological procedures were applied to verify the existence of collagen and elastin fibers. Elastica Verhoeff-Van Gieson and Masson’s trichome staining were applied for very thin sections (10 μm) of the samples to confirm the presence of elastin and collagen fibers, respectively.
RESULTS
Three cadaveric human adult vocal folds were used for this study. One of the subjects was a 65-year-old female, Sample I, and the others were 55- and 68-year-old males, Samples II and III respectively. Following the protocol described above, the samples were imaged in the NLSM. TPF and SHG images of a selected area measuring 150×100 μm within the superficial lamina propria are illustrated in Fig. 3. The right images show the SHG emission from the bundles of thin and thick collagen fibrils exhibiting their typical sinusoidal wave patterns in space. The collagen fibrils in the vocal fold lamina propria predominantly consist of collagen type III, while collagen type I is in the form of large bundles21. However, the collagen-bundle membranes cannot generate SHG signal in the NLSM. A unique advantage of dual-mode NLSM imaging is that it reveals the physical connections between elastin fibers and collagen fibrils. In images (a) and (b), for example, the regions where the elastin fibers are co-localized with collagen fibrils are highlighted by arrows.
Figure 3.

Typical images of unloaded elastin network and collagen fibrils in Sagittal plane of human vocal fold lamina propria. The first (red) and second (green) columns correspond to the TPF and SHG, respectively. (a),(b) from Sample I; (c),(d) from Sample II; (e),(f) from Sample III. The bright arrows indicate the site that the elastin fibers are co-localized within the collagen network. The scale bar represents 20μm
Three-dimensional reconstructed images are depicted in Fig. 4 for the vocal fold cover in Sample I. They were only selected to show the integrity of the collagen and elastin network through this depth of tissue. The co-localization regions of elastin and collagen can be seen in the merged reconstruction. The position where the tissue samples were extracted from the cadavers and the layer-wise process for tissue preparations are also shown in the same figure. The vocal fold samples were apparently obtained from the middle-third of the anterior-posterior length.
Figure 4.

Schematic diagram of the layers and optical sectioning imaging are shown along with the location of tissue extraction; Three-dimensional reconstruction of the SHG and TPF channels and the integrated network are overlay of the sample I.
The protein area fraction is directly related to the volume fraction, an important structural index. Plots of the average area fraction, and its standard deviation, as a function of depth in tissue for three randomly chosen areas are depicted in Fig. 5. The selected sequential layers cover the superficial and the intermediate lamina propria, i.e. the vocal fold cover. Because of the dual-mode collection of the NLSM employed, the relative volume fractions between elastin fibers and collagen fibrils can be directly compared.
Figure 5.

Depth distribution of the mean area fraction, and its standard deviation (at three random locations) for SHG and TPF channels. Vertical dashed lines indicated separate tissue slices. (
 Sample I;
 Sample II; ▲ Sample III)
Thin (type I) and thick (type III) collagen fibrils, which constitute an integrated reticular network, were fit by a sinusoidal function. The mean regression constants are summarized in Fig. 6, indicate the overall orientation, periodicity and amplitude of the collagen sinusoid waveforms. These parameters are sufficient to identify the required extension for uncurling the collagen fibrils. It should be noted that the tissue samples were not under tension.
Figure 6.

Depth distribution of the mean collagen sinusoidal parameters based on the Fourier fitting. Vertical dashed lines indicated separate tissue slices. (
Sample I;
Sample II; ▲ Sample III)
Finally, the polarization mapping approach was applied in the superficial lamina propria (the first 100-μm layer) because this area is of particular importance in biomechanics. The normalized intensity is plotted as a function of different polarization angles in Fig. 7. The angle “0” corresponds to light polarization perpendicular to the direction of laser propagation and the angle “90” is parallel to the beam propagation axis. A theoretical curve that shows the case of ideally aligned fibers is added to the plot as a reference.
Figure 7.
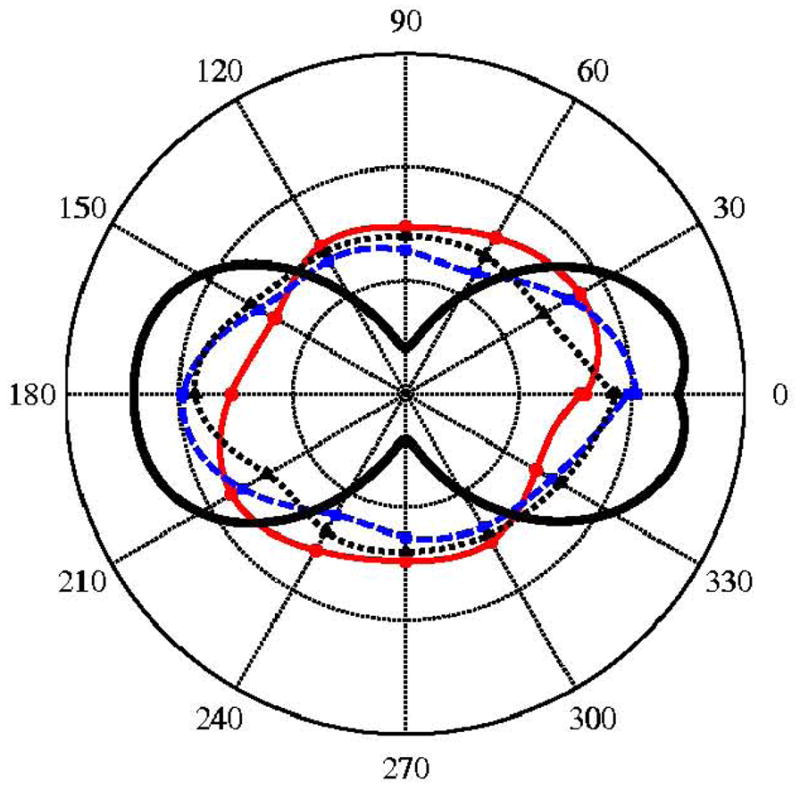
Polar plots of SHG intensity of the first-layer (superficial layer) vs. angle of laser polarization relative to the longitudinal axis. The solid black curve indicates the ideal theoretical polarization for unidirectional fibrils. (
Sample I;
Sample II; ▲ Sample III)
DISCUSSION
The use of NLSM for imaging collagen and elastin in various biological samples with a range of excitation wavelengths has been previously characterized22. A knowledge of the spatial distribution of extracellular matrix protein networks may help clinicians guide the location selection for in-vivo optical sectioning of the tissue. Compared to conventional in-vitro and in-vivo methods of tissue characterization, NLSM has two key advantages. First, it requires no labeling or pre-processing of the tissue, thus avoiding the distortion of the cellular and extracellular matrix through labeling artefacts. This is opposed to the fixation and processing procedures rendering the histo-chemistry and frozen-sectioning methods. Second, NLSM provides three-dimensional images of the tissue with sub-cellular resolution. Taking this into account, the selective imaging of extracellular matrix proteins distinguishes NLSM from non-invasive methods like computed coherent tomography and magnetic resonance imaging. The NLSM is beneficial for noninvasive diagnostic scanning of vocal folds and studying of real-time light-tissue interactions. The potential of NLSM in evaluating laser-tissue interaction was presented and the relevant optical parameters for the vocal fold tissue are summarized in this study. The data presented here constitutes a first step towards the development of an optimized micro-endoscope for real-time imaging of vocal fold tissue in vivo. Low emission signals from endogenous elastin fluorophores require a high level of excitation power for imaging; hence, we maintained power levels in the upper limits of the determined safe zone in order to image the dim elastin. It should be noted that the samples were fixed in 4% formaldehyde and the effects of fixative on SHG and TPF emission has not been systematically studied. The laser-light requirements for fresh tissue may be different from that of the fixed tissues; however, the results presented here provide a baseline for future experiments on fresh vocal fold samples.
The spatial distribution of collagen and elastin fibers may help in better classifying the vocal fold. While the superficial lamina propria is a loose tissue, it includes more collagen type I than type III. Collagen type I, which is widely distributed in the human body, is a key factor in the flexibility and elasticity of other soft tissues23. The lower layers of the lamina propria are richer in reticular collagen type III and generally it is dominant in the vocal fold21. Unfortunately, the current method cannot be used to distinguish between different collagen types. The structural patterns shown in this work are consistent with those obtained for collagen and elastin, using immunofluorescence staining techniques21. A comparison between the morphology and distribution of collagen type III21 and our SHG results suggest that this type dominates in the vocal fold tissue because collagen type I is typically observed as larger bundles. In some regions, as shown in Figs. 3 and 4, the elastin fibers and collagen fibrils are entangled in such a way that they do not constitute separate networks. This co-localization may be due to ongoing self-assembly of the tropoelastins and tropocollagens following interactions under physiological conditions. As shown in Fig. 3, the elastin is aligned with the collagen in the first two layers but then is largely separated from the collagen in the next two layers. One may conclude that elastin has a smaller contribution to the biomechanics of the vocal ligament. Integrated elastin contribute to tissue elasticity and this is in accordance with the higher elasticity observed in the vocal fold cover with respect to the vocal fold body19. The TPF signal from elastin fibers diminishes in all samples for depths in excess of ~1.5 mm. Considering histology data reported in other studies, a decrease in elastin was expected (e.g., Hahn et al.3). Because elastin is assumed to provide resistance against minor tensions, one may conclude that the elastin has chemical bonds with the surrounding proteins, such as proteoglycans. The connection to a matrix mesh may allow elastin to oppose external tensile loading. Collagen networks, on the other hand, may be physically bonded because of their reticular structure throughout the lamina propria.
Because of the nature of NLSM sampling12, the absolute volume fractions cannot be directly calculated. The planar network density, which is an indicator of the volume fraction, was determined in Fig. 5. The tissue slices were slightly dehydrated during the imaging period, despite the absence of pre-processing. Considering this fact and taking into account a small gripping pressure on the samples, the computed area fractions overestimate the associated physical density. In contrary to elastin fibers that are completely detected by the TPF, all collagen molecules can not generate the SHG signal and some others produce a weak signal because of their spatial configuration9. The higher area fractions in the first three layers imaged by SHG prove that there are a larger number of SHG harmonophores present in these layers. It is known that the superficial layer contains thinner collagen fibrils densely distributed in the tissue4. At deeper imaging depths in the lamina propria, a weaker SHG signal was recorded. In comparing the two detection channels, the TPF results have greater variability. A possible justification is that the three samples were imaged in numerical order over the course of three weeks. Since formaldehyde is not able to fix elastin fibers18, some degradation probably occurred over time leading to weaker signals detected in the third sample. The protein densities can be considered a pathological index for the vocal fold tissue16. For example, collagen (type I) increases in density in the scarred tissue during the healing process. Our measured collagen area fraction has a similar distribution in all samples, reaching a maximum at a depth of 0.2–0.3 mm. This should correspond to the intermediate lamina propria4. The mean overall area fraction for the SHG was approximately 15%. A gender comparison could not be made because of insufficient data; however, due to higher stiffness in the female cover layer, a higher elastin density is expected.
A sinusoidal function was used to characterize the collagen fibril morphology (see Fig. 2). The variations of three regression constants are shown in Fig. 6. The overall orientation angle of the collagen network, θo, is aligned to the posterior-anterior direction (θo < 20°) down to a 0.9–1.0-mm depth. This trend may be regulated by the superficial and intermediate lamina propria, which bears the main portion of the axial stress. Beyond that region, the angle, θo, is different for the three samples. The periodicity, Ho, and the sinusoidal amplitude, Ro, are the parameters that control the threshold of linear load-deformation response. These parameters indicate the elongation needed between both ends of the network to uncurl the collagen fibrils. Straightening of the fibrils increases the tissue resistance to tensile load and this results in an increase in stiffness during stretching. Thanks to the polarized nature of the SHG signal, the directionality of the collagen fibrils can be measured as shown in Fig. 7. Noting the ideal case of axially orientated fibrils, this study found the collagen bundles in the vocal folds to be consistently distributed in all directions. However, a higher directionality was expected for the collagen fibrils21. A helical distribution of the fibrils in space can account for such variability in the polarization results. The dominant axis of the overall network is parallel to the vocal axis, as suggested by Fig. 6a. In summary, by incorporating a helical shape and polarization-resolved SHG data like those shown Fig. 6, one may create a multiscale model of the collagen network.
CONCLUSION
Nonlinear laser scanning microscopy (NLSM) is an ideal technique for specific sectioning imaging of extracellular matrix proteins in biological tissues because of its ability to image to depths of several hundred micrometers while minimizing the effects of photo-bleaching. It also removes the masking artefacts produced by surrounding proteins like glycosaminoglycans. The layerwise morphological information on collagen and elastin may allow clinicians to distinguish between healthy and diseased or abnormal tissues. By using the high-resolution three-dimensional imaging of NLSM, pathological studies would not be limited to examining thin histological sections of vocal folds. Implementation of recent developments in commercial NLSM systems would help laryngologists make rapid and reliable real-time intraoperative and post-excision diagnoses of vocal fold pathology.
Acknowledgments
This work was supported by National Institutes of Health grant (#R01-DC005877) to L. Mongeau and a Natural Sciences and Engineering Research Council of Canada (NSERC) Discovery grant to P.W. Wiseman. The authors would like to thank Dr. Sam Daniel (Division of Otolaryngology, Montreal Children’s Hospital, Montreal, QC) for providing the tissue samples. The authors are grateful for the valuable comments made by Karen K. Kost PhD, MD (Department of Otolaryngology – Head and Neck Surgery, McGill University, Montreal, QC).
Footnotes
Financial Disclosure:
No relevant financial relationships with commercial interests that pertain to the content of the manuscript
Conflict of Interest:
None
Note: This work was presented in “The Voice Foundation’s 40th Annual Symposium: Care of the Professional Voice” held by the voice foundation in Philadelphia, PA on June 5, 2011 (10:45 am).
Contributor Information
Amir K. Miri, Biomechanics Laboratory, Mechanical Engineering Department, McGill University, Montreal, QC H3A 2K6 CANADA.
Umakanta Tripathy, Physics Department, McGill University, Montreal, QC H3A 2T8 CANADA.
Luc Mongeau, Biomechanics Laboratory, Mechanical Engineering Department, McGill University, Montreal, QC H3A 2K6 CANADA.
Paul W. Wiseman, Physics Department, McGill University, Montreal, QC H3A 2T8 CANADA. Chemistry Department, McGill University, Montreal, QC H3A 2K6 CANADA.
BIBLIOGRAPHY
- 1.Branski RC, Verdolini K, Sandulache V, Rosen CA, Hebda PA. Vocal fold wound healing: a review for clinicians. J Voice. 2006;20:432–442. doi: 10.1016/j.jvoice.2005.08.005. [DOI] [PubMed] [Google Scholar]
- 2.Gray SD, Titze IR, Chan R, Hammond TH. Vocal fold proteoglycans and their influence on biomechanics. Laryngoscope. 1999;109:845–854. doi: 10.1097/00005537-199906000-00001. [DOI] [PubMed] [Google Scholar]
- 3.Hahn MS, Kobler JB, Starcher BC, Zeitels SM, Langer R. Quantitative and comparative studies of the vocal fold extracellular matrix I: elastic fibers and hyaluronic acid. Ann Otol Rhinol Laryngol. 2006;115:156–164. doi: 10.1177/000348940611500213. [DOI] [PubMed] [Google Scholar]
- 4.Hahn MS, Kobler JB, Zeitels SM, Langer R. Quantitative and comparative studies of the vocal fold extracellular matrix II: collagen. Ann Otol Rhinol Laryngol. 2006;115:225–232. doi: 10.1177/000348940611500311. [DOI] [PubMed] [Google Scholar]
- 5.Heris HK, Rahmat M, Mongeau L. Characterization of a hierarchical network of hyaluronic acid–gelatin composite for use as a smart injectable biomaterial. Macromolecular bioscience. 2011 doi: 10.1002/mabi.201100335. [DOI] [PMC free article] [PubMed] [Google Scholar]
- 6.Finck CL, Harmegnies B, Remacle A, Lefebvre P. Implantation of esterified hyaluronic acid in microdissected reinke’s space after vocal fold microsurgery: short- and long-term results. J Voice. 2010;24(5):626–635. doi: 10.1016/j.jvoice.2008.12.015. [DOI] [PubMed] [Google Scholar]
- 7.Ilgner J, Westhofen M. Laser interventions in otorhinolaryngology - Current techniques and future developments. Medical Laser Application. 2010;25:27–33. [Google Scholar]
- 8.Wisweh H, Merkel U, Huller AK, Lurben K, Lubatschowski H. Optical coherence tomography monitoring of vocal fold femtosecond laser microsurgery. Therapeutic Laser Applications and Laser-Tissue Interaction III. 2007;6632:6632071–6632075. [Google Scholar]
- 9.Zipfel WR, Williams RM, Christie R, Nikitin AY, Hyman BT, Webb WW. Live tissue intrinsic emission microscopy using multiphoton excited intrinsic fluorescence and second harmonic generation. Proc Natl Acad Sci USA. 2003;100:7075–7080. doi: 10.1073/pnas.0832308100. [DOI] [PMC free article] [PubMed] [Google Scholar]
- 10.Wang BG, Riemann I, Schubert H, Schweitzer D, Konig K, Halbhuber KJ. Multiphoton microscopy for monitoring intratissue femtosecond laser surgery effects. Lasers in Surgery and Medicine. 2007;39:527–533. doi: 10.1002/lsm.20523. [DOI] [PubMed] [Google Scholar]
- 11.Hoy CL, Everett WN, Kobler J, Ben-Yakar A. Towards endoscopic ultrafast laser microsurgery of vocal folds. Proc SPIE. 2010;7548:75483. doi: 10.1117/1.JBO.17.3.038002. [DOI] [PubMed] [Google Scholar]
- 12.Zoumi A, Yeh A, Tromberg BJ. Imaging cells and extracellular matrix in vivo by using second-harmonic generation and two-photon excited fluorescense. Proc Nat Acad Sci USA. 2002;99:11014–11019. doi: 10.1073/pnas.172368799. [DOI] [PMC free article] [PubMed] [Google Scholar]
- 13.Williams RM, Zipfel WR, Webb WW. Interpreting second-harmonic generation images of collagen I fibrils. Biophysical Journal. 2005;88:1377–1386. doi: 10.1529/biophysj.104.047308. [DOI] [PMC free article] [PubMed] [Google Scholar]
- 14.Freund I, Deutsch M. Second-harmonic microscopy of biological tissue. Optical Letters. 1986;11(2):94–96. doi: 10.1364/ol.11.000094. [DOI] [PubMed] [Google Scholar]
- 15.Garini Y, Vermolen BJ, Young IT. From micro to nano: recent advances in high-resolution microscopy. Current Opinion in Biotechnology. 2005;16:3–12. doi: 10.1016/j.copbio.2005.01.003. [DOI] [PubMed] [Google Scholar]
- 16.Belisle J, Zigras T, Costantino S, Cartier R, Butany J, Wiseman PW, Leask RL. Second harmonic generation micrsocopy to investigate collagen configuration: a pericarditis case study. Cardiovascular Pathology. 2010;19:e125–e128. doi: 10.1016/j.carpath.2009.06.001. [DOI] [PubMed] [Google Scholar]
- 17.Hantzakos A, Remacle M, Dikkers FG, Degols JC, Delos M, Friedrich G, Giovanni A, Rasmussen N. Exudative lesions of Reinke’s space: A terminology proposal. European Archives of Oto-Rhino-Laryngology. 2009;266(6):869–878. doi: 10.1007/s00405-008-0863-x. [DOI] [PubMed] [Google Scholar]
- 18.Fung YC. Biomechanics: Mechanical Properties of Living Tissues. New York, NY: Springer-Verlag; 1993. [Google Scholar]
- 19.Chan RW, Fu M, Young L, Tirunagari N. Relative contributions of collagen and elastin to elasticity of the vocal fold under tension. Ann Biomed Eng. 2007;35:1471–1483. doi: 10.1007/s10439-007-9314-x. [DOI] [PubMed] [Google Scholar]
- 20.Belisle JM. Master Thesis. Submitted to McGill University; Montreal, QC: 2006. Design and assembly of a multimodal nonlinear laser scanning microscope. [Google Scholar]
- 21.Tateya T, Tateya I, Bless DM. Collagen subtypes in human vocal folds. Ann Otol Rhinol Laryngol. 2006;115(6):469–476. doi: 10.1177/000348940611500612. [DOI] [PubMed] [Google Scholar]
- 22.Zipfel WR, Williams RM, Webb WW. Nonlinear magic: multiphoton microscopy in the biosciences. Nat Biotechnol. 2003;21:1369–1377. doi: 10.1038/nbt899. [DOI] [PubMed] [Google Scholar]
- 23.Comninou M, Yannas IV. Dependence of stress-strain nonlinearity of connective tissues on the geometry of collagen fibers. J Biomechanics. 1976;9(7):427–433. doi: 10.1016/0021-9290(76)90084-1. [DOI] [PubMed] [Google Scholar]