Abstract
The sonar beam of an echolocating bat forms a spatial window restricting the echo information returned from the environment. Investigating the shape and orientation of the sonar beam produced by a bat as it flies and performs various behavioral tasks may yield insight into the operation of its sonar system. This paper presents recordings of vertical and horizontal cross-sections of the sonar beam produced by Eptesicus fuscus (big brown bats) as they fly and pursue prey in a laboratory flight-room. In the horizontal plane the sonar beam consists of one large lobe and in the vertical plane the beam consists of two lobes of comparable size oriented frontally and ventrally. In level flight, the bat directs its beam such that the ventral lobe is pointed forward and down toward the ground ahead of its flight path. The bat may utilize the downward directed lobe to measure altitude without the need for vertical head movements.
Keywords: echolocation, sonar, side-lobe, altimeter
I. INTRODUCTION
Insectivorous echolocating bats, such as the big brown bat, Eptesicus fuscus, navigate and forage for airborne insects in darkness. They produce intermittent pulses of directed ultrasound and use the information contained in the returning echoes to detect, localize and track flying insect prey, relying on hearing to guide complex spatial behaviors1,2. The sonar beam is directional1 and may serve as a spatial window, restricting the region of space where the bat gathers information. Knowing the shape and direction of the sonar beam as the bat performs sonar tasks is therefore important to our understanding of bat echolocation.
The sonar beam in stationary, head-fixed bats has been studied by several investigators3,4. Hartley and Suthers performed detailed studies of the sonar beam in E. fuscus by measuring the shape of the beam in both elevation and azimuth in multiple frequency bands5. The bats were anesthetized and positioned on a platform that controlled the position of the head. The midbrain was electrically stimulated to elicit ultrasonic vocalizations. The sonar beam pattern recorded in that condition consisted of a large main lobe. At frequencies higher than 60 kHz a second lobe appeared, 6 dB less intense than the main lobe. This second lobe was located ventral to the main lobe, at an angle of 30°.
It is not known whether the sounds elicited by brain-stimulation in a stationary, head-fixed bat produce beam patterns similar to that in a flying bat. The sonar beam pattern depends not only on the frequency content of the signal, but also on the shape of the vocal cavity and, potentially, the configuration of other body structures, such as wings, during the time of emission. It is important, therefore, to study the sonar beam patterns produced by bats executing natural echolocation behaviors in flight such as insect capture. In this study we recorded vertical and horizontal cross-sections of the sonar beam produced by echolocating bats as they flew and pursued prey in a laboratory flightroom. We were limited by technical considerations to recording a narrow band of frequencies. We chose a frequency band centered around 35 kHz since this is roughly the peak of the first-harmonic sweep, and we found that, within this band, we could record signals from all foraging stages. In contrast to the study by Hartley and Suthers we find evidence for a second lobe, directed ventrally to the main lobe, at these lower frequencies. The size of the ventral lobe is comparable to the frontal “main” lobe. We speculate that the ventral lobe may serve to generate a ground-return that helps the bat to measure its altitude in flight without the need for head movements.
II. METHODS
A. Behavioral experiments
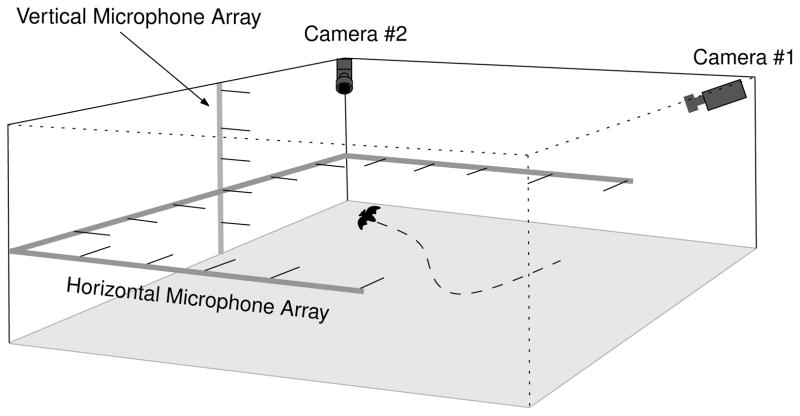
We trained two bats of the species E. fuscus to fly individually in a large (L7.3m × W6.4m × H2.5m) laboratory flightroom (Fig. 1). The bats were trained to catch insects (mealworms) suspended from a tether. The tether was attached to a motorized boom placed at random points under the ceiling. The insect could be hung stationary from the boom, or swung in horizontal arcs by the boom to present a moving target to the bat. The walls and ceiling of the flight room were lined with sound-absorbent acoustic foam (Sonex One, Acoustical Solutions, Inc., Richmond, VA) to reduce reverberations. The room was illuminated by dim, long wavelength light (> 650 nm, light from normal incandescent bulbs passed through a infrared filter plate - Plexiglas G #2711, Atofina Chemicals, Philadelphia, PA) to which E. fuscus is insensitive6. Stereo images from two high speed video cameras (Kodak MotionCorder, CCD based cameras operating at 240 frames-per-second (4.16 ms sampling interval), synchronized to 1/2 frame accuracy) were used to reconstruct the three-dimensional flight path of the bat and the trajectory of the prey. Simultaneously, an array of 20 microphones (Knowles Co, FG 3329, electret) recorded the sonar beam pattern produced by the bat. 16 microphones were arranged in a horizontal U-shape around the room to extract the horizontal aspect of the sonar beam. The remaining 4 microphones were arranged vertically on one wall of the room. These four microphones and one microphone from the horizontal arrangement formed a five microphone vertical array that enabled us to record vertical cross-sections of the emitted sonar beam. The Knowles microphones have a small membrane diameter (~ 1 mm) and are omnidirectional at 35 kHz (λ35 kHz = 9.7 mm) enabling recording of the beam pattern as the bat flies around the room7. The microphone signals were amplified, band-pass filtered (fc = 35 kHz, Q−3db = 2.5, half-power band ranging from 28 kHz to 42 kHz) and then processed through a envelope extractor circuit. The envelopes of the bat vocalizations were digitized at 20 kHz and stored on a computer for later analysis7.
FIG. 1.
Laboratory flight room.
B. Computation of the sonar beam pattern
The envelope traces were used to compute the received intensity of the sonar beam, Irm, at each microphone m. This intensity was corrected for spherical spreading loss and atmospheric attenuation to obtain the corrected, normalized intensity, Icm at each microphone. Previous experiments on stationary anesthetized bats5 and from flying bats7,8 have indicated that the sonar beam is horizontally symmetrical. In this study we fit the horizontal sonar beam pattern to a Gaussian shape in order to extract the sonar beam-axis direction. The fit is performed by adjusting the direction and width of the Gaussian beam pattern to obtain the least-mean-square error to the observed beam pattern. We have previously used a vector averaging method7 to obtain the sonar beam direction. We observed that fitting the sonar beam to a Gaussian shape before computing the axis direction made the computation less sensitive to edge effects7 (Section III C) and less sensitive to variations in the recorded sonar beam profiles from vocalization to vocalization.
C. Microphone array calibration
The microphone array was calibrated for gain and frequency response by playing ultrasonic frequency sweeps of a fixed amplitude from a ultrasonic speaker with a circular aperture of 1.5cm placed at a fixed distance (40cm) and orientation to each microphone. A gain factor was computed for each array channel (microphone and signal processing circuit) that normalized the recordings across all the channels. This speaker was also used as a control emitter to test the microphone array. Recordings of cross-sections of the sonar beam produced by the control emitter appeared as single lobes on the horizontal and vertical arrays.
III. RESULTS
We analyzed flight paths, vocalization timing patterns and sonar-beam patterns from a total of 15 flights from two bats as they intercepted insects. Horizontal sonar beam patterns appeared as a single lobe, consistent with previous recordings7. In all trials, however, we observed notched beam shapes recorded by the vertical array.
A. The sonar beam has a prominent notch in the dorso-ventral plane
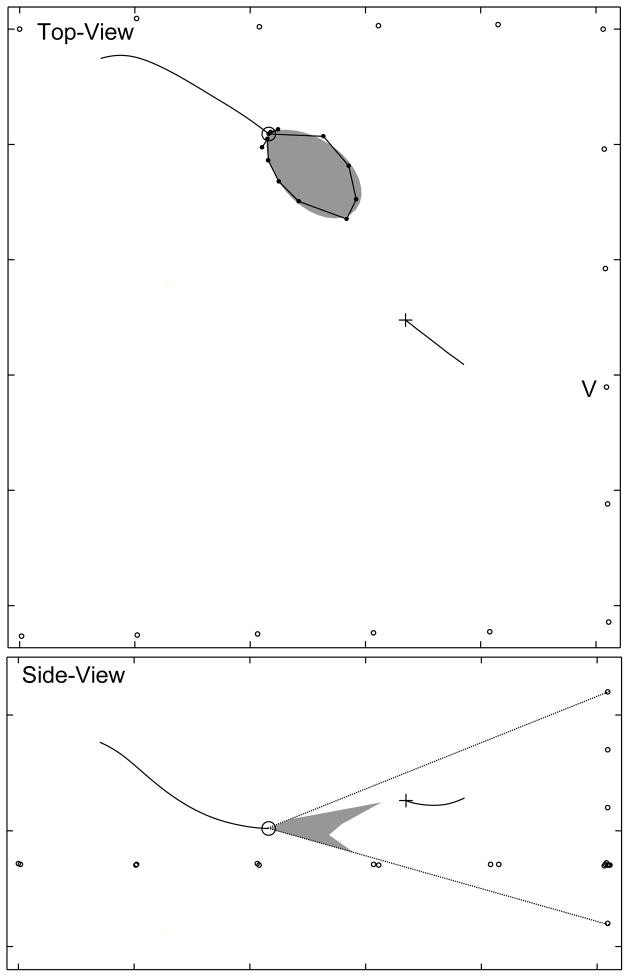
We observed a prominent notch in the vertical sonar beam profile. Fig. 2 shows the sonar beam pattern of a single vocalization. The top panel shows the top-view of the flight room. The bottom panel shows the sonar beam profile recorded by the vertical array. The dotted lines show the “field-of-view” of the vertical array. These lines show the angular limits of the vertical array, beyond which we can not measure the sonar beam pattern. As can be seen, in contrast to the single prominent lobe shape of the horizontal cross-section, the vertical cross-section presents a forked shape. This shape is suggestive of two lobes of comparable size arranged dorso-ventrally. At this stage the bat was producing pulses at a low repetition rate (<20 Hz) which are associated with searching behaviors. The bat’s flight maneuvers suggest it was not responding to the target yet.
FIG. 2.
The sonar beam of flying E. fuscus has a vertical notch. Top panel: The small black circles are the positions of the array microphones, the black line is the flight path of the bat, the black circle is the current position of the bat. The dark gray polar plot represents the smoothened profile of the horizontal sonar beam, with radius proportional to normalized intensity. The black dots joined by a line are the unsmoothened measured intensities. The black line is the trajectory of the tethered insect and the black cross is the present position of the insect. The position of the vertical array is indicated by the label ’V’. Bottom panel: Polar plot of the vertical section of the sonar beam recorded by the vertical array (Gray polygon). Dotted lines show the angular limits of the vertical array measurement. The bat is producing pulses at a slow repetition rate (<20 Hz) at this stage.
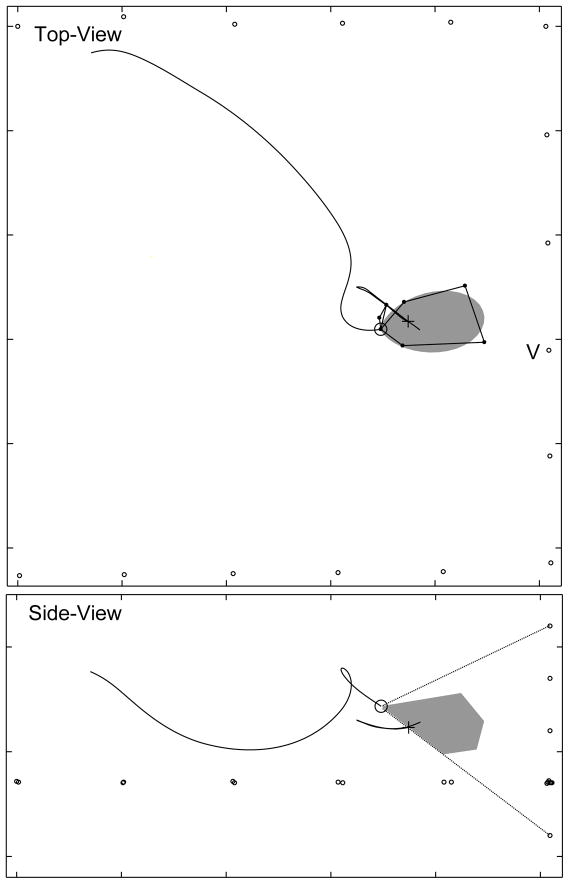
Fig. 3 shows the sonar beam pattern of a vocalization approximately one second later for the trial shown in Fig. 2. At this time, the bat was producing pulses at a high repetition rate (>100 Hz) and was responding to the target. The vertical sonar beam profile shows no evidence of a notch for this vocalization. If the bat’s sonar beam had two prominent lobes in the vertical plane and if the bat was directing its sonar beam down at the target (black cross) such that the location of the lower lobe is below the lower angular limit of the array (black dotted lines) this is the expected shape of the recorded sonar beam cross-section. Figs. 4 – 6 present further evidence that the bat moves the sonar beam in the vertical plane, perhaps in order to track the vertical position of the target.
FIG. 3.
The bat may move its sonar beam up and down. This figure shows a sonar beam pattern approximately 1 s after the vocalization shown in Fig. 2. The top-view panel shows that the bat is responding to the target by adjusting its flight path and that the horizontal aspect of the beam is locked to the target. The side-view panel shows no evidence of a notch in the beam. If the bat’s sonar beam had two prominent lobes in the vertical plane and if the bat was directing its sonar beam down at the target (black cross) such that the location of the lower lobe is below the lower angular limit of the array (black dotted lines) this is the expected shape of the recorded sonar beam cross-section.
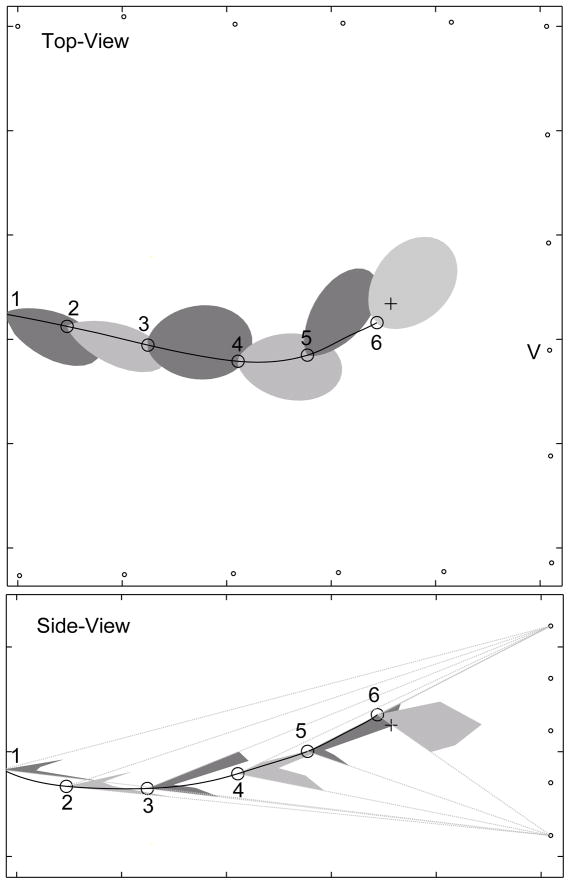
FIG. 4.
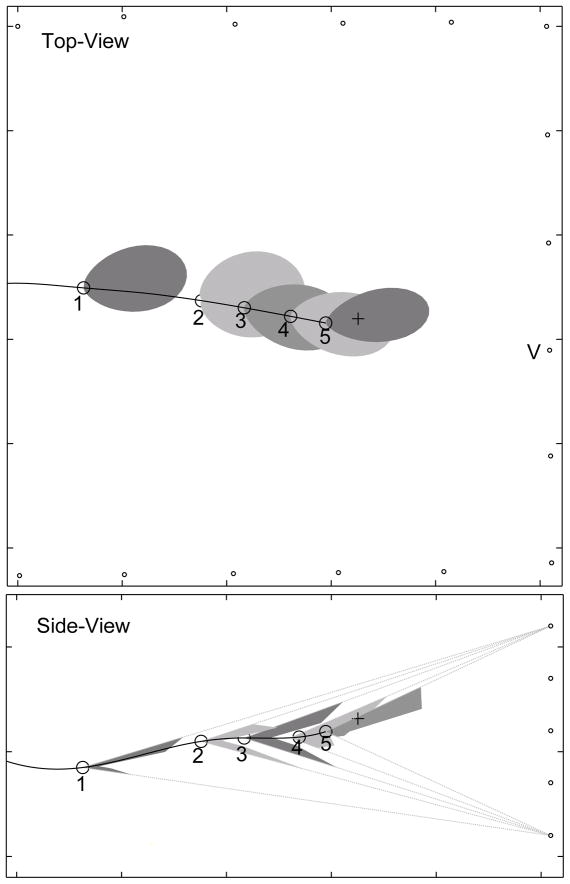
The bat may move its beam up and down to track the target. This figure shows some vocalizations from bat #1 during a prey interception. To improve clarity not all vocalizations in the train produced by the bat are shown in the diagram. The top-panel shows horizontal cross-sections of the sonar beam, bottom-panel shows vertical cross-sections. Dotted lines in the bottom panel show the “field-of-view” of the vertical array. Vocalization samples 1 to 4 were produced at a low rate (<20 Hz) while 5 and 6 are taken from a train of pulses produced at a high rate (>100 Hz). Samples 1 to 5 show a prominent notch in the vertical cross-section, while the notch is absent in 6. The bat is responding to the target during 5 and 6, and is swooping down on the target during 6. In the side-view the horizontal array is omitted for clarity.
FIG. 6.
A sequence of beam-patterns from bat #1. As in Fig. 5, for the last beam pattern shown, when the bat is in the terminal stage of insect capture, no notch is recorded by the vertical array, consistent with the hypothesis the bat is directing its sonar beam up towards the target.
Fig. 4 shows six vocalizations from a sequence of calls made by bat #1 as it intercepted a tethered insect. To reduce clutter in the diagram, not all vocalizations in the pulse train produced by the bat are shown. Dotted lines in the bottom panel show the “field-of-view” of the vertical array beyond which the shape of the vertical beam could not be recorded. Vocalization samples 1 through 5 show a prominent notch in the vertical cross-section, while the notch is absent in 6. The bat is responding to the target during 5 and 6, and is swooping down on the target during 6. The vertical sonar beam patterns are consistent with the hypothesis that the bat’s sonar beam has two lobes arranged dorso-ventrally. During vocalization samples 1 through 4 the bat is directing the beam such that one lobe points up and the other down to the ground. The absence of a notch in 6 is consistent with the bat directing its beam downward, with the main lobe pointing in the direction of the target.
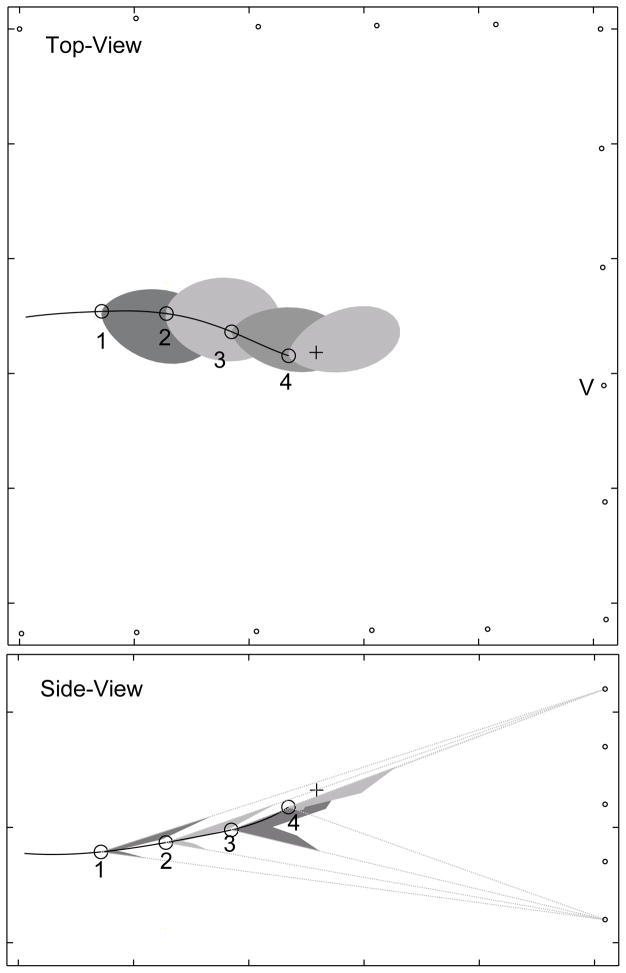
Fig. 5 and Fig. 6 show vocalization sequences from bat #1 and bat #2 respectively, each showing the notched appearance of the sonar beam. Initially the bat is producing signals at a low rate (<20 Hz). In later stages the bat locks its beam onto the target (black cross) in the horizontal plane and produces vocalizations at a high rate (>100 Hz). At the end of both sequences, the vertical array records one lobe. At this point in the pursuit, the target is higher than the bat. The last pattern recorded is consistent with the bat directing its beam upwards, so that only part of one lobe is picked up by the vertical array (also see Fig. 10). This observation suggests that the bat may also track the position of the target in the vertical plane with its sonar beam. Webster and Brazier9 performed strobe photography on bats chasing targets and suggested that bats track targets in the vertical as well as horizontal plane by adjusting head direction.
FIG. 5.
A sequence of beam-patterns from bat #2. Beam pattern samples 1 to 3 show the notched beam pattern in the vertical array. The bat is producing signals at a low rate (<20 Hz) during patterns 1 and 2, and a high rate (>100 Hz) during patterns 3 and 4. The notch disappears from the recording for sample 4, consistent with the hypothesis the bat is directing its sonar beam up towards the target (black cross).
FIG. 10.
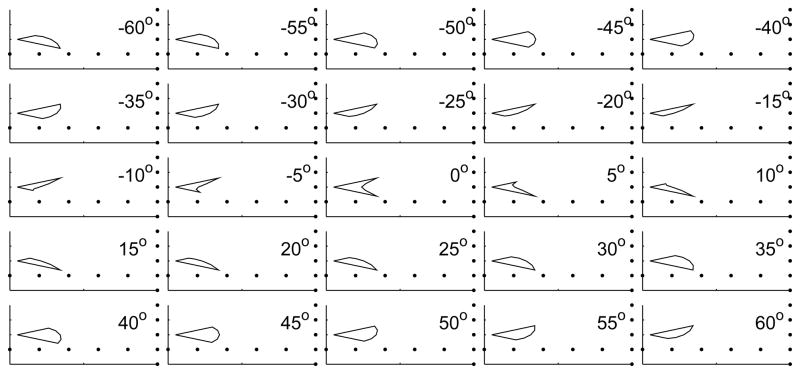
Effect of sweeping the model beam in the vertical plane. The model sonar beam is swept from −60 degrees to +60 degrees in 5 degree increments and the cross-section pattern that would be obtained by the vertical-array is simulated. When the sonar beam orientation is within ±5 degrees of the horizontal the vertical cross-section presents a notched appearance. Larger angles result in only part of one lobe being captured.
We analyzed a total of 279 vocalizations produced by 2 bats, from 13 flights. Of these 61 (22%) vocalizations had a notch deeper than 3dB (half power). A notch was defined as a dip in the sonar beam intensity profile flanked on both sides by intensities greater than or equal to twice the notch intensity. Most of the notched calls appear during the lower repetition rate (approach) phase of insect capture. At pulse rates below 50 Hz, 50 % (58/117) of the calls had 3dB deep notches, while at pulse rates above 50 Hz, only 2 % (3/162) of the calls had notches 3dB deep. During the higher pulse repetiton rate phases the big brown bat increases the bandwidth of its vocalizations and shifts the peak energy of its calls10. This change in energy at different frequencies should change the overall sonar beam pattern shape, assuming a constant aperture size. Our apparatus measures energy from a fixed, narrow band of frequencies centered at 35 kHz and our reconstructed sonar beam shape should not vary simply due to different energy distributions.
B. Control measurements
We controlled for the possibility that a systematic error in either the hardware or the calibration procedure lead to one or more of the vertical array microphones giving a consistently low or high reading. This erroneous reading could have given rise to a notch artifact on the array recordings. We used an emitter with a circular aperture to ensonify the microphone array. The emitter was stimulated by a frequency sweep of the same bandwidth as bat sonar vocalizations. The recorded beam patterns on both the vertical and horizontal array appeared as single lobes. Instances (like Fig. 3) where only one lobe is recorded on the vertical array also serve as control measurements to eliminate the possibility of systematic errors with the gain.
If the different envelope detectors had band-pass characteristics that were sufficiently mismatched, then a given vocalization, if sufficiently narrow band, may result in a notch artifact being observed on the microphone channel that is outside the bandwidth of the signal. We controlled for this possibility by testing the frequency response of the envelope detector circuits and ensuring that the peak response did not vary from the designed value by more than 2 kHz.
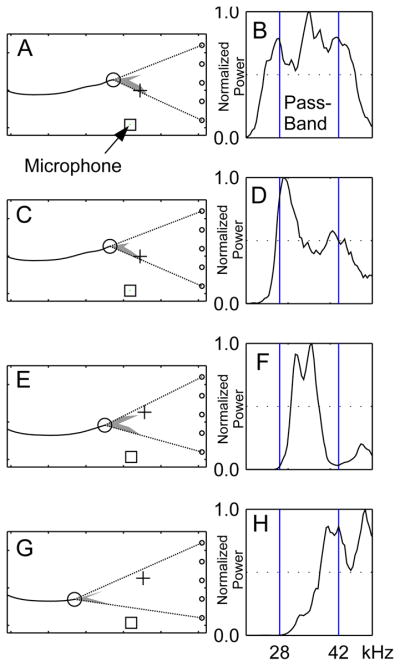
We also inspected the power spectra of full-bandwidth recordings of vocalizations that produced a notch (Fig. 7). We verified that notched beam patterns were observed for vocalization spectra that spanned the entire bandwidth of the filters (Fig. 7B). We also verified that notched beam patterns were observed for vocalizations with power in the lower (Fig. 7D), middle (Fig. 7F) and higher (Fig. 7H) ends of the filter bandwidth. Though the microphone used for broad band ultrasonic recordings did not record the exact signal received at the vertical array (The power spectra of the signals recorded at the array are likely to be different due to the frequency dependent directionality of the sonar beam), the examples show that the notch is unlikely to be due to any mismatch of the filters.
FIG. 7.
Control for bandwidth. A)C)E)G) Examples of notched sonar beam patterns emitted by the bat. B)D)F)H) Power spectra (linear scale) of the corresponding bat calls. The band-width of the filter used for the envelope extraction is indicated by vertical lines on the power spectra plots. Power spectra of the call spans: B) the entire pass-band, D) the lower end, F) the middle and H) the higher end of the envelope-detectors. The black square shows the position of the ultrasonic microphone from which the spectra are generated.
Echoes of the original bat vocalization that reached the microphone array to create destructive interference may also create a notched beam for specific positions of the bat. We, however, observed the vertical notch consistently as the bat traveled in different parts of the room, so we believe it to be unlikely that such a consistent observation from different emitter locations would result from multi-path interference.
C. The sonar beam may consist of two lobes arranged dorso-ventrally
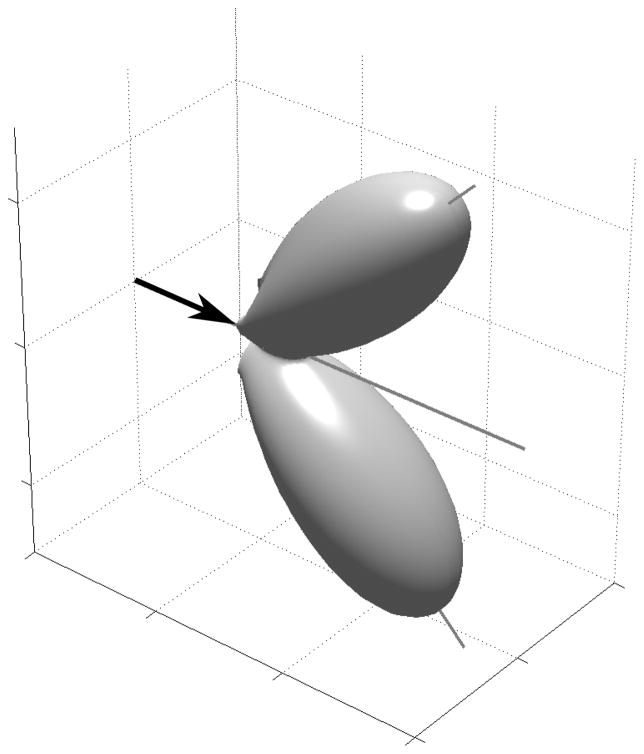
We constructed a three-dimensional model of the bat’s sonar beam in an effort to replicate the experimental observations via numerical simulations. We found that a model of the sonar beam consisting of two equally-sized lobes oriented dorso-ventrally (Fig. 8) could replicate the experimental findings. We modeled each lobe as the emission pattern of a single piston source5,11 extended to three-dimensions. Let P be the ratio of the sound pressure in the direction θ (azimuth), φ (elevation) to the on axis sound pressure. J1 is the Bessel function of order one. Let k be the wavelength constant, given by 2πf/c where f is the frequency of the sound source, and c = 340m/s, the speed of sound. Let ah and av be the horizontal and vertical diameters of the emitter. A single lobe is modeled as
FIG. 8.
Phenomenological three-dimensional model of the bat sonar beam. In this model the sonar beam consists of two equal sized lobes, directed ζ degrees apart in the dorso-ventral plane. Each isolated, individual lobe is modeled as the beam from a piston source. The drawing of the bat is merely schematic. No inference is made about the relation between the vertical orientation of the bat’s head and the vertical orientation of the hypothesized beam.
| (1) |
Our model consists of two lobes oriented at an angle ζ apart in the vertical plane. They are represented by the equations
| (2) |
and
| (3) |
The equations for sound pressure for two lobes are combined to obtain the sound intensity of the complete model as
| (4) |
For the simulations we used f = 35 kHz, ah = 4 mm and av = 6 mm and ζ = 90 degrees. Hartley and Suthers5 used a = 4.7 mm from some measurements of the open mouth of E. fuscus in their experiment. We arbitrarily chose two values for ah and av that reflect both the asymmetry of the open mouth (which opens wider vertically than horizontally) and the asymmetry of the beam (which is wider horizontally than vertically5).
This is a phenomenological model of the beam and we do not propose any specific structure in the bat that creates this pattern. In the vertical plane it approximates the emission pattern obtained by placing two isotropic sources close together12, but in the horizontal plane it resembles the emission pattern of a piston source5,11. We define the horizontal position of the beam (0 degrees) to be such that the two lobes are symmetrically above and below the horizontal plane (as shown in Fig. 8).
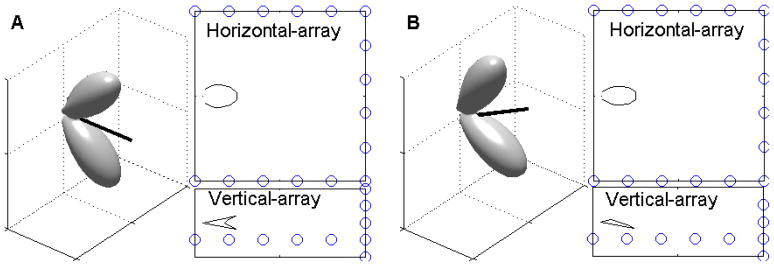
Figs. 9 and 10 show how this three-dimensional model of the sonar beam is able to replicate the sonar beam cross-sections recorded by both the horizontal and vertical segments of the array. Fig. 9 shows simulations of the sonar beam cross-sections that would be recorded by the horizontal and vertical segments of the microphone array. In (A) the model beam is oriented at 0 degrees to the horizontal, such that the two lobes are symmetrically above and below the horizontal plane. The simulated measurement from the vertical array shows a prominent notched shape. In (B) the model beam is directed upwards by 30 degrees. The simulated measurement from the vertical array only captures part of the lower lobe.
FIG. 9.
Simulated array measurements of the three-dimensional model. A) The model beam is oriented at 0 degrees, such that the two lobes are symmetrically above and below the horizontal plane (three dimensional plot). The simulated measurement from the horizontal array (top-panel) shows a single lobe. The simulated measurement from the vertical array (bottom-panel) shows a notched pattern. B) The model beam is oriented up by 30 degrees. The simulated measurement from the vertical array only captures part of the lower lobe.
Fig. 10 shows the results of sweeping the model beam from −60 degrees to +60 degrees in the vertical plane. When the beam is oriented within ±5 degrees of the horizontal the vertical cross-section presents a notched appearance. Larger angles result in only part of one lobe being captured, giving rise to a single lobed appearance. The simulated vertical cross-sections shown in this figure are comparable to the measured vertical cross-sections from flying bats shown in previous figures.
In our simulation we chose a model with two equal sized lobes directed 90 degrees apart. This model is one representative from a class of multiple lobed models that fit the observations. It is possible to obtain similar results with two lobes 60 degrees apart and with lobes that differ in intensity by a factor of two. Lobes that are closer together and/or have larger intensity differences fail to produce the prominent notch observed in our experiments. Lobes that are much further apart than 90 degrees would produce a wider “valley” than what we observe in our experiments. The exact beam shape may vary across vocalizations and may depend on the physical characteristics of each individual bat.
IV. DISCUSSION
The sonar beam pattern of an echolocating bat restricts the spatial region sampled by its echolocation system. Study of the shape and direction of the beam during flight may yield insight into how the bat gathers information to guide behavior. We measured horizontal and vertical cross-sections of the sonar beams emitted by big brown bats flying in a laboratory flight room. We observed a prominent notch in the vertical cross-section of the beam. Our observations are consistent with the hypothesis that the bat can emit a sonar beam with at least two lobes of comparable size arranged dorso-ventrally.
A previous study on the beam patterns emitted by electrically stimulated anesthetized E. fuscus5 reported that the sonar beam of these bats consisted of a main lobe and, at frequencies above 60 kHz, a ventral lobe 6 dB less intense than the main lobe. The ventral lobe was directed 30 degrees below the main lobe. The authors concluded that, at higher frequencies, the width of the main lobe could be explained by a piston model. This model, however, broke down at frequencies below 25 kHz. The bat’s beam remained directional at these frequencies, while the model predicted an almost omni-directional beam. The authors also report that the ventral lobe is not explained by any simple model.
In our study, conducted on flying bats, we also observe a splitting of the sonar beam into a ventral and dorsal lobe. Unlike Hartley’s study, we observe that this split occurs in the 35 kHz frequency range and infer that the lobes are of comparable size and separated in direction by a larger angle (ranging from 60 to 90 degrees). We cannot currently infer the full shape of the sonar beam at multiple frequencies because of sampling limitations in the measurement apparatus. A more detailed analysis of the sonar beam pattern cross-sections, combined with a denser and wider experimental sampling of the sonar beam, is required to determine the exact shape and variability of the sonar beam in flight. Methods that are designed to record the sonar beam pattern in one shot are likely to be more successful than methods that attempt to combine multiple partial snapshots of the sonar beam into a composite whole because the beam pattern can vary greatly from vocalization to vocalization13.
The observation that the notch is prominent in about 50% of our samples taken at low call repetition rates suggests that the bat may rotate a multi-lobed sonar beam up and down in the vertical plane. This observation is also consistent with the hypothesis that the bat is capable of producing sonar beams with or without prominent multiple lobes. Since the extent of the vertical array was limited we can not eliminate the possibility that the bats adjusted not only the direction, but also the shape of the emitted beam.
The multiple sonar beam lobes of a bat may serve specialized roles in the bat’s echolocation system. We suggest that the forward directed lobe of a bat’s sonar beam gathers information about insects and obstacles while the ventrally directed lobe provides the bat with information about the ground, such as altitude. Such specialization within a sensory system is seen, for example, in the visual system of raptors. Raptors have two foveae that ‘look’ in different directions14. The temporal fovea receives information from the frontal (binocular) visual field while the central fovea receives information from the lateral visual field and is connected to the visual streak (a narrow, linear region of tightly-packed photoreceptors, providing high-spatial acuity). Observations indicate that a bird tracks its prey with the temporal fovea15 while the visual streak is hypothesized to help the bird locate the horizon while flying.
Griffin and Buckler16 addressed the very interesting possibility that migrating birds can sense the type of surface below them from echoes of their calls. From aerial measurements of echoes from different surfaces at frequencies below 6 kHz the authors suggested that birds, assuming their calls radiated omnidirectionally, could hear echoes from the ground, and potentially determine the nature of the terrain they were flying over. Compared to birds, bats typically emit and are sensitive to much higher frequencies (>20 kHz). These higher frequency sounds form more directional beams and are subject to greater attenuation by the atmosphere17. In order to sense the ground from high altitudes, bats emitting a single lobed sonar beam may need to scan their head downwards to obtain a detectable echo from the ground. By emitting a sonar beam with two lobes, one directed forward and the other downward, a bat would be able to sense the terrain ahead while scanning for prey in the air without making additional head movements.
Acknowledgments
We thank the Knowles company for donating several samples of their FG3329 electret microphone, which were used to build the array used in the experiments. We thank Chen Chiu for help with some of the experiments. Thanks go to Murat Aytekin for suggesting inclusion of the field-of-view lines in the sequence plots to aid in their interpretation. This work was supported by National Institutes of Health (NIH) P-30 Center Grant DC04664, NSF grant IBN0111973 to CFM., NIH-NIBIB grant 1 R01 EB004750-01 to TKH and CFM (as part of the NSF/NIH Collaborative Research in Computational Neuroscience Program), AFOSR grant FA95500410130 to TKH and the UMD-CP Psychology Dept. Jack Bartlett fellowship to KG.
Contributor Information
Kaushik Ghose, Neuroscience and Cognitive Science Program, Institute for Systems Research, Dept. of Psychology, University of Maryland College Park MD 20742.
Cynthia F. Moss, Neuroscience and Cognitive Science Program, Institute for Systems Research, Dept. of Psychology, University of Maryland College Park MD 20742
Timothy K. Horiuchi, Neuroscience and Cognitive Science Program, Institute for Systems Research, Dept. of Electrical and Computer Engineering, University of Maryland College Park MD 20742
References
- 1.Griffin DR. Listening in the dark. Yale University Press; CT: 1958. [Google Scholar]
- 2.Griffin DR, Webster FA, Michael CR. The echolocation of flying insects by bats. Anim Behav. 1960;8:141–154. [Google Scholar]
- 3.Grinnell AD, Schnitzler H-U. Directional sensitivity of echolocation in horseshoe batRhinolophus-ferrumequinum 2. Behavioral Directionality of Hearing. Journal of Comparative Physiology A: Sensory, Neural and Behavioral Physiology. 1977;116:63–76. [Google Scholar]
- 4.Schnitzler H-U, Grinnell AD. Directional sensitivity of echolocation in horseshoe bat, Rhinolophus-ferrumequinum 1. Directionality of sound emission. Journal of Comparative Physiology A: Sensory, Neural and Behavioral Physiology. 1977;116:51–61. [Google Scholar]
- 5.Hartley DJ, Suthers RA. The sound emission pattern of the echolocating bat, Eptesicus fuscus. J Acoust Soc Am. 1989;85:1348–1351. doi: 10.1121/1.395684. [DOI] [PubMed] [Google Scholar]
- 6.Hope GM, Bhatnagar KP. Electrical response of bat retina to spectral stimulation: comparison of four microchiropteran species. Experientia. 1979;35:1189–1191. doi: 10.1007/BF01963279. [DOI] [PubMed] [Google Scholar]
- 7.Ghose K, Moss CF. The sonar beam pattern of a flying bat as it tracks tethered insects. J Acoust Soc Am. 2003;114:1120–1131. doi: 10.1121/1.1589754. [DOI] [PMC free article] [PubMed] [Google Scholar]
- 8.Ghose K, Moss CF. Steering by hearing: A bat’s acoustic gaze is linked to its flight motor output by a delayed, adaptive linear law. J Neurosci. 2006;26:1704–1710. doi: 10.1523/JNEUROSCI.4315-05.2006. [DOI] [PMC free article] [PubMed] [Google Scholar]
- 9.Webster FA, Brazier OG. Technical Report. Aerospace Medical Research Labs, Wright-Patterson; 1965. Experimental studies on target detection, evaluation and interception by echolocating bats. [Google Scholar]
- 10.Surlykke AF, Moss CF. Echolocation behavior of big brown bats, Eptesicus fuscus, in the field and the laboratory. J Acoust Soc Am. 2000;108:2419–2429. doi: 10.1121/1.1315295. [DOI] [PubMed] [Google Scholar]
- 11.Kinsler LE, Frey AR. Fundamentals of Acoustics. 2. John Wiley; NewYork: 1962. [Google Scholar]
- 12.Strother GK, Mogus M. Acoustical Beam Patterns for Bats: Some Theoretical Considerations. J Acoust Soc Am. 1970;48:1430–1432. doi: 10.1121/1.1912304. [DOI] [PubMed] [Google Scholar]
- 13.Aytekin M. PhD thesis. University of Maryland; College Park, Md: 2007. Sound Localization by Echolocating Bats. [Google Scholar]
- 14.Martin GR. Eye. Vol. 3. Academic Press; London: 1988. pp. 311–373. [Google Scholar]
- 15.Land MF. The roles of head movements in the search and capture strategy of a tern (Aves, Laridae) Journal of Comparative Physiology A: Sensory, Neural and Behavioral Physiology. 1999;184:265–272. [Google Scholar]
- 16.Griffin DR, Buckler ER. Echolocation of extended surfaces. Springer-Verlag; Berlin: 1978. pp. 201–208. [Google Scholar]
- 17.Lawrence BD, Simmons JA. Measurements of atmospheric attenuation at ultrasonic frequencies and the significance for echolocation by bats. J Acoust Soc Am. 1982;71:585–590. doi: 10.1121/1.387529. [DOI] [PubMed] [Google Scholar]


