Abstract
Objective
To demonstrate the capability of directly visualizing the tear film on contact lenses using optical coherence tomography (OCT).
Methods
Six eyes of three healthy subjects wearing PureVision and ACUVUE Advance soft and Boston RGP hard contact lenses were imaged with a custom built, high speed, ultra-high resolution spectral domain optical coherence tomograph. Refresh Liquigel was used to demonstrate the effect of artificial tears on the tear film.
Results
Ultra high resolution images of the pre- and post-lens films were directly visualized when each lens was inserted onto the eye. After the instillation of artificial tears during lens wear, the tear film was thicker. The post-lens tear film underneath the lens edge was clearly shown. Interactions between the lens edges and the ocular surface were obtained for each of the lens types and base curves. With a contrast enhancement agent, tear menisci on the contact lenses around the upper and lower eyelids were highlighted. With hard contact lenses, the tear film was visualized clearly and changed after a blink when the lens was pulled up by the lid.
Conclusions
Ultra-high resolution OCT is a potentially promising technique for imaging tears around contact lenses. This successful demonstration of in situ post-lens tear film imaging suggests that OCT could open a new era in studying tear dynamics during contact lens wear. The novel method may lead to new ways of evaluating contact lens fitting.
Keywords: Tear dynamics, Optical coherence tomography, Contact lens
The tears on contact lenses are critical for maintaining clear vision, ocular comfort, and health. The lens on the eye needs to be wet on both sides, and the tears underneath the lens need to be exchanged continuously. It is very common for soft contact lens wearers to experience dry eye, especially in the afternoon after wearing the lens for a period of time.1,2 Studies showed that dry eye sensation is a common cause of contact lens drop-out.1,2 To evaluate contact lens fitting, observation of lens centration, movement, and coverage using slit lamp microscopy may not be enough to understand the cause of dry eye sensations. Lenses composed of different materials and designs may have unique fitting characteristics that can impact pre- and post-lens tear films and the relationship between the lens edge and ocular surface. These features may result in different levels of ocular comfort. Changes in tear distribution and dynamics during lens wear remain unknown due to the extreme difficulty of simultaneously imaging both tears and hard or soft contact lenses.
Technologic advancements have enabled the development of ultra-high resolution optical coherence tomography (OCT). The purpose of this study was to apply this new technology to better understand tear distribution and dynamics in contact lens wearers. This article report the results of in situ imaging of the tear film on the lens surfaces and at the edges where they interface with the tears and the ocular surface.
SUBJECTS AND METHODS
The study was approved by the research review board of the University of Miami. Normal healthy subjects were recruited. The subject had no previously diagnosed dry eye and no dry eye symptoms. Informed consent was obtained from the subjects who were treated in accordance with the tenets of the Declaration of Helsinki.
Providing the full description of tears on the contact lens requires imaging a precise and rapidly repeated cross-section of tears on the lens surfaces, at the lens edges, and at the tear menisci around both eyelids. A custom built, high speed, ultra-high resolution spectral domain optical coherence tomo-graph was used for this study. We used a three-module super-luminescent diode light source (Broadlighter, T840-HP, Super-lumdiodes Ltd, Moscow, Russia) with a center wavelength of 840 nm and a full width at half maximum bandwidth of 100 nm. The light source provided a low coherence light at a power of 15 mW exiting the single mode optical fiber pigtail. The low coherence light, after passing through a fiber pig-tailed isolator, was coupled into a fiber-based Michelson interferometer. The interferometer included a 2 × 2 3 dB fiber coupler that split the light into the reference arm and the sample arm. The sample light was delivered to a delivery system with a telecentric design consisting of an X-Y galvanometer scanner and the optics for delivering it to the anterior segment of the eye. The system also collected the backreflected sample light. The power of the sample light was lowered to 750 μW by adjusting the source power with a fiber-based pigtail style attenuator to ensure that the light intensity delivered to the eye was safe.
In the detection arm, a spectrometer consisting of a collimating lens (f = 50 mm), a 1,200 line/mm transmission grating, an achromatic imaging lens (f = 180 mm), and a line scan CCD camera (Aviiva-M2-CL-2014, 2048 pixels with 14 μm pixel size operating in 12-bit mode) was used to detect the combined reference and sample light. The calculated spectral resolution was 0.055 nm, corresponding to a detectable depth range of 3.1 mm in air. The image captured by the camera was fed to an acquisition board and then transferred to a computer workstation (IBM Intel-liStation Z Pro, dual 3.6 GHz processor, 3 GB memory) for signal processing and image display. The A-line (depth scan) rate of the OCT system was set at 24 kHz. Under these operating conditions, the measured sensitivity was approximately 95 dB. The calibrated axial resolution of the system was ~4 μm in air, corresponding to ~3 μm in the water or tissue with a refractive index of ~1.33.
Six eyes of three healthy subjects were imaged while wearing two types of soft contact lenses. One was the PureVision lens (Bausch & Lomb, Rochester, NY) with base curves of 8.3 and 8.6 mm, and the other was the ACUVUE Advance lens (Vistakon, Jacksonville, FL) with base curves of 8.3 and 8.7 mm. A rigid gas permeable hard lens (Boston, Frontier Contact lens lab, Buffalo, NY) with an 8.05 mm base curve, 9.5 mm diameter, and –2.00 Diopter power was also used to demonstrate the capability of imaging the post-lens tear film and changes after blinking. Refresh Liquigel (Allergan, Irvine, CA) was used to demonstrate the effect of artificial tears on the tear film. Linear scans crossing the corneal apex with 6 to 12 mm scan widths were used to image the corneal apex and limbus region. To view the lens edge, the temporal limbus region was imaged when the subject looked 45 degrees nasally. To highlight the tear menisci around the lens edge, one drop of a contrast enhancement media (0.5% Intralipid) and one drop of artificial tears (Refresh Liquigel) were mixed and then instilled onto the eye. Intralipid was chosen for this purpose because of its light scattering property. Measurements were made with custom software to yield thickness information of the tear film and layers of the corneal epithelium.
RESULTS
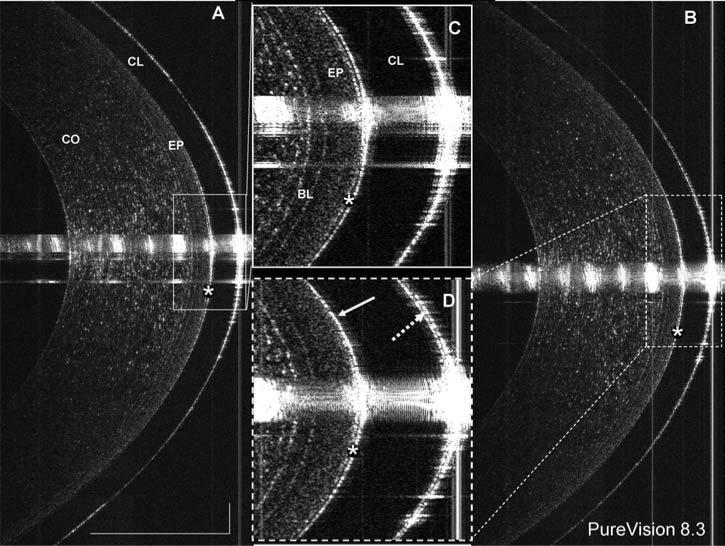
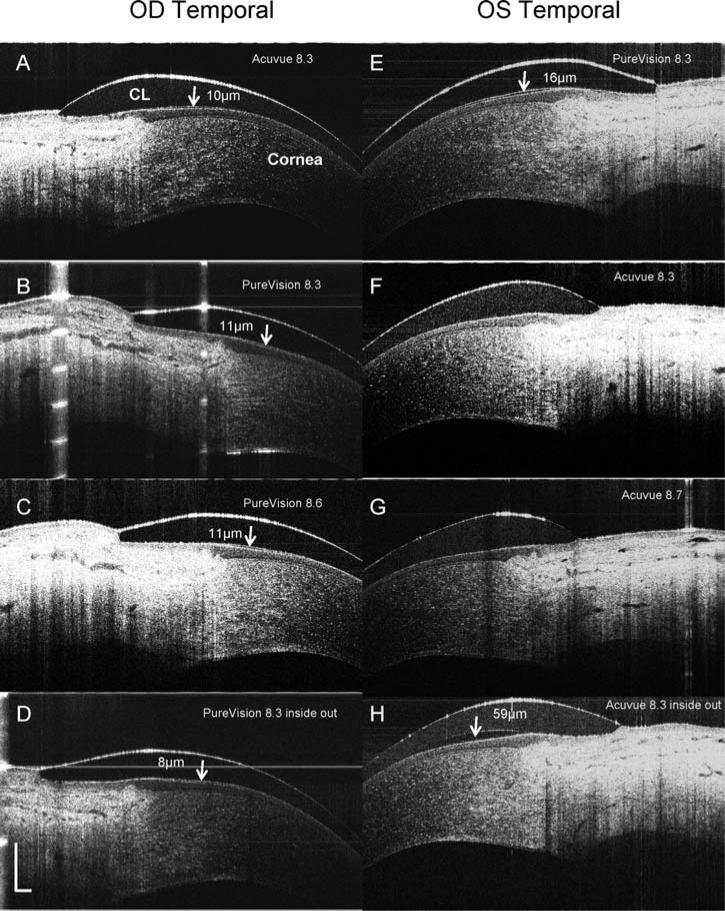
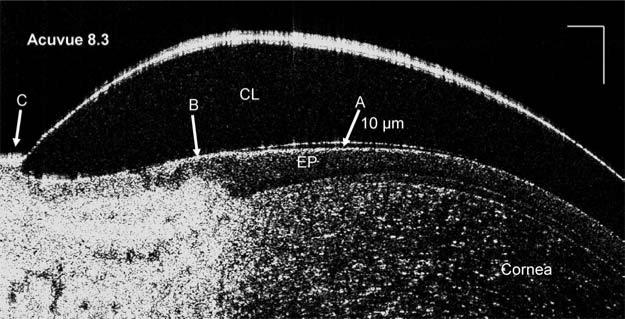
Immediately after insertion of a PureVision lens with an 8.3 mm base curve (Fig. 1A), the post-lens tear film of 6 μm in thickness was visualized. After a blink (Fig. 1B), the pre-lens tear film thickness was 5 μm, and the post-lens tear film was 5 μm thick. Unique interactions with ocular surfaces were evident with the different types of soft lenses, base curves, and lens edge configurations. Different thicknesses of the post-lens tear film under the lens edge were present with different types of lenses and base curves (Fig. 2A–C, E–G). Fitting with inside out lenses, the PureVision lens had a thinner post-lens tear film, 8 μm (Fig. 2D), than did the ACUVUE lens, 59 μm (Fig. 2H). With an enlarged image of an ACUVUE lens, the structure between the lens edge and cornea was clearly visualized and the post-lens tear film was approximately 10 μm (Fig. 3).
FIG. 1.
Direct visualization of tears on a contact lens. A PureVision lens with base curve of 8.3 mm was fitted onto the eye. Using ultra-high resolution OCT with an 8 mm scan width, images were taken at the center of the cornea (A) immediately after lens insertion and (B) after one blink. The post-lens tear film (*) was clearly visualized in the highly magnified images (C and D). The post-lens tear film was 6 μm thick immediately after lens insertion (C) and 5 μm thick after the blink (D). After the blink (B and D), the pre-lens tear film (dotted arrow) was 5 μm thick. Interestingly, after the blink, the post-lens tear film was not visualized in the upper portion of the cornea (solid arrow in D), possibly due to pressure exerted by the lid during the blink. The bars denote 500 μm for two images (A and B).
FIG. 2.
OCT images of contact lens edges in situ. PureVision (E, B, C, D) and ACUVUE Advance (A, F, G, H) lenses with different base curves were fitted on the eyes of a subject. The lens edges were visualized in OCT images that were taken from the temporal side when the subject looked at a nasally located target. OCT scanning with an 8 mm scan width was directed at a right angle to the edge of the lens (CL). The post-lens tear film was visualized with the PureVision lens images (B, C, D, and E) and in some ACUVUE lens images (A and H). After the lenses were fitted inside out (D and H), the post-lens tear film was visualized with both. Note the configurations of the lens edges are different with a round edge in the Pure-Vision and a sharp edge in the ACUVUE lens. The thickness of the post-lens tear films were measured at the locations marked (arrows). Bars = 500 μm.
FIG. 3.
Highly magnified image of a contact lens edge. (A) Highly magnified to show the configuration of the lens (CL) edge and its interaction with the epithelial surface (EP). The post-lens tear film thickness was 10 μm at the location marked (arrow A). The junction between the corneal epithelium and conjunctival epithelium was very clearly shown (arrow B). At the edge of the lens, the conjunctiva appeared to seal off the lens opening (arrow C). Bars = 250 μm.
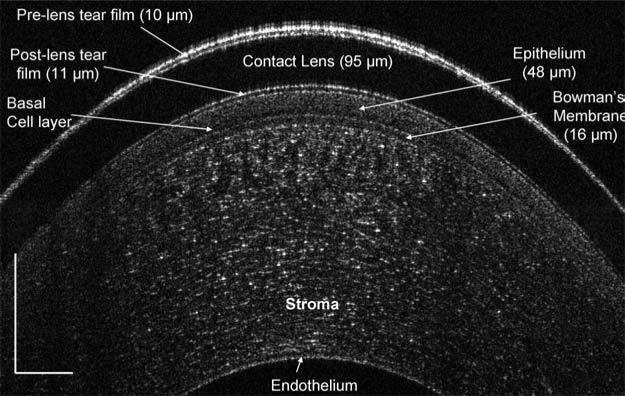
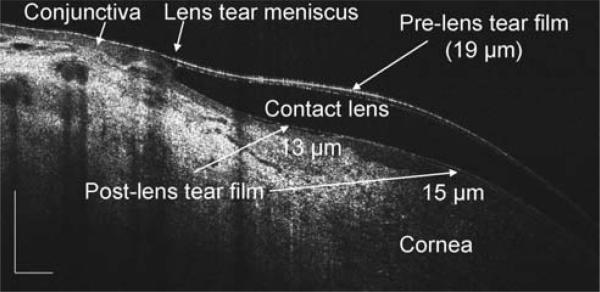
In the central cornea with a PureVision contact lens, the preand post-lens tear films, 10 μm and 11 μm, respectively, were clearly imaged immediately after lens insertion and instillation of one drop of artificial tears (Fig. 4). The corneal epithelium, 48 μm including the basal cell layer, and Bowman's layers, 16 μm, were also apparent. On the same eye, the edge configurations of the lens and tear meniscus were also imaged (Fig. 5). The pre-lens tear thickness was 19 μm and the post-lens tear thickness was 13 μm.
FIG. 4.
The central cornea with a PureVision lens after instillation of artificial tears. The central cornea was imaged with 6 mm scan on the horizontal median. The image was taken immediately after lens insertion and instillation of one drop of artificial tears. The epithelium, including the basal cell layer, and Bowman's membrane evident, and the pre- and post-lens tear films were clearly visualized. Total cor-neal thickness was measured as 526 μm. Bars = 250 μm.
FIG. 5.
The tears on the edge of a contact lens after instillation of artificial tears. The same eye imaged in Fig. 4 was re-imaged from a side view as the subject looked 45 degrees nasally, revealing the lens edge configuration and its relationship to the ocular surface, as well as the pre- and post-lens tear films. The thickness, noted on the image, was measured at the locations marked (arrows). Bars = 500 μm.
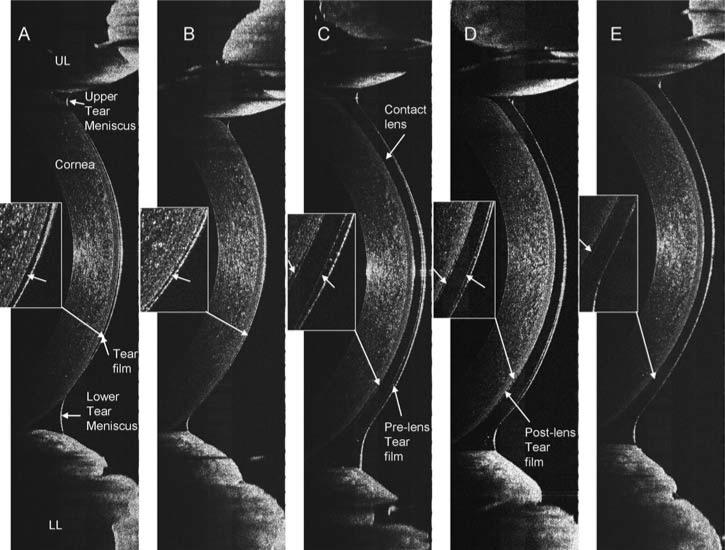
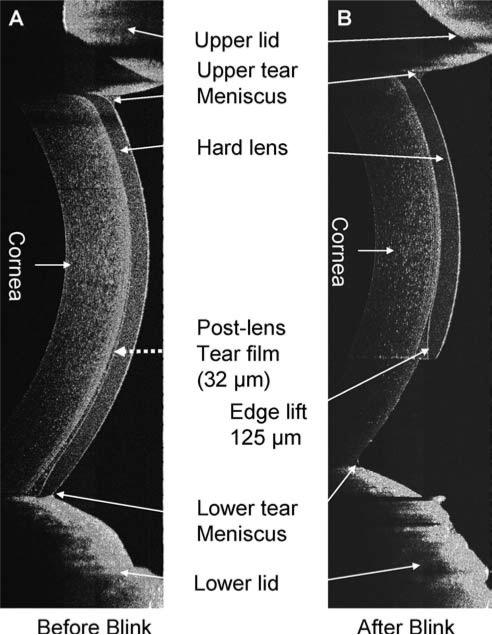
After the instillation of a drop of artificial tears, the tear film on the cornea without a contact lens and tear menisci around upper and lower eyelids were visualized (Fig. 6A). Recovery was evident 5 min after the instillation (Fig. 6B). On the same eye, a PureVision was fitted, and one drop of the artificial tears was instilled on the lens before the lens was inserted onto the eye (Figs. 6C-E). The pre- and post-lens tear films were evident. Tear menisci were located around the upper and lower eyelids; however, the boundary between the tear and lens was obscured due to the lower scattering of the reflected light. Two minutes after the insertion, the pre- and post-lens tear films were still apparent, especially at the inferior portion of the lens (Fig. 6E). The hard lens was imaged immediately after the insertion, before (Fig. 7A) and after (Fig. 7B) blinking. The lens was pulled up immediately after blinking, and the post-lens tear film was diminished, indicating that the fitting was too flat. After instillation of the contrast enhancement media, the boundaries of the tear menisci on a soft contact lens were highlighted (Fig. 8).
FIG. 6.
The tears on the ocular surface and contact lens. A vertical 12 mm OCT scan was performed. After the instillation of one drop of the artificial tears, the tear film on the cornea without a lens and tear menisci around the upper (UL) and lower (LL) eyelids were clearly visualized (A with enlarged inset), and recovery was evident 5 min after the instillation (B with enlarged inset). On the same eye, a PureVision lens was fitted, and one drop of the artificial tears was instilled. The pre- and post-lens tear films (arrows) were imaged (C–E with enlarged insets). Tear menisci were located around the upper and lower eyelids. Note that the boundary between the tear and lens was not clearly visualized, due to the lower light scattering. Two minutes after the insertion, the tear films were still visualized, especially underneath the lower part of the lens (E).
FIG. 7.
Tears on hard contact lenses. A Boston RGP lens was fitted on one eye. The lens was well centered before blinking (A), and the tear film thickness was 32 μm (arrow). The lens was decentered after blinking and the edge lift was measured as 125 μm (B).
FIG. 8.
Contrast enhancement media (intralipid) highlights the tear menisci on the lens. To highlight the tear menisci on the lens around the lens edge, a contrast enhancement media (0.5% Intralipid) mixed with the artificial tears was instilled onto the eye. The boundaries of the tear menisci were highlighted.
DISCUSSION
Because the OCT technique was suggested for imaging the anterior segment of the eye,3 many studies have been reported using commercial4,5 and custom-built OCT6–8 instruments. With the time domain OCT system, changes observed in the tear film and menisci have lead to a better understanding of human tear dynamics.6,9 Contact lenses on the eye have been studied with high speed spectral domain OCT,10,11 and the authors suggested that OCT may be very useful in the evaluation of contact lens fitting. However, there are no reports of OCT imaging of the tear film and menisci on contact lenses. The neglect is mainly due to the difficulty of imaging the tears, which are thin and continuously change with blinking.
The ultra high resolution OCT instrument used in this study provides high quality images for the visualization of the tears on and underneath the lens and around the lens edge. Using a similar OCT instrument, Christopoulos et al.7 imaged the eye with various ophthalmic conditions and after LASIK and Descement membrane stripping endokeratoplasty. The highly magnified view of the cornea was very helpful in understanding the pathologic features, and the authors suggested that the ultra-high resolution OCT may improve surgical management. Using a high resolution (4–6 μm) OCT, contact lenses on the eye were imaged for the evaluation of the lens fit by Kaluzny et al.10,11 who suggested that the device may be useful in contact lens practice for better diagnosis, evaluation, and documentation of lens-related complications. In their study, no tears on the lens were imaged.
To the best of our knowledge, this is the first time OCT has been used for directly imaging the post-lens tear film without the aid of artificial tears. Based on the high speed of the current OCT instrument, we successfully imaged the dynamic changes of the tears at the edges of both soft and hard lenses and under the hard lens as well. With the exception of orthokeratology cases,12 this breakthrough technique clearly opens a door to thoroughly studying lens fitting characteristics and identifying ways to improve ocular comfort. Examination of the time course of changes in the post-lens tear film and interactions between the lens edge and ocular surface are now possible and merit study with a large group of eyes.
We also examined the differences between two types of lens materials and back curves to demonstrate the capability of our system for recording different fitting characteristics. Examining the configuration of the lens edge and its interaction with the ocular surface may lead to a better understanding of lens designs and tightness of the lens fitting that determines the rate of tear exchange underneath the lens. Although a larger sample size is needed to draw conclusions, this demonstration with a limited number of eyes provides the evidence of the system capability for future studies.
With the aid of the contrast media, OCT can be used to precisely estimate tear menisci and tear volume on the contact lenses as shown here. If the contrast medium is placed around the edge of the lens, tear exchange underneath the lens can potentially be monitored. This would enable a new era of studies that could provide a better estimate of tear turnover time beneath the lens and a better understanding of the effects of lens composition and design on tear dynamics.
There are some limitations of the method. The 3 μm resolution of the current system can only to be used to visualize tear films thicker than 3 μm. The tear film was not visualized a few minutes after lens insertion because the thickness decreased. In this case, indirect calculation as demonstrated in previous studies9 is needed. The OCT images were not corrected for optical distortion as described in a previous study.13 This issue needs to be addressed when measuring topographical thickness profiles of the tear film. The scan depth of this system has a limit of 3 mm, and a deeper scan cannot be achieved for imaging the entire lens in situ. The lack of automatic image processing software for ultra high resolution OCT images may limit its usage in clinical studies.
Further developments will mitigate these limitations. The conjugated artifact will be removed to increase the scan depth for deep scans of the anterior segment of the eye. Automatic image process software will be developed for various studies. Three-dimensional scanning with a large scan width will be developed to image the tear film on the entire ocular surface.
In summary, this study has demonstrated for the first time the feasibility of directly visualizing the tears on soft and hard contact lenses in situ using ultra high resolution OCT. Developments of both hardware and software are in progress that will refine and extend the ability to study contact lens tear dynamics and fitting characterization. This novel method may open a new field in studying contact lenses.
ACKNOWLEDGMENT
The authors thank Dr. Britt Bromberg of Xenofile Editing for providing editing services for this article.
Supported by research grants from NEI (R03 EY016420), NEI core center grant P30 EY014801, UM Scientific Award Committee, Allergan, Bausch & Lomb, and Research to Prevent Blindness (RPB).
REFERENCES
- 1.Caffery B, Richter D, Simpson T, et al. The prevalence of dry eye in contact lens wearers: Part 2 of the Canadian Dry Eye Epidemiology study. Optom Vis Sci. 1996;73:109. [Google Scholar]
- 2.Caffery BE, Richter D, Simpson T, et al. CANDEES. The Canadian Dry Eye Epidemiology Study. Adv Exp Med Biol. 1998;438:805–806. [PubMed] [Google Scholar]
- 3.Izatt JA, Hee MR, Swanson EA, et al. Micrometer-scale resolution imaging of the anterior eye in vivo with optical coherence tomography. Arch Ophthalmol. 1994;112:1584–1589. doi: 10.1001/archopht.1994.01090240090031. [DOI] [PubMed] [Google Scholar]
- 4.Muscat S, Parks S, Kemp E, et al. Repeatability and reproducibility of macular thickness measurements with the Humphrey OCT system. Invest Ophthalmol Vis Sci. 2002;43:490–495. [PubMed] [Google Scholar]
- 5.Wang J, Fonn D, Simpson TL, et al. Relation between optical coherence tomography and optical pachymetry measurements of corneal swelling induced by hypoxia. Am J Ophthalmol. 2002;134:93–98. doi: 10.1016/s0002-9394(02)01517-9. [DOI] [PubMed] [Google Scholar]
- 6.Wang J, Aquavella J, Palakuru J, et al. Repeated measurements of dynamic tear distribution on the ocular surface after instillation of artificial tears. Invest Ophthalmol Vis Sci. 2006;47:3325–3329. doi: 10.1167/iovs.06-0055. [DOI] [PMC free article] [PubMed] [Google Scholar]
- 7.Christopoulos V, Kagemann L, Wollstein G, et al. In vivo corneal high-speed, ultra high-resolution optical coherence tomography. Arch Ophthalmol. 2007;125:1027–1035. doi: 10.1001/archopht.125.8.1027. [DOI] [PMC free article] [PubMed] [Google Scholar]
- 8.Sarodia U, Sharkawi E, Hau S, et al. Visualization of aqueous shunt position and patency using anterior segment optical coherence tomography. Am J Ophthalmol. 2007;143:1054–1056. doi: 10.1016/j.ajo.2007.02.023. [DOI] [PubMed] [Google Scholar]
- 9.Palakuru J, Wang J, Aquavella J. Effect of blinking on tear dynamics. Invest Ophthalmol Vis Sci. 2007;48:3032–3037. doi: 10.1167/iovs.06-1507. [DOI] [PubMed] [Google Scholar]
- 10.Kaluzny BJ, Fojt W, Szkulmowska A, et al. Spectral optical coherence tomography in video-rate and 3D imaging of contact lens wear. Optom Vis Sci. 2007;84:1104–1109. doi: 10.1097/OPX.0b013e31815b9e0e. [DOI] [PubMed] [Google Scholar]
- 11.Kaluzny BJ, Kaluzny JJ, Szkulmowska A, et al. Spectral optical coherence tomography: A new imaging technique in contact lens practice. Ophthalmic Physiol Opt. 2006;26:127–132. doi: 10.1111/j.1475-1313.2006.00371.x. [DOI] [PubMed] [Google Scholar]
- 12.Mountford J, Cho P, Chui WS. Is fluorescein pattern analysis a valid method of assessing the accuracy of reverse geometry lenses for orthokeratology? Clin Exp Optom. 2005;88:33–38. doi: 10.1111/j.1444-0938.2005.tb06661.x. [DOI] [PubMed] [Google Scholar]
- 13.Westphal V, Rollins A, Radhakrishnan S, et al. Correction of geometric and refractive image distortions in optical coherence tomography applying Fermat's principle. Opt Express. 2002;10:397–404. doi: 10.1364/oe.10.000397. [DOI] [PubMed] [Google Scholar]


